The effects of blended instruction on oral reading performance and their relationships to a five-factor model of personality
Bạn đang xem bản rút gọn của tài liệu. Xem và tải ngay bản đầy đủ của tài liệu tại đây (718.71 KB, 21 trang )
Knowledge Management & E-Learning: An International Journal, Vol.2, No.3.
The Effects of Blended Instruction on Oral Reading
Performance and their Relationships to a Five-Factor
Model of Personality
Noritake Fujishiro*
Okayama Pref. Center of Education, Japan
7545-11 Yoshikawa, Kibi Chuo-Cho, Kaga-Gun, Okayama Prefecture,
716-1241 Japan
E-mail:
Isao Miyaji
Faculty of Informatics,
Okayama University of Science, Japan
1-1 Ridai-cho, Kita-ku, Okayama City, 700-0005 Japan
E-mail:
*Corresponding author
Abstract: In recent times, „Blended Instruction‟ - an effective method of
instructions utilizing e-Learning materials in English education - consists of an
individual learning part, a collaborative learning part and a teacher instruction
part. In the individual learning, students act out model dialogues in the WBT
courseware which incorporated a high quantity of video and sound clips. In the
collaborative learning, students perform the dialogues in pairs and assessed
each other‟s performance. Our recent research in a high school showed that the
skill of the students‟ oral reading was improved in most criteria of assessment
through blended instruction. However, it is still not clear what kind of
relationship exists between the development of the students‟ oral reading skills
and their personalities. With this in mind, the authors have studied the effects of
the blended instruction on the junior high school students‟ oral reading
performance and their relationships to the five-factor model of personality. The
result of the research shows that the skill of the students‟ oral reading was
improved in most criteria of assessment and the blended instruction was
effective for the personality group, „Introverted unintelligent person‟ in the
most categories of oral reading criteria as well as the personality group,
„Sociable hard-worker‟. The important factor for that group in oral reading
performance turned out to be „Sense Reading‟.
Keywords: Blended Instruction, Foreign Language Education, Oral Reading
Performance, WBT, Five-Factor Model.
Biographical notes: Noritake Fujishiro received Ph.D. degree from Okayama
University of Science. He is a teacher consultant of Okayama Prefectural
Center of Education, Japan. He has been researching on the effects of Blended
learning utilizing WBT courseware on students‟ English proficiency.
Isao Miyaji received Ph.D. of Engineering from Kyoto University. He is a
professor with Faculty and Graduate School of Informatics of Okayama
University of Science. His research interests are in blended learning and
225
226
Fujishiro, N., & Miyaji, I.
improvement of the instruction technique with ICT. He is a president at
Chugoku Branch of JSSE.
1. Introduction
One of the main aims of English education at junior high school and high school in Japan
is to develop students‟ practical communication skills. However, it is quite difficult for
teachers to instruct their students individually in listening and speaking activities, because
teachers do not have the time to devote their attention to each student in turn. In order to
improve this situation, e-Learning has been greatly focused on in recent years in Japan.
Widdowson (1978) defined that speaking is an auditory and visual activity. For
instance, nonverbal information, such as gestures and facial expressions, can be conveyed
as visual information in the process of sending and receiving messages. According to the
McGurk effect, comprehending a situation with a visual cue could make a listening
comprehension much easier (McGurk, 1976). According to the Dual-coding theory
(Clark and Pavio, 1991), visual and verbal information are processed respectively in each
channel according as the kind of incoming information and cognitive resources can be
used most effectively by synchronizing visual and verbal codes because the visual and
verbal information does not compete with each other.
With this in mind, the authors developed a WBT courseware which includes a
large quantity of video and sound clips as visual and verbal aids for an individual
conversation practice (Fujishiro & Miyaji, 2007a). The students could make a virtual
conversation practice with it effectively before making a real conversation.
Fujishiro et al. (2007b) reported that the listening ability improved for students
with both low and high English proficiency and that less motivated students became more
positive through „Blended learning lessons‟ in a junior high school, which consisted of an
individual learning part in which students complete a model dialogue in the original
WBT courseware, a collaborative learning part in which the students perform the
dialogues in pairs and assess each other‟s performance and a teacher‟s scaffoldings part.
According to our previous study in a high school (Fujishiro & Miyaji, 2008), the
students‟ oral reading skill was improved and their motivation toward expressing
themselves in English was developed through blended learning with WBT courseware.
However, there was no investigation into the relationship between the development of the
students‟ oral reading skill and their personality.
This paper investigates how the blended instruction with WBT courseware in a
class at a junior high school level enhances students‟ oral reading skill phonetically and
how the oral reading skill of personality groups classified according to the five-factor
model is improved. This paper also investigates the important factors for each personality
group in oral reading performance.
2. Background of the Study
2.1. Utilization of WBT and the Shadowing Activity
In the process of improving English listening comprehension and speaking skill, it is
important to have practical experiences with multimedia materials (Scanlon, 1997) which
help practice pronouncing the conversation and have a virtual conversation.
Knowledge Management & E-Learning: An International Journal, Vol.2, No.3.
227
Rivers (1972) put the process of language learning with multimedia materials into
a diagram which showed the steps from skill-getting to skill-using. Paulston (1992)
reconstructed it into three steps; step 1 was a mechanical drill, step 2 was a meaningful
drill and step 3 was communicative drill. Based on this, Takanashi (1992) classified
activities in English classes into four steps from A to D; Step A consisted of mechanical
and meaningful drills, Step B was a communicative drill, Step C meant information gap
activities and Step D consisted of role play and simulation, and reported that the level of
meaningfulness and creativity of activities became higher in alphabetical order.
In terms of procedure of instruction, Koike et al. (1994) proposed three stage
instructional approach; the 1st stage was „comprehension‟ of the vocabulary, grammar
and expression, the 2nd stage was „drill‟ of pronunciation and sentence patterns which
included copying a conversation and repetitive practice, and the 3rd stage was
„application‟ which included controlled conversation practice and collaborative
communication activity. It could be thought that the notion of “mimicry-memorization
practice” was applied to „copying a conversation‟ practice in the 2nd stage and the
utilization of a high quantity of video and sound clips in the WBT courseware for acting
out model dialogues is useful.
Tamai (2005) reported that listening ability improved for students with middle
and low English proficiency through “Shadowing” activities, where the students repeated
the phrases from a conversation model almost simultaneously. Mochizuki (2004)
reported the shadowing activity was effective in developing the students‟ oral reading
performance.
With this in mind, the authors utilized the WBT courseware developed in 2006
(Fujishiro & Miyaji, 2007a), to assist the students‟ individual shadowing activity and
virtual conversation. As procedure of instruction, the authors took three stage
instructional approach, „Comprehension‟, „Drill‟ and „Application‟. The WBT material is
made up of four stages per topic; the four stages consist of „Reading‟, „Conversation
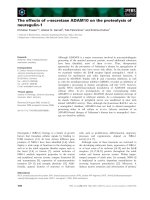
Practice‟, „Expressing Ideas‟, and „Let‟s Talk‟. As for characteristics, the WBT
courseware has a large quantity of video and sound clips as conversation models and
learners can easily practice acting out their own part of the dialogue to a conversation
model as shown in Figure1.
In this study, the shadowing activity was conducted on every lesson using
numerous video and sound clips in the WBT courseware as a „Conversation Model‟ for
self-practice on each topic.
Caption of
Dialogue
Figure 1. Conversation Model
228
Fujishiro, N., & Miyaji, I.
2.2. Definition of Blended Instruction
The instructional approach of “Blended Instruction” is based on the notion of Blended
Learning. Usual blended instruction is the combination of face-to-face instruction
“inside” the classroom and the e-Learning “outside” the classroom (Bonk & Graham,
2006). For instance, Miyaji et al. (2005) reported the effectiveness of this kind of blended
instruction in which lectures and e-learning outside the lecture were combined in the
university. On the other hand, there is another definition for blended learning, in which
blended instruction means the combination of various style of learning activities (Gagne
2005). In terms of utilization of e-learning at a junior high school, an individual learning
part with WBT courseware at their own pace can be blended and well-balanced with
other styles of learning activity in a classroom.
Wilson (2005) examined the combination of e-learning and lessons; „e-learning
before a lesson‟, „e-learning in a lesson‟ and „e-learning after a lesson‟, and reported that
„e-learning in a lesson‟ is effective for presentation of new materials and review as
students have access to a teacher‟s instruction and can receive feedback.
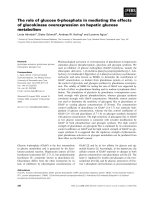
As shown in Figure2, the components of the blended instruction in this study
consist of three learning parts, students‟ individual learning part with a WBT courseware,
a collaborative learning part and a teacher‟s face-to-face instruction part (Fujishiro &
Miyaji, 2009a). Fujishiro et al. (2007b) reported that it was appropriate in a junior high
school to combine those three learning parts in one learning opportunity in terms of
maintaining students‟ motivation toward learning and individualization of learning. The
instructional mode in which those three parts are combined “inside” the classroom is
called “Blended Instruction” in this study.
In this blended instructional mode, collaborative learning part in pairs is based on
the notion of peer tutoring (Goodlad 1985), where students learn through instructing each
other what is wrong, and the notion of peer assessment (Davies 1999), where students
assess each other‟s performance. Collaborative learning in pairs or in groups would be
effective in language acquisition as it helps increase interactions among students and both
input and output in the classroom (Pica & Doughty, 1985). This style of blended
instruction, which includes collaborative learning, has been highly evaluated and widely
recognized recently (Gagne et al., 2005, p.334). The teacher‟s instruction in this
combination was based on the notion of teacher‟s appropriate scaffolding for students in
the Vygotsky's theory (Van Der Stuyf 2002).
Collaborative Learning
Student
(Peer Tutoring)
(Peer Assessment)
Individual
Learning
Group
Instruction
(Scaffolding)
WBT
WBT
Reference
to Students’
Learning
Record
Student
Individual
Learning
Group
Instruction
(Scaffolding)
Teacher
Teacher
Figure 2. Blended Instruction Model (Fujishiro &Miyaji, 2009)
Knowledge Management & E-Learning: An International Journal, Vol.2, No.3.
229
2.3. The Five-Factor Model of Personality
The personality of each student is different and it is thought to have an influence on the
learning effect. Nunomura & Murakami (1996) reported that the factors of personality
had significant correlations with English speaking and listening tests. It is important to
examine the key factors of the students‟ personality in verifying the effects on oral
reading performance through blended instruction.
In the field of personality psychology, Allport and Odbert (1936) provided the
original source of personality-related terms by listing about 18,000 descriptors found in
an unabridged English dictionary (McAdams, 1992). Through a series of steps, Tupes
and Christal (1961) suggested only five replicable factors. Across a wide variety of
studies involving trait-descriptive terms, five broad factors have consistently been found
(Goldberg, 1992). The general consensus has been that the basic dimensions of
personality were made of five factors (Wiggins & Trapnell, 1996). These factors build
the so called „Big Five‟ or Five-Factor model. The five-factor consists of “Extroversion”,
“Agreeableness”, “Conscientiousness”, “Neuroticism”, “Openness”. In this study, the
students were classified into four groups based on this five-factor model and the degree
of development in each category of oral reading criteria was examined.
3. Research Methods
3.1. Participants
In the Experiment 1 at the T Junior High School in Okayama Prefecture in Japan during
the school year 2008, blended learning group with WBT (Experimental group) consisted
of 31 third year students that belonged to advanced classes of the subject „English,‟ and
the control group consisted of 30 third year students that belonged to intermediate classes
of the subject „English.‟
In the Experiment 2 at the U Junior High School in Okayama Prefecture during
the school year 2009, blended learning group with WBT (Experimental group) consisted
of 94 third year students that belonged to class A, B or C and the control group consisted
of 68 third year students that belonged to class D or E.
However, the valid number of students analyzed is lower because of absence.
3.2. Research on the Effects through Blended Instruction
In order to measure the oral reading skill, three levels of material for oral reading tests
were prepared; Word (four words), Sentence (two sentences × two), Passage (Passage
consisted of 66 words). These materials were formed from the list of words and sentences
which were proposed by Endou (2005) based on the British National Curriculum. The
materials were chosen so that it might not be difficult for the students to read them aloud
smoothly.
In order to assess how the blended learning with WBT courseware worked in
terms of oral reading performance, the we set four levels of criteria; word, sentence,
passage and total level, and categories in each level, as shown in Table 1 and recorded the
students reading aloud task materials using a digital video recorder before and after the
lessons. In the Experiment 1, two raters, an ALT (Assistant Language Teacher) who was
a native speaker of English and a JTE (Japanese Teacher of English), discussed and
scored the students‟ performance watching the recorded students‟ oral reading
performance from 5 to 1; 5:Excellent, 4:Good, 3:Average, 2:Poor, 1:Very Poor. In the
Experiment 2, the two raters, an ALT and a JTE, scored the students‟ performance
230
Fujishiro, N., & Miyaji, I.
separately watching the recorded students‟ oral reading performance from 5 to 1;
5:Excellent, 4:Good, 3:Average, 2:Poor, 1:Very Poor, so that the assessments by the two
raters might not be mutually influenced and the average score of the two raters was
calculated out to be the assessment score of oral reading skill.
In order to verify the effect on the students‟ mental aspect, pre and post surveys
were carried out. As shown in Table 2, each survey in Experiment 1 consisted of 24
questions, out of which 22 questions were multiple-choice, each with five possible
answers given. The multiple-choice questions were scored from 5 to 1 as in the previous
study (Fujishiro & Miyaji, 2007c). As shown in Table 3, each survey in Experiment 2
consisted of 25 questions, out of which 22 questions were multiple-choice, each with five
possible answers given. The multiple-choice questions were scored from 5 to 1 in the
same way as Experiment 1.
Table 1. Oral Reading Assessment Criteria
<Word Level>
-Pronunciation: whether the student can pronounce the words correctly or not
-Stress: whether the word stress which the student marks is appropriate or not
-Intonation: whether the intonation with which the student talks is good or not
-Attitude: whether the student reads aloud with positive attitude or not
-Volume: whether the student reads aloud with clarity and with loud voice or not
<Sentence level>
-Pronunciation: whether the student can pronounce the words correctly or not
-Stress: whether the word stress which the student marks is appropriate or not
-Sentence Stress: whether the sentence stress which the student marks is
appropriate or not
-Intonation: whether the intonation with which the student talks is good or not
-Fluency: whether the student talks fluently with proper speed and rhythm or not
-Liaison: whether the student reads aloud with „Liaison‟ or not
-Sense Reading: whether the student makes proper pause placement according
to the sense group or not
-Attitude: whether the student reads aloud with positive attitude or not
-Volume: whether the student reads aloud with clarity and with loud voice or not
<Passage Level>
-Pronunciation: whether the student can pronounce the words correctly or not
-Stress: whether the word stress which the student marks is appropriate or not
-Sentence Stress: whether the sentence stress which the student marks is
appropriate or not
-Intonation: whether the intonation with which the student talks is good or not
-Fluency: whether the student talks fluently with proper speed and rhythm or not
-Liaison: whether the student reads aloud with „Liaison‟ or not
-Sense Reading: whether the student makes proper pause placement according
to the sense group or not
-Message: whether the passages that the student reads aloud convey the content
or not
-Attitude: whether the student reads aloud with positive attitude or not
-Volume: whether the student reads aloud with clarity and with loud voice or not
<Total>
-Total Impression: Total Impression through oral reading
Knowledge Management & E-Learning: An International Journal, Vol.2, No.3.
Table 2. Survey in Experiment 1
Table 3. Survey in Experiment 2
231
232
Fujishiro, N., & Miyaji, I.
3.3. Classification based on Personality
In order to clarify what kind of personality groups existed and for what kind of
personality groups the blended instruction was effective, the students were advised to
take the BigFive personality survey (Murakami & Murakami, 2001) which consisted of
70 Yes/No questions. Using the computer personality judging system, „BigFive‟, which
was developed by Murakami et al. (2001), the scores for the five-factors were calculated.
Based on the scores, the students could be classified into some clusters based on the
principal component analysis and the cluster analysis (Fujishiro & Miyaji, 2009b).
4. Experiments and Results
4.1. The Blended Learning Lessons
The blended learning lessons with WBT courseware were carried out at two junior high
schools in Okayama Prefecture in Japan. Six English lessons were assigned to the third
year students for that purpose on each school. Experiment 1 at T Junior High School was
during the period Sept. 29th to Dec. 1st, 2008. The blended learning lessons were
conducted in two classes, consisting of 31 students in total. Experiment 2 at the U Junior
High School was completed during the period Oct. 23rd to Nov. 16th, 2009. The blended
learning lessons were conducted in three classes, consisting of 94 students in total.
The main learning style, instructional step and activities of blended instruction are
shown in Figure 3. Nine instructional steps and activities were set according to Gagne‟s
„Nine Instructional Steps‟ (Gagne et al., 2005, p.248). Especially at the 6th step „Elicit
Performance‟, individual conversation practice utilizing the WBT courseware at students‟
own pace and collaborative learning in pairs using the dialogue completed in the
individual practice were combined.
Learning Style
Instructional Step and Activity
Group
1. Gain Attention of Learner
2. Inform Learner of Objective
(whole Class)
Individual
(WBT)
Group
(Whole Class)
Pair
Individual
(WBT)
Pair
Group
3. Stimulate Recall of Prerequisites
Individual Learning:
Listening Comprehension Check
4. Present Stimulus Material
5. Provide Learning Guidance
Chorus reading
Oral reading in pairs
6. Elicit Performance
Individual conversation practice
(Shadowing)
Acting out dialogues in pairs
Mutual assessment
7. Provide Feedback
(Whole Class)
Individual
(WBT)
Pair
8. Assess Performance
Expressing one‟s own opinion
about topics
9. Enhance Retention and Transfer
Group
(whole Class)
Figure 3. Instructional Mode and Steps of Blended Instruction (Fujishiro &Miyaji, 2009)
Knowledge Management & E-Learning: An International Journal, Vol.2, No.3.
233
The procedure during the lessons considered the following steps:
Listening Comprehension Check; Listening and answering the questions (WBT)
Teacher‟s Instruction; the teacher gives instructions about useful expressions
(Class)
Conversation Practice with WBT courseware; Listening to the conversation model
in the WBT courseware and acting out the dialogue with the model (WBT)
Conversation Practice; Acting out the dialogue with a partner and peer assessment
(Pair work)
Presentation; Acting out the dialogue in front of other students (Class)
In the control group, the same content was taught entirely by a teacher instead of
by individual conversation practice utilizing WBT courseware and collaborative learning
in pairs.
4.2. Results of the Study
4.2.1. The Personality Groups
The principal component analysis was conducted using the five-factor scores from the
BigFive personality survey in Experiment 1 and Experiment 2. In Experiment 1, the first
and second principal components accounted for 36.4% and 31.0% of the total variance.
The first principal component was interpreted as „Sociality‟, as “Extroversion”,
“Agreeableness” and “Neuroticism” of five-factors were greatly related to it. The second
principal component was interpreted as „Intelligence‟, as “Conscientiousness” and
“Openness” were greatly related to it.
In Experiment 2, the first and second principal components accounted for 30.1%
and 25.4% of the total variance. The first principal component was interpreted as
„Sociality‟ and the second principal component was interpreted as „Intelligence‟ in the
same reason as Experiment 1.
REGR factor score 2 (Intelligence : C, O)
By the cluster analysis, the students were classified into four groups, shown in
Figure 4 and Figure 5. The Group 1, shown in Figure 4 and Figure 5 as the „Cl 1‟, was
referred to as „Introverted hard-worker‟, the Group 2, as the „Cl 2‟, „Sociable hardworker‟, the Group 3, as the „Cl 3‟, „Sociable but unintelligent person‟, the Group 4, as
the „Cl 4‟, „Introverted unintelligent person.‟
REGR factor score 1 (Sociality : E, A, N)
Figure 4. Personality Groups in Experiment 1 Figure 5. Personality Groups in Experiment 2
234
Fujishiro, N., & Miyaji, I.
4.2.2. The Development of the Oral Reading Skill and the Personality
Groups
The authors compared the scores of the pre and post oral reading performance tests in
Experiment 1. As shown in Table 4, the result of the t-tests shows that the most
categories of oral performance except the category „Attitude‟, „Volume‟ and some
categories were improved at the significance level of 10% to 0.1%, where n is the number
of valid responses, SD stands for standard deviation. Sig. means Significance.
In terms of educational effects on each personality group, the authors also
compared the scores of pre and post oral reading performance test in each group in
Experiment 1. As shown in Table 4, the result of the Wilcoxon signed-rank test shows
that the oral reading skill of the Group 4 (Cl4) developed significantly in the most
categories of all the groups. The group whose oral reading skill developed significantly in
the second most categories of all the groups was the Group 2 (Cl 2).
After the degree of development in each category of oral reading criteria in Table
4 was calculated through subtracting the pre-score from the post-score, factor analysis
was conducted for all the 24 categories using unweighted least squares method and
varimax rotation in order to clarify the factors which contributed to the development. The
authors set the number of factors at four in terms of comparison with Experiment 2. Four
factors extracted are shown in Table 5. The contribution ratio was 61.0% in total.
Factor 1 was interpreted as “Pronunciation of Passage” because it related to the
categories of „Passage level.‟ In the same way, Factor 2 was interpreted as “Attitude and
Volume”. Factor 3 was interpreted as “Pronunciation of Sentence”. Factor 4 was
interpreted as “Pronunciation of Word”.
Table 4. The Improvement of the Oral Reading Performance and the Personality Group
(Experiment 1)
Criteria
Liaison
Fluency
Intonation
Total Impression
Sense Reading
Stress
Sentence Stress
Stress
Intonation
Pronunciation
Message
Fluency
Attitude
Sense Reading
Volume
Pronunciation
Volume
Attitude
Pronunciation
Volume
Stress
Level
Sentence
Passage
Sentence
Passage
Total
Sentence
Sentence
Passage
Sentence
Passage
Sentence
Sentence
Passage
Passage
Passage
Passage
Word
Passage
Passage
Word
Sentence
Word
Sentence
Word
Pre-test
Post-test
(n=29)
(n=29)
t-Test
Cl 1
Cl 2
Cl 3
Cl 4
(n=6)
(n=9)
(n=4)
(n=10)
mean
SD
mean
SD
Value Sig. Value Sig. Value Sig. Value Sig. Value Sig.
of t level of Z level of Z level of Z level of Z level
2.2
2.3
3.3
2.3
3.0
2.6
3.1
2.4
2.6
2.9
2.6
3.4
2.5
3.0
3.5
2.7
4.2
3.0
3.7
4.0
3.7
3.8
3.9
3.8
0.8
0.8
0.8
0.7
0.9
0.8
0.8
0.6
0.7
0.8
0.8
0.6
0.9
1.0
0.8
0.9
0.7
0.8
0.8
0.7
0.8
0.6
0.7
0.6
3.4
3.3
4.0
3.0
3.6
3.3
3.8
3.0
3.2
3.4
3.2
3.8
3.1
3.6
3.9
3.1
3.9
3.2
3.9
3.8
3.8
3.9
3.9
3.8
0.6
0.6
0.8
0.6
0.6
0.6
0.5
0.6
0.6
0.6
0.6
0.6
0.7
0.7
0.6
0.7
0.7
0.5
0.6
0.6
0.6
0.4
0.7
0.4
11.6
7.6
5.6
5.2
4.7
4.6
4.6
4.6
4.3
4.3
4.0
3.9
3.8
3.6
3.0
2.8
2.1
1.8
1.3
1.2
0.9
0.6
0.3
0.2
***
***
***
***
***
***
***
***
***
***
***
***
***
***
**
**
*
+
2.4
2.2
1.4
2.0
1.4
1.7
1.1
1.7
1.4
0.0
1.4
0.0
1.3
1.4
0.0
1.0
1.0
0.4
1.4
1.3
1.4
0.0
1.0
1.0
*
*
*
+
+
2.6
2.4
2.3
1.9
1.9
2.3
1.9
1.6
1.5
2.3
1.5
2.2
1.6
1.3
2.0
1.1
1.0
1.0
0.3
0.6
2.2
1.0
1.0
1.0
**
*
*
+
+
*
+
*
*
*
*
1.9
1.6
1.4
1.3
1.4
1.1
1.3
1.3
1.7
1.7
1.7
0.0
1.6
0.8
1.4
1.0
1.1
1.7
0.4
0.8
0.0
0.0
0.6
0.0
+
+
+
+
+
2.8
2.5
2.5
2.6
2.4
1.9
2.5
2.3
2.3
2.3
2.1
2.6
1.9
2.3
1.9
1.9
1.0
1.7
1.6
0.6
0.0
0.0
1.0
0.4
**
*
*
**
*
+
*
*
*
*
*
**
+
*
+
+
+
***:p<.001, **:p<.01, *:p<.05, +:p<.1
Knowledge Management & E-Learning: An International Journal, Vol.2, No.3.
235
Table 5. The Factor Loading of the Oral Reading Criteria after Varimax Rotation
(Experiment 1)
Criteria
Level
Fluency
Sense Reading
Passage
Message
Sentence Stress
Intonation
Total Impression
Total
Liaison
Stress
Passage
Pronunciation
Volume
Passage
Attitude
Attitude
Word
Volume
Sentence
Volume
Word
Attitude
Sentence
Pronunciation
Intonation
Sentence Stress
Liaison
Sentence
Sense Reading
Fluency
Stress
Pronunciation
Word
Stress
Contribution ratio (%)
1
0.813
0.753
0.675
0.674
0.652
0.516
0.506
0.476
0.445
0.283
0.224
-0.422
0.021
-0.242
-0.136
0.246
0.102
0.077
0.484
0.132
0.442
0.333
-0.030
-0.019
18.9
Factor
2
0.188
0.173
-0.030
-0.011
-0.038
0.434
-0.109
0.157
0.061
0.790
0.759
0.758
0.735
0.686
0.670
0.500
-0.026
-0.018
-0.049
0.111
0.025
0.115
0.203
0.114
16.1
3
0.137
-0.199
0.050
0.344
0.411
0.241
0.168
0.413
0.289
0.040
0.145
-0.178
-0.150
-0.237
0.172
0.128
0.952
0.918
0.569
0.526
0.500
0.472
-0.039
0.034
15.4
4
0.069
0.141
0.129
-0.132
-0.115
0.222
-0.132
-0.137
-0.225
-0.075
-0.075
0.306
0.075
0.345
0.141
0.065
0.002
-0.066
0.161
0.523
0.375
0.048
0.942
0.866
10.6
In order to investigate differences among the personality groups on the
development of oral reading skill, the authors conducted One-way Factorial ANOVA
using the degree of development in each category of oral reading criteria which was
calculated through subtracting the pre-score from the post-score for each personality
group. The result showed that there was no significant difference among personality
groups (F (3.86) = .639 ).
The authors conducted the discriminant analysis in order to figure out the key
factors which contribute to the classification of personality group in terms of oral reading
skill and important factors among them for each personality group. The result showed
that „Attitude‟ and „Stress‟ at a word level, „Fluency‟ and „Volume‟ at a passage level and
„Sense Reading‟ at a sentence level were the key factors for the classification of
personality groups as shown in Table 6. The first eigenvalue was 113.716, which meant
that it explained 92.4% of the variation in the data.
As shown in Table 7, all the key factors for the classification of personality
groups mentioned above were the important factors for Group 2(Cluster 2 in Table 7).
The important factor for Group 4 (Cluster 4 in Table 7) was „Sentence Stress.‟
In Control Group, there was no significant development between the scores of pre
and post performance tests. The authors compared the scores of the Experimental Group
with those of the Control Group as for 24 categories at the pre oral reading performance
tests. The result showed that there were differences between the two groups in seven
categories at the significance level of 0.1%, in three categories at the significance level of
1% and in eight categories at the significance level of 5%. There was a tendency of
difference in two categories at the significance level of 10%.
236
Fujishiro, N., & Miyaji, I.
Table 6. The Standardized Canonical Discriminant Function Coefficients
Criteria
Attitude
Stress
Fluency
Volume
Sense Reading
Sentence Stress
Attitude
Stress
Pronunciation
Liaison
Message
Intonation
Stress
Sentence Stress
Fluency
Liaison
Pronunciation
Sense Reading
Volume
Intonation
Volume
Attitude
Pronunciation
Level
Word
Passage
Sentence
Passage
Sentence
Passage
Sentence
Passage
Sentence
Passage
Sentence
Word
Passage
Word
1
19.187
15.369
6.816
6.697
5.493
3.979
3.903
3.280
2.627
2.585
2.553
2.347
0.419
-0.084
-1.718
-2.338
-3.276
-4.248
-5.249
-7.622
-10.769
-12.231
-19.250
Function
2
2.575
5.179
2.736
-5.519
0.069
-9.533
-5.152
-0.509
-0.685
0.831
2.333
-2.542
-2.484
0.503
1.415
-1.755
-2.061
-0.637
1.595
13.896
2.000
7.611
-8.487
3
-0.938
1.747
-1.789
-0.028
-0.836
-1.005
0.125
0.004
-0.609
0.769
0.780
0.731
-0.065
-1.315
-0.242
-0.400
1.319
0.652
-0.560
1.856
0.695
1.168
-0.466
Table 7. The Classification Function Coefficients by Fisher’s linear Discriminant Functions
Criteria
Level
Pronunciation
Stress
Word
Attitude
Volume
Pronunciation
Stress
Sentence Stress
Intonation
Fluency
Sentence
Liaison
Sense Reading
Attitude
Volume
Pronunciation
Stress
Sentence Stress
Intonation
Fluency
Passage
Liaison
Sense Reading
Message
Attitude
Volume
Constant
1
412.949
-293.061
-321.771
171.234
-55.140
6.506
21.063
8.912
21.813
81.472
-89.502
-53.071
114.450
82.646
-53.063
-0.125
-21.722
-111.382
-53.630
53.301
-47.725
169.121
-71.853
-93.313
cluster
2
3
-322.879 113.252
248.699
-74.817
338.989
-93.579
-223.673
56.661
80.452
-20.932
21.090
-1.859
162.763
8.463
-256.961
8.771
-45.019
7.240
-25.157
30.248
87.478
-34.698
138.003
-29.565
-130.863
41.731
-58.547
29.540
69.231
-15.760
-6.442
-6.348
64.730
-4.186
98.520
-36.166
44.853
-11.635
-67.798
13.050
33.370
-5.025
-301.668
68.250
130.519
-32.214
-110.769
-22.790
4
-209.824
152.072
201.279
-117.729
43.245
2.994
68.843
-107.608
-18.602
-14.241
47.425
46.153
-57.663
-45.538
36.742
0.988
25.977
68.031
26.043
-43.585
26.973
-137.598
51.692
-40.777
Knowledge Management & E-Learning: An International Journal, Vol.2, No.3.
237
4.2.3. Comparative Examination on the Effects of Experiment on the Oral
Reading Skill
In Experiment 1, the most categories of oral reading performance were improved
significantly. However, as there were significant differences between the Experimental
Group and the Control Group in the most categories at the pre oral reading performance
tests, the authors examined the effects of blended instruction on the oral reading skill in
Experiment 2 after setting the Control Group which was almost equal to the Experimental
Group in the oral reading skill.
The authors compared the scores of the pre and post oral reading performance
tests in Experiment 2. As shown in Table 8, the result of the t-tests shows that all the
categories of the oral reading performance were improved at the significance level of
0.1% in the Experimental Group. On the other hand, only the category of „Pronunciation‟
at a word level was improved at the significance level of 5% and there was a tendency of
development in „Total impression‟ in the Control Group.
The authors also compared the scores of the Experimental Group with those of the
Control Group as for 25 categories at the pre oral reading performance tests. The result
showed that there was no difference between the two groups in 22 categories out of 25
except the categories of „Volume‟ at word, sentence and passage level which had
differences at the significance level of 5% to 1%.
After the degree of development in each category of oral reading criteria in Table
8 was calculated through subtracting the pre-score from the post-score, factor analysis
was conducted for all the 25 categories using unweighted least squares method and
varimax rotation in order to clarify the factors which contributed to the development.
Four factors were extracted as shown in Table 9. The contribution ratio was 72.4% in
total.
Table 8. The Improvement of the Oral Reading Performance in the Experimental Group
and the Control Group
Experimantal
Control
(n=81)
Criteria
Stress
Intonation
Stress
Fluency
Message
Total Impression
Pronunciation
Intonation
Liaison
Stress
Sense Reading
Pronunciation
Sentence Stress
Volume
Fluency
Sense Reading
Pronunciation
Attitude
Volume
Attitude
Liaison
Attitude
Level
Word
Word
Passage
Passage
Passage
Total
Word
Sentence
Passage
Passage
Sentence
Passage
Sentence
Passage
Sentence
Passage
Sentence
Sentence
Passage
Passage
Word
Sentence
Word
Sentence
Sentence
Pre-test
Post-test
(n=59)
t-Test
Pre-test
Post-test
t-Test
mean
SD
mean
SD
Value
of t
Sig.
level
mean
SD
mean
SD
Value
of t
2.9
2.9
2.4
2.6
2.4
2.7
3.1
2.8
2.6
2.6
2.6
2.5
2.7
2.4
2.6
2.9
2.8
2.7
2.5
2.9
3.2
3.0
3.3
2.9
3.1
1.0
1.0
1.0
1.1
1.0
1.1
1.1
1.1
1.1
1.1
1.0
1.0
0.9
1.0
1.0
1.2
1.1
1.0
0.9
1.2
1.1
1.1
1.0
1.1
1.1
3.7
3.7
3.0
3.1
3.0
3.2
3.8
3.3
3.1
3.1
3.2
3.0
3.2
2.9
3.2
3.4
3.4
3.2
3.0
3.3
3.8
3.5
3.8
3.2
3.4
1.0
1.0
1.2
1.3
1.2
1.3
1.0
1.3
1.3
1.3
1.2
1.2
1.2
1.1
1.2
1.3
1.3
1.2
1.2
1.3
1.0
1.3
1.0
1.2
1.3
9.0
8.7
8.3
8.1
7.7
7.5
7.3
7.2
7.2
7.2
6.9
6.9
6.8
6.8
6.7
6.7
6.6
6.0
5.8
5.7
5.6
5.4
5.2
4.7
4.1
***
***
***
***
***
***
***
***
***
***
***
***
***
***
***
***
***
***
***
***
***
***
***
***
***
3.1
3.1
2.6
2.7
2.7
2.8
3.2
3.0
2.6
2.7
2.9
2.7
2.9
2.6
2.9
3.3
3.1
2.9
2.6
3.1
3.6
3.5
3.3
3.0
3.2
1.0
1.0
0.9
1.1
1.0
1.0
1.1
0.9
1.0
1.1
0.9
1.0
0.9
1.0
0.9
1.2
1.0
0.9
0.9
1.0
1.1
1.1
1.0
1.0
0.9
3.2
3.2
2.6
2.9
2.7
3.0
3.4
2.9
2.7
2.7
2.8
2.6
3.0
2.6
2.8
3.2
3.0
2.8
2.7
3.2
3.5
3.3
3.4
2.9
3.2
1.0
1.0
0.9
1.1
1.0
1.0
1.0
1.0
1.0
1.1
0.9
0.9
1.0
0.9
0.9
1.0
1.1
0.9
0.9
1.0
1.0
0.9
1.0
1.0
0.9
0.7
1.3
0.7
1.5
0.0
1.8
2.1
0.4
1.2
0.5
1.0
0.4
0.2
0.0
1.0
0.5
0.5
1.1
0.5
1.1
1.5
1.6
1.1
1.0
0.2
Sig.
level
+
*
***:p<.001, *:p<.05, +:p<.1
238
Fujishiro, N., & Miyaji, I.
Table 9. The Factor Loading of the Oral Reading Criteria after Varimax Rotation
(Experiment 2)
Criteria
Stress
Intonation
Liaison
Sense Reading
Message
Sentence Stress
Fluency
Pronunciation
Stress
Sentence Stress
Sense Reading
Pronunciation
Intonation
Liaison
Fluency
Stress
Intonation
Attitude
Pronunciation
Volume
Level
Passage
Sentence
Word
Sentence
Passage
Sentence
Attitude
Passage
Total Impression
Total
Contribution ratio (%)
Volume
1
0.841
0.794
0.782
0.768
0.757
0.756
0.687
0.371
0.400
0.383
0.348
0.265
0.387
0.323
0.383
0.144
0.134
0.114
0.102
0.083
0.135
0.139
0.186
0.364
0.431
22.6
Factor
2
0.301
0.118
0.160
0.367
0.210
0.193
0.226
0.355
0.786
0.745
0.719
0.621
0.612
0.605
0.585
0.228
0.263
0.102
0.279
-0.073
0.312
0.188
0.400
0.250
0.372
17.6
3
0.152
0.158
0.088
0.076
0.145
0.055
0.071
0.063
0.285
0.293
0.298
0.107
0.221
0.139
0.196
0.909
0.883
0.834
0.823
0.751
0.221
0.143
0.265
0.127
0.218
16.9
4
0.083
0.244
0.208
0.096
0.120
0.109
0.280
0.286
0.268
0.245
0.286
0.498
0.453
0.446
0.461
0.074
0.059
0.184
0.138
0.395
0.827
0.755
0.639
0.568
0.518
15.4
Factor 1 was interpreted as “Pronunciation of Passage” because it related to the
categories of „Passage level.‟ In the same way, Factor 2 was interpreted as
“Pronunciation of Sentence”. Factor 3 was interpreted as “Pronunciation of Word”.
Factor 4 was interpreted as “Attitude and Volume”.
4.2.4. The Development of the Oral Reading Skill in each Personality Group
and the Related Factors
In terms of educational effects on each personality group, the authors compared the
scores of pre and post oral reading performance tests in each personality group of the
Experimental Group. As shown in Table 10, the result of the t-test shows that the oral
reading skill of the Group 4 (Cl 4 in Table 10) developed significantly in all the
categories. The group whose oral reading skill developed significantly in the second most
categories of all the groups is the Group 2 (Cl 2 in Table 10).
In order to figure out differences among the personality groups on the
development of oral reading skill, One-way Factorial ANOVA was conducted after the
degree of development in each category of oral reading criteria was calculated through
subtracting the pre-score from the post-score for each personality group in the same way
as Experiment 1. The result showed that there was significant differences among
personality groups (F(3, 96)=14.8, p<.001 ).
As post-hoc tests, Bonferroni multiple comparisons of means were conducted. As
shown in Table 11, there were significant differences between Group 1 (Cluster 1 in
Table 11) and Group 2 (Cluster 2 in Table 11) at significance level of 0.1% and between
Group 1 and Group 4 (Cluster 4 in Table 11) at significance level of 1%. There were also
significant differences between Group 3 (Cluster 3 in Table 11) and Group 2 and between
Group 3 and Group 4 at significance level of 0.1%. There was no significant difference
Knowledge Management & E-Learning: An International Journal, Vol.2, No.3.
239
between Group1 (m=0.4) and Group 3 (m=0.4) and between Group 2 (m=0.6) and Group
4 (m=0.6), where m stands for means.
In order to figure out key factors which contribute to the classification of the
personality group in terms of oral reading skill and important factors among them for
each personality group, the authors conducted the discriminant analysis. The result
showed that „Sense Reading‟ at a sentence level, „Intonation‟ at all the levels and
„Liaison‟ at a sentence level were the key factors for the classification of personality
groups as shown in Table 12. The first eigenvalue was 0.892, which meant that it
explained 54.8% of the variation in the data.
As shown in Table 13, the important factor for Group 4 (Cluster 4 in Table 13)
was „Sense Reading‟ at a sentence level. The one for Group 2 (Cluster 2 in Table 13) was
„Intonation‟ at all the levels. The one for Group 1 (Cluster 1 in Table 13) was „Liaison‟ at
the sentence level.
Table 10. The Improvement of the Oral Reading Performance in each Personality Group
Criteria
Experoimantal
Cl 1
Cl 2
Cl 3
Cl 4
(n=81)
(n=21)
(n=18)
(n=16)
(n=23)
Level
Value
of t
Stress
Intonation
Stress
Fluency
Message
Total Impression
Pronunciation
Word
Word
Passage
Passage
Passage
Total
Word
Sentence
Passage
Passage
Sentence
Passage
Sentence
Passage
Sentence
Passage
Sentence
Sentence
Passage
Passage
Word
Sentence
Word
Sentence
Sentence
Intonation
Liaison
Stress
Sense Reading
Pronunciation
Sentence Stress
Volume
Fluency
Sense Reading
Pronunciation
Attitude
Volume
Attitude
Liaison
Attitude
9.0
8.7
8.3
8.1
7.7
7.5
7.3
7.2
7.2
7.2
6.9
6.9
6.8
6.8
6.7
6.7
6.6
6.0
5.8
5.7
5.6
5.4
5.2
4.7
4.1
Sig.
level
***
***
***
***
***
***
***
***
***
***
***
***
***
***
***
***
***
***
***
***
***
***
***
***
***
Value Sig. Value Sig. Value Sig. Value Sig.
of t level of t level of t level of t level
4.2
3.9
4.0
3.2
3.2
3.2
2.6
2.9
3.2
3.3
3.0
3.3
2.8
2.0
2.8
2.3
2.4
2.4
2.9
3.9
1.8
1.5
2.0
2.1
1.5
***
***
***
**
**
**
*
**
**
**
**
**
*
+
*
*
*
*
**
***
+
+
*
5.1
5.0
6.0
3.7
5.3
5.2
4.2
5.0
4.8
3.1
5.7
4.1
9.2
4.8
5.0
6.6
5.2
5.3
4.6
3.8
1.8
5.3
3.1
2.9
4.1
***
***
***
**
***
***
***
***
***
**
***
***
***
***
***
***
***
***
***
***
+
***
**
**
***
3.5
3.4
3.4
3.9
2.8
1.6
2.4
1.8
2.1
3.2
1.0
2.1
1.2
3.0
1.0
1.5
1.8
0.0
1.3
0.3
2.7
1.2
1.5
0.3
0.0
**
**
**
***
*
*
+
+
**
+
**
+
*
4.9
4.5
3.4
4.8
3.8
5.5
5.1
4.4
4.0
4.0
4.0
4.2
4.5
3.4
4.4
5.3
4.4
4.2
3.1
3.9
4.4
4.0
3.4
3.7
3.8
***
***
**
***
***
***
***
***
***
***
***
***
***
**
***
***
***
***
**
***
***
***
**
***
***
***:p<.001, **:p<.01, *:p<.05, +:p<.1
Table 11. The Bonferroni Multiple Comparisons of Means
(I)Cluster
(J)Cluster
1
2
3
4
1
3
4
1
2
4
1
2
3
2
3
4
Mean
Difference Std. Error
(I-J)
-.218
.048
.050
.048
-.175
.048
.218
.048
.267
.048
.042
.048
-.050
.048
-.267
.048
-.225
.048
.175
.048
-.042
.048
.225
.048
Sig.
.000
1.000
.003
.000
.000
1.000
1.000
.000
.000
.003
1.000
.000
***
**
***
***
***
***
**
***
240
Fujishiro, N., & Miyaji, I.
Table 12. The Standardized Canonical Discriminant Function Coefficients
Criteria
Sense Reading
Intonation
Liaison
Intonation
Attitude
Total Impression
Sense Reading
Stress
Volume
Sentence Stress
Pronunciation
Liaison
Sentence Stress
Pronunciation
Message
Fluency
Volume
Fluency
Stress
Level
Sentence
Word
Passage
Passage
Sentence
Word
Total
Passage
Passage
Passage
Sentence
Sentence
Word
Passage
Passage
Passage
Passage
Passage
Sentence
Word
Sentence
Word
Sentence
1
1.267
1.249
0.977
0.896
0.739
0.418
0.381
0.284
0.226
0.190
0.083
0.080
0.060
-0.033
-0.259
-0.287
-0.311
-0.342
-0.352
-0.451
-0.508
-0.677
-0.758
-0.791
-1.907
Function
2
0.315
0.203
-0.924
0.933
-0.180
0.209
-0.434
0.308
0.751
-0.630
-0.945
-0.322
0.101
0.337
-0.225
-0.421
0.724
-0.132
0.719
1.025
0.459
-0.394
-0.749
-0.603
0.213
3
1.143
-0.117
-0.441
0.068
0.129
-0.016
0.393
-0.804
0.581
-0.189
0.026
-0.524
-2.110
-0.144
0.149
-0.061
0.068
-0.236
-0.536
0.347
-0.289
1.210
-0.159
-0.434
1.973
Table 13. The Classification Function Coefficients by Fisher’s linear Discriminant Functions
Criteria
Level
Pronunciation
Stress
Word
Intonation
Attitude
Volume
Pronunciation
Stress
Sentence Stress
Intonation
Sentence
Fluency
Liaison
Sense Reading
Attitude
Volume
Pronunciation
Stress
Sentence Stress
Intonation
Fluency
Passage
Liaison
Sense Reading
Message
Attitude
Volume
Total Impression
Total
Constant
1
0.031
1.078
0.254
-0.161
-0.322
0.000
-2.367
0.522
0.960
0.562
0.920
-0.257
0.144
-1.193
-0.211
0.342
0.276
-0.171
-0.660
0.403
1.260
-0.809
1.249
1.012
-0.159
-2.680
Cluster
2
3
-0.699
0.370
-0.772
1.895
2.932
-0.438
0.711
-0.597
-1.552
0.928
0.819
0.631
-3.346
3.772
0.719
-0.111
2.515
-2.098
-1.777
1.224
-0.457
-3.048
1.817
-3.005
-0.563
-1.429
-0.536
0.730
-0.833
0.407
-2.049
-1.570
2.013
2.627
0.009
-2.438
1.794
2.771
-0.947
0.437
-0.352
-0.606
0.648
1.186
2.282
0.334
0.219
0.051
2.197
0.795
-4.835
-4.280
4
0.015
-0.008
1.225
-0.949
0.849
0.188
1.059
-2.564
0.904
-0.415
-0.771
1.880
0.184
-1.045
-0.684
-0.793
1.384
-0.262
1.325
-0.183
0.073
-0.732
1.466
-0.210
1.797
-3.582
Knowledge Management & E-Learning: An International Journal, Vol.2, No.3.
241
4.2.5. The Effects on the Mental Aspect and the Personality Group
The authors compared the results of pre and post surveys using the t-test. The comparison
was made on the survey items in which there was no significant difference between the
Experimental Group and the Control Group at the pre survey. According to the results of
the comparison about the Experimental Group in Experiment 1 as shown in Table 14,
three items (Items 4, 9-1 and 19) which were related to the self-confidence toward
speaking in English were developed at the significance level of 5% to 0.1%. Two items
(Items 9-2 and 12) which were related to the self-confidence toward listening to English
were developed at the significance level of 5%. Two items (Items 16 and 17) which were
related to the collaborative learning and an item (Item 11) which was related to the selfpaced learning with WBT courseware were also developed at the significance level of 5%.
On the other hand, only one item (Item 9-4) which was related to self-confidence toward
reading in English was developed at the significant tendency in the Control Group.
According to the results of the comparison in the Experimental Group in
Experiment 2 as shown in Table 15, an item (Item 11-1) which was related to the selfconfidence toward speaking in English was developed at the significance level of 1%. An
item (Item 11-2) which was related to the self-confidence toward listening to English was
also developed at the significance level of 1%. Two items (Items 17 and 18) which were
related to the collaborative learning and an item (Item 13) which was related to the selfpaced learning with WBT courseware were also developed at the significance level of
0.1%. On the other hand, only one item (Item 15 in Table 3) which was related to the
reluctance toward speaking in English was improved at the significant tendency in the
Control Group.
In terms of effects on the mental aspect of each personality group, the authors
compared the scores of pre and post surveys in each personality group of the
Experimental Group using the Wilcoxon signed-rank test in Experiment 1 and the t-test
in Experiment 2. As shown in Table 14 and Table15, the significant developments were
mainly shown in the survey items of Group 2 (Cl 2 in Tables 14 and 15) and Group 4 (Cl
4 in Tables 14 and 15).
Table 14. The Development of the Mental Aspect in Experiment 1 (Experimental Group)
Pre-test
Survey Items
Post-test
t-Test
n
mean
SD
mean
SD
Value
of t
Sig.
level
***
*
*
**
+
Value Sig. Value Sig. Value Sig. Value Sig.
of Z level of Z level of Z level of Z level
29
29
3.7
0.9
4.2
0.8
2.1 *
0.7
2.4 *
0.0
0.3
12. Being able to comprehend English conversations
through listening to them in usual English lessons
9-3. Self-confidence toward Writing in English
29
4.0
2.0
2.6
3.1
1.8
Cl 4
(n=10)
11. Feeling able to learn at one's own pace in English
lessons using computers
29
29
0.7
0.9
0.8
0.8
0.6
Cl 3
(n=4)
9-4. Self-confidence toward Reading in English
29
9-1. Self-confidence toward Speaking in English
9-2. Self-confidence toward Listening in English
3.2
3.2
3.7
3.9
4.1
Cl 2
(n=9)
2.7
3.0
3.3
3.4
3.9
4. Being able to talk with foreigners in English
0.9
1.0
1.0
0.9
0.9
Cl 1
(n=6)
1.9 +
1.0
1.0
1.3
1.0
1.6
1.7 +
0.8
1.9 +
2.0 *
1.0
0.0
0.6
1.0
0.0
2.0 *
1.1
1.9 *
1.4
1.3
29
3.8
0.8
4.1
0.5
2.3 *
0.4
0.6
1.0
2.1 *
16. Being fond of practicing acting a dialogue with
29
one's partner
3.3
0.8
3.7
1.0
2.1 *
2.1 *
1.3
1.0
0.4
17. Being eager to instruct each other in pronunciation
29
errors with one's partner
3.3
0.8
3.7
0.8
2.4 *
0.6
2.3 *
1.0
0.3
19. Being eager to communicate with ALT using what
one learned in English lessons
3.1
1.1
3.5
1.0
2.1 *
1.1
1.7 +
1.0
0.4
29
***:p<.001, **:p<.01, *:p<.05, +:p<.1
242
Fujishiro, N., & Miyaji, I.
Table 15. The Development of the Mental Aspect in Experiment 2 (Experimental Group)
Pre-test
Survey Items
Post-test
t-Test
n
mean
SD
mean
SD
Value
of t
Cl 1
Cl 2
Cl 3
Cl 4
(n=21)
(n=18)
(n=16)
(n=23)
Sig.
level
Value Sig. Value Sig. Value Sig. Value Sig.
of t level of t level of t level of t level
**
**
+
*
1.6
2.2
1.3
0.4
71
71
70
70
2.3
2.5
2.5
3.0
1.1
1.0
1.2
1.2
2.5
2.8
2.7
3.2
1.2
1.1
1.2
1.2
2.7
3.1
1.7
2.1
13. Feeling able to learn at one's own pace in English
lessons using computers
70
3.0
1.1
3.5
1.1
3.9 ***
1.5
1.1
17. Being fond of practicing acting a dialogue with
one's partner
70
2.7
1.1
3.1
1.3
3.6 ***
1.7
3.2
**
18. Being eager to instruct each other in pronunciation
errors with one's partner
71
2.7
1.1
3.4
1.2
4.6 ***
3.2
3.3
**
11-1. Self-confidence toward Speaking in English
11-2. Self-confidence toward Listening in English
11-3. Self-confidence toward Writing in English
11-4. Self-confidence toward Reading in English
*
**
0.3
3.0
2.3
2.3
**
*
*
0.9
0.6
0.4
1.4
2.3
0.3
0.6
0.3
*
2.8
*
0.8
2.1
*
1.7
1.2
2.1
+
***:p<.001, **:p<.01, *:p<.05, +:p<.1
4.2.6. Consideration of the Results
The result of this study showed that the oral reading skill was improved through blended
instructions and that of the personality group, „Introverted unintelligent person‟, was
much more improved as well as the personality group, „Sociable hard-worker‟ than other
two personality groups. Though there was no significant difference between the
„Introverted unintelligent person‟ and the „Sociable hard-worker‟ in terms of the
development of oral reading skill, such a development of the „Introverted unintelligent
person‟ is worthy of note, as it is hard to guess such a development of the „Introverted
unintelligent person‟ previously, compared with that of the „Sociable hard-worker.‟
The first factor which contributed to the development of the oral reading skill in
both Experiment 1 and Experiment 2 was “Pronunciation of Passage.” The important
factors for the group, „Introverted unintelligent person,‟ in terms of the oral reading
performance were „Sentence Stress‟ in Experiment 1 and „Sense Reading‟ in Experiment
2. This can mean that the students came to notice the existence of sense groups in a
passage and those semantic ties. It might have been due to each student‟s individual
practice of listening to and completing the dialogue through virtual conversation with the
video clips in the WBT courseware, thinking about the natural flow of conversation and
sense groups of a passage. It can be said that the individual conversation practice with
video clips in the WBT courseware helps develop the oral reading skill of the „Introverted
unintelligent person‟ and is an effective factor in a blended instruction.
Development of students‟ self-confidence on speaking English and motivation
toward collaborative learning might have been caused by face-to-face communication „in
a classroom‟, for example, acting out dialogues in pair work, peer tutoring and
assessment tasks. Development of students‟ self-confidence on listening English and
motivation toward self-paced learning might have been caused by individual practice of
listening to and completing the dialogue through virtual conversation with the video clips
in the WBT courseware.
5. Conclusion
Through blended learning with WBT courseware in a junior high school, the students‟
oral reading skill was improved. Their self-confidence on speaking and listening English
and motivation toward collaborative learning and self-paced learning were developed.
These results are thought to have been brought by multiplier effects of each factor of
blended instruction - the WBT courseware and the types of instruction. In this study, the
authors verified the relationship between the development of the oral reading
Knowledge Management & E-Learning: An International Journal, Vol.2, No.3.
243
performance and the students‟ personality. The result showed that blended instruction is
more effective on the personality group, „Introverted unintelligent person‟, as well as the
personality group, „Sociable hard-worker‟, than other personality groups in terms of the
oral reading performance and the important factors for the group were „Sentence Stress‟
and „Sense Reading‟. This result will help develop the study on the effective blended
instruction. A topic for future study is to conduct a further investigation on the effects of
blended instruction on speaking skill and its relationship to the five-factor model of
personality.
References
1
Allport, G. W., & Odbert, H. S. (1936). Trait-names: A psycho-lexical study.
Psychological Monographs,47 (1. whole No.211).
2
Bonk, C. J. & Graham, C. R. (2006). Handbook of blended learning: Global
Perspectives, Local Designs. San Francisco: Pfeiffer Publishing.
3
Clark, J. M., & Paivio, A. (1991). Dual coding theory and education. Education
Psychology Review, 3(3), 149-210.
4
Davies, P. (1999). Learning through assessment: OLAL (on-line assessment and
learning). 3rd CAA Conference Proceedings, Flexible Learning Initiative, 75-78.
5
Endou, T. (2005). Study on Improvement of Learning Instruction in High School.
Workshop Report on Instruction and Research in Iwate Prefecture. Retrieved from
/>(in
Japanese)
6
Fujishiro, N., & Miyaji, I. (2007a). A Study on the Conversation Practice Blended
with WBT and its Effectiveness in Junior High School. The 10th Conference of
Japan Society for Studies and Educational Practice, 5-6 (in Japanese).
7
Fujishiro, N., Hiramatsu, S., Miyaji, I. (2007b). Effects of Communication Practice
Utilizing the Digital Learning Materials Based on WBT for English Listening in
the Blended Learning Approach. Japan Society for Educational Technology
Journal, 31(Suppl.), 85-88 (in Japanese).
8
Fujishiro, N., & Miyaji, I. (2007c). Effects of the „Blended Learning‟ in Class
Utilizing the WBT Courseware for English Listening. Supporting Learning Flow
through Integrative Technologies (pp.235-238). Amsterdam: IOS Press.
9
Fujishiro, N., & Miyaji, I. (2008). Effects on the Oral Reading Performance
through the 'Blended Learning' in English Class Utilizing the WBT Courseware.
The 16th International Conference on Computers in Education, Proceedings, 1,
427-431.
10
Fujishiro, N., & Miyaji, I. (2009a). Effectiveness of Blended Instruction in Class on
the Skills of Oral Reading and Speaking in English. Educational Technology
Research, 32, 79-90.
11
Fujishiro, N., & Miyaji, I. (2009b). The Effects of Blended Instruction Utilizing
WBT Courseware and their Relationships to the Five-Factor Model of Personality.
Proceedings of the 17th International Conference on Computers in Education, 472476.
244
Fujishiro, N., & Miyaji, I.
12
Gagne, R. M., Wager, W. W., Golas, K. C. & Keller, J. M. (2005). Principles of
Instructional Design. Wadsworth: A division of Thomson Learning.
13
Goldberg, L. R. (1992). The Development of Markers for the Big-Five Factor
Structure. Psychological Assessment,4(1), 26-42.
14
Goodlad, S., & Hirst, B. (1985). Peer tutoring: A guide to learning by teaching.
London: Kogan Page.
15
Koike, I. (Ed.). (1994). New Trend of English Education Based on Studies on
Second Language Acquisition. Tokyo: Taishukan. (in Japanese).
16
McAdams, D. P. (1992). The Five-Factor Model in Personality: A Critical
Appraisal. Journal of Personality, 60(2), 329-361.
17
McGurk, H., & Macdonald, J. (1976). Hearing lips and seeing voices. Nature, 264,
746-748.
18
Miyaji, I., You, K. & Yoshida, K. (2005). The Effect through Instruction Blending
e-Learning and Lecture. Japanese Society for Information and Systems in
Education Journal, 22(4), 254-262 (in Japanese).
19
Mochizuki, H. (2004). Application of Shadowing to TEFL in Japan: The Case of
Junior High School Students. A MA Thesis Presented to the Graduate School of
Language, Communication and Culture, Kwansei Gakuin University (in Japanese).
20
Murakami, Y., & Murakami, C. (2001). Handbook for BigFive. Tokyo: GakugeiTosho (in Japanese).
21
Nunomura, K., & Murakami, Y. (1996). Effects of English Instruction and
Personality Dimensions on Learning. Bulletin of Center for Education and
Practice, Toyama University, 14, 41-45 (in Japanese).
22
Paulston, C. B. (1992). The sequencing of structural pattern drills, in Croft, K. (ed.),
Linguistic and Communicative Competence. Clevedon: Multilingual Matters.
23
Pica, T., & Doughty, C. (1985). Input and interaction through communicative
language classroom: a comparison of teacher-fronted and group activities, in Gass,
S.M. and Madden, C.G. (eds.), Input in second language acquisition. Rowley:
Newbury House.
24
Rirers, W. M. (1972). Speaking in Many Tongues. Rowley, MA: Newbury House
Publishers Inc.
25
Scanlon, E. (1997). Learning Science On-line. Studies in Science Education, 30(1),
57-92.
26
Takanashi, Y. (1992, June). Prerequisite for Communication Activities.
Gendaieigokyouiku. Tokyo: Kenkyusha. (in Japanese).
27
Tamai, K. (2005). Study on Effects of Shadowing as Listening Instruction. Tokyo:
Kazama-Syobou (in Japanese).
28
Tupes, E. C., & Christal, R. E. (1961). Recurrent personality factors based on trait
ratings (Tech. Rep. Nos. 61-67). Lackland. TX: U.S. Aeronautical Systems
Division.
Knowledge Management & E-Learning: An International Journal, Vol.2, No.3.
245
29
Van Der Stuyf, R. R. (2002). Scaffoldings as a Teaching Strategy. Retrieved from
Der Stuyf/Van Der Stuyf
Paper.doc.
30
Widdowson, H. G. (1978). Teaching language as communication. Oxford: Oxford
University Press.
31
Wiggins, J. S., & Trapnell, P. D. (1996). The Five-factor Model of Personality:
Theoretical Perspectives. New York: The Guilford Press.
32
Wilson, D., & Smilanich, E. (2005). The other blended learning. San Francisco:
Pfeiffer.