Analysis of learners’ behaviors and learning outcomes in a massive open online course
Bạn đang xem bản rút gọn của tài liệu. Xem và tải ngay bản đầy đủ của tài liệu tại đây (470.91 KB, 19 trang )
Knowledge Management & E-Learning, Vol.6, No.3. Sep 2014
Knowledge Management & E-Learning
ISSN 2073-7904
Analysis of learners’ behaviors and learning outcomes in
a massive open online course
Dong Liang
Jiyou Jia
Xiaomeng Wu
Jingmin Miao
Aihua Wang
Peking University, Beijing, China
Recommended citation:
Liang, D., Jia, J., Wu, X., Miao, J., & Wang, A. (2014). Analysis of
learners’ behaviors and learning outcomes in a massive open online course.
Knowledge Management & E-Learning, 6(3), 281–298.
Knowledge Management & E-Learning, 6(3), 281–298
Analysis of learners’ behaviors and learning outcomes in a
massive open online course
Dong Liang*
Department of Educational Technology
Graduate School of Education
Peking University, Beijing, China
E-mail:
Jiyou Jia
Department of Educational Technology
Graduate School of Education
Peking University, Beijing, China
E-mail:
Xiaomeng Wu
Department of Educational Technology
Graduate School of Education
Peking University, Beijing, China
E-mail:
Jingmin Miao
Department of Educational Technology
Graduate School of Education
Peking University, Beijing, China
E-mail:
Aihua Wang
Department of Educational Technology
Graduate School of Education
Peking University, Beijing, China
E-mail:
*Corresponding author
Abstract: This paper introduces a massive open online course (MOOC) on
educational technology, and studies the factors that may influence learners’
participation and performance in the MOOC. Students’ learning records
captured in the course management system and students’ feedback collected
from a questionnaire survey are explored. Regression analysis is adopted to
examine the correlation among perceived learning experience, learning
activities and learning outcomes; data mining is applied to optimize the
282
D. Liang et al. (2014)
correlation models. The findings suggest that learners’ perceived usefulness
rather than perceived ease of use of the MOOC, positively influences learners’
use of the system, and consequentially, the learning outcome. In addition,
learners’ previous MOOC experience is not found to have a significant impact
on their learning behavior and learning outcome in general. However, the
performance of less active learners is found to be influenced by their prior
MOOC experience.
Keywords: MOOC; Perceived learning experience; Learning behavior;
Learning outcome; Data mining
Biographical notes: Dong Liang is a Master student, who majors in education.
He got his bachelor degree in the school of Electronics Engineering and
Computer Science, Peking University. His research interests now include
educational technology and educational data mining.
Dr. Jiyou Jia is a professor from Department of Educational Technology,
Graduate School of Education, and director of International Research Center
for Education and Information, Peking University, China. His research interests
include educational technology and artificial intelligence in education.
Xiaomeng Wu, Ph.D, associate professor of Department of Educational
Technology, Graduate School of Education, Peking University. Research
interests include ICT in education, online education, and teacher education.
Publications include monograph “Understanding Teachers in Educational
Change” and journal papers.
Jingmin Miao is a Master student in the Department of Educational Technology
in the Graduate School of Education at Peking University, where she studies
learning science, instructional design in interactive learning environment and
human-computer interaction (HCI). Her research interests are new learning
technologies and models used to support learning and teaching, and does
research on online learning and learning analytics.
Aihua Wang, Associate Professor, Department of Educational Technology,
Graduate School of Education, Peking University, Beijing, China, 100871. Her
research interests include MOOC, OER and instructional design. She received
her Ph.D degree from Peking University in 2002, majoring in Computer
Software, and her master's degree from Harbin Engineering University in 1998,
majoring in Computer Application.
1. Introduction
The term MOOC (Massive Open Online Course) was firstly brought up by Dave Cormier
of the University of Prince Edward Island in 2008 (Mehaffy, 2012). With its rapid
development, not only educators and students, but also educational researchers and the
media are paying more and more attention to this field (Gillani, 2013). There have been
over 8,600 items containing the word “MOOC” on Google Scholar by far, while more
than 3,000 of them just came out in the year of 2013.
As a report says in New York Times “The shimmery hope (of MOOC) is that free
courses can bring the best education in the world to the most remote corners of the planet,
help people in their careers, and expand intellectual and personal networks” (Pappano,
2012). To realize this hope, we offered an open online course based on the on-site
Knowledge Management & E-Learning, 6(3), 281–298
283
summer school “New Media and Learning”, which was hosted in Peking University from
July 15th 2013 to July 26th 2013. The online course was run on the website
, which was built based on the popular open-source CMS (Course
Management System) and Moodle (Modular Object-Oriented Dynamic Learning
Environment). During the summer school, 312 participants registered for the online
course, while 132 of them passed all the required quizzes and got a certificate.
The course contained 16 lectures given by 15 experts in this field. Seven of them
were from abroad. Before every class, references and coursewares were uploaded to the
course website. During the lecture, online learners could link to the live video by a click
on the course website and watch it with Windows Media Player. Afterwards, video
records were uploaded as well. Additionally, homework, quizzes and course forum were
provided on the same site. All these are kept accessible as the fundamental resources of
an online course after the summer school. As our previous conference report (Jia et al.,
2013) proves, “there is no statistically significant difference between the quiz scores of
the online learners and that of the on-site learners”.
2. Related research
After a search in Web of Knowledge, we found that most of the available papers in the
field of education about MOOC were on its history (Scardilli, 2013), its profit mechanism
(Dellarocas & Van Alstyne, 2013) and its technical base (Aher & Lobo, 2013; AlarioHoyos et al., 2013). Moreover, most published MOOC application reports presented
descriptive statistics that could only show basic user information, e.g. demographic
materials such as gender ratio and living place, education background such as academic
qualification and MOOC experience, total behavior such as registration time and
certification rate, and reasons for enrolling (MOOCs@Edinburgh Group, 2013; Grainger,
2013; Ho et al., 2014). In a word, there is hardly any previous study focusing on the
determinants of MOOC learners’ behavior and outcome.
As a result, we turned to course management system (CMS) evaluation
methodology to study the CMS-based MOOC. On one hand, survey-based model is
commonly used in CMS studies (Chen, 2010; Islam, 2013). Its advantage includes but not
limits to convenience and abundant theoretical support. The latest research (Islam, 2013)
manifests that “perceived ease of use” and “perceived usefulness” predict the CMS usage
outcome. However, it should be noticed that users’ feedback does not always equal to the
real case. Taking Islam’s survey as an example, does a “Yes” to the question “I use
Moodle frequently in this academic period” means participating large amount of learning
activities? As far as we are concerned, user records are able to eliminate the subjective
bias here, so that the real behavior and outcome, instead of the “perceived academic
performance” could be studied.
On the other hand, data mining technology has been proved effective in CMS
pedagogical research (Baker & Yacef, 2009; Bovo, Sanchez, Heguy, & Duthen, 2013).
Visualization, classification, clustering, association, sequential pattern analysis, as well as
other methods are adopted to discover the deeper links (Romero, Ventura, Pechenizkiy,
& Baker, 2010). Thereinto, classification has been used to discover potential student
groups with similar characteristics and reactions to a particular pedagogical strategy; to
identify learners with low motivation and to find remedial actions to lower drop-out rates;
to predict students when using intelligent tutoring systems, etc (Romero, Espejo, Zafra,
Romero, & Ventura, 2013). Nonetheless, data used in existing CMS mining is confined
284
D. Liang et al. (2014)
to logs and grades (Romero, Ventura, & García, 2008), which fails to consider the
influence of learners’ background and perceived learning experience.
This study aims to apply both of these approaches to explore the relationship
among learners’ perceived learning experience, learning behaviors, and learning
outcomes with MOOC.
3. Data collection
3.1. Moodle data
Despite the rich data store, course management systems provide a limited set of reporting
features and do not support data mining techniques (Psaromiligkos, Orfanidou, Kytagias,
& Zafiri, 2011). Therefore, activity completion reports and grades of all online users were
downloaded from Moodle into Excel-compatible format (.csv) file for further processing.
Instead of detailed logs used in previous research (Romero, Ventura, & García, 2008;
Zafra, Romero, & Ventura, 2010), the activity completion report were used in this study
to calculate activity participated. The aim was to eliminate the possibility of double
counting repeated operations in one single content, or over counting the number of online
interactions such as question discussing. Forum related operations in the detailed log
could sum up to a much larger amount of activities than that of opening videos and
downloading materials, but within the instructional design of this open online course,
videos were regarded at least as important as the online interaction. What is more, the
quality of the posts in the interactions differed a lot from each other. Thus, viewing and
taking part in the discussion of a single question for several times were only measured as
taking participation in the course once. In a word, the measurement of participation is
based on learning activity, instead of operations.
The total activity participated of every learner was then counted in Excel, which
included online group meeting, question discussing, reference reading, wiki editing, quiz
taking, homework uploading, courseware downloading, and videos watching. Daily signin was not taken into account because its data was consistent with that of the live video
watching. The record of final courseware collection download was not adopted either,
considering that learners could use the everyday saved PDF to review. As a result, a sum
of 115 activities in the 12 days was taken into measurement.
Regarding the grades, the average score of quizzes and homework was deemed as
a valid reflection of the learning outcome for the following reasons:
(1)
The lectures were given by 15 experts in this field on their latest research
findings, which could be considered almost equally new to every participant.
Thus no pre-test was needed.
(2)
Quizzes and homework were designed by the lecturers themselves to investigate
whether the key points had been mastered.
(3)
There was no time limitation in these quizzes and homework while related
materials were always accessible. Moreover, both open-end subjective and
conceptual objective items were chosen to ensure that learners could respond
freely with little pressure.
Knowledge Management & E-Learning, 6(3), 281–298
285
3.2. Questionnaire survey
An online questionnaire (See Appendix I) was posted on the homepage of the CMS at the
end of the course. The main purpose of the survey was to collect the background and
perceived learning experience of the participants, which could be used as a complement
of the Moodle data in our analysis.
The questionnaire contained two parts: the demographic part and the learning
experience part. Questions on gender (q6), age (q7) and educational background (q1 - q5)
were involved in the demographic part, which also included MOOCs experience (q8, q9),
and learning place information (q10). The second part was primarily about individual
experience during the online course. As Technology Acceptance Model (TAM) (Davis,
1989) and its derivations had been widely used to investigate both e-learning adoption
and continuance behavior (Al-alak & Alnawas, 2011; Juhary, 2014), TAM was taken as
the theoretical framework of this part.
Nasser, Cherif, and Romanowski’s (2011) questionnaire based on TAM was then
adopted. Questions like “I do not have computing facilities” were replaced by more
MOOC-related ones. Finally, feelings on user interface (q11), system stability (q12),
operative difficulty (q13) technical and other support (q14), satisfaction of individual
needs (q15) as well as internationalization (q16) were asked. Other questions in part II
concerned whether references uploaded before class helped content preview (q17),
whether daily sign-in encouraged attendance (q18), whether quizzes and homework led to
better mastering key points (q19), whether peer evaluation increased efficiency (q20) and
whether the awards promoted hardworking (q21). At last, there was an item on the
overall satisfaction of the course (q22). A 5-point Likert scale was designed to measure
the learners’ respondent to these questions, as it was widely used in investigating the
subjective assessment of MOOCs (Cross, Bayyapunedi, Ravindran, Cutrell, & Thies,
2014; Romero & Usart, 2013; Rizzardini, Gütl, Chang, & Morales, 2014).
Table 1
Sampling of learners (Chi-Square Tests)
Pearson Chi-Square
Continuity Correction
Likelihood Ratio
Value
df
Asymp. Sig. (2-sided)
a
1
.213
1.078
1
.299
1.492
1
.222
1.553
b
Fisher's Exact Test
Linear-by-Linear
1.544
1
2-sided Exact
1-sided Exact
.219
.150
.214
Association
N of Valid Cases
176
a: 0 cells (.0%) have expected count less than 5. The minimum expected count is 10.00.
b: Computed only for a 2x2 table
“Perceived ease of use” and “perceived usefulness” had been found to be
determinants of e-learning system usage in the TAM based studies. We supposed the
answers to q11 - q16 and q16 - q21 could separately reflect users’ “perceived ease of use”
and “perceived usefulness” of the system. In addition to the Likert style ones, participants
were invited to answer an open ended question on their comments and suggestions to the
286
D. Liang et al. (2014)
entire open online course (q23). This questionnaire was reviewed and amended by two
experts in the Graduate School of Education in Peking University before posted online.
On the final day of the summer school, every learner was encouraged to
participate in the survey. Ultimately, a total of 136 questionnaires were filled out by the
online group. 105 of the respondents met the requirement to get the certificate, while the
overall certification rate was 132 / 176 (75%). Registrants that did not watch any videos
at all were not taken into calculation here. Person Chi-square tests indicate that the
sampling bias is acceptable, as shown in Table 1. After responses were exported to Excel,
the processed activity completion report and grades were integrated into the same file.
4. Data analysis and discussion
4.1. User information
Within the 136 MOOC learners who participated in the survey, 119 (87.5%) are female.
This proportion is best explained by the gender distribution in the field of ET
(educational technology) in China since 115 (84.6%) of the respondents major in ET. 110
(80.9%) reported themselves as graduate school student. The most typical learner is a
female ET master candidate who is 27 or younger.
During the course, 40.4% learners studied at home, while another 53.7% took the
online course at school. The remaining 5.9% turned to internet bar or other places. 91.9%
once watched open online educational resources (e.g. MIT OCW and Netease open class)
and 37% had MOOC experience before.
4.2. Reliability of the questionnaire
The scale reliability of the remaining questions is examined with Statistical Product and
Service Solutions (SPSS) 17.0. Table 2 presents the naming of variables for each
question.
Table 2
Basic item statistics
Variable
q11: User_friendly
q12: System_stability
q13: Low_operative_difficulty
q14: Tech_and_other_support
q15: individual_needs
q16: internationalization
q17: ref_to_prepare
q18: signin_to_attendence
q19: quiz_to_master
q20: peer_eval_to_effi
q21: award2hardworking
Mean
3.75
3.38
3.67
3.72
3.58
4.39
4.19
4.21
4.08
4.04
3.98
Std. Deviation
.901
.934
.927
.892
.978
.732
.821
1.019
.967
.890
1.036
N
136
136
136
136
136
136
136
136
136
136
136
Knowledge Management & E-Learning, 6(3), 281–298
287
The reliability analysis result is shown in Table 3. The Cronbach’s Alpha, 0.89,
elucidates that the entire scale used is of acceptable reliability. Little difference in the 4th
column of Table 3 indicates that there is no need to adjust questions for reliability
problem.
Table 3
Cronbach’s alpha of items
Corrected ItemTotal Correlation
Squared Multiple
Correlation
Cronbach's Alpha
if Item Deleted
User_friendly
.627
.562
.880
System_stability
.529
.557
.886
Low_operative_difficulty
.652
.572
.878
Tech_and_other_support
.646
.478
.878
individual_needs
.680
.530
.876
internationalization
.654
.569
.879
Ref_to_prepare
.586
.528
.882
Signin_to_attendence
.456
.330
.891
Quiz_to_master
.583
.487
.882
peer_eval_to_effi
.645
.562
.879
Variable
4.3. Analysis of perceived learning experience
KMO (.877) and Bartlett's Test (p = 0.000) in Table 4 demonstrate that the correlation
between the items is strong enough to conduct a factor analysis. With principal
component analysis in extraction and varimax in rotation chosen, the final result comes
out as shown in Table 5. As designed, the two components extracted can be defined as
perceived ease of use and perceived usefulness. Table 5 illustrates that the ratios of
different factors are proper, which guarantees the content validity of the questionnaire.
Table 4
KMO and Bartlett's test
Kaiser-Meyer-Olkin Measure of Sampling Adequacy.
Bartlett's Test of Sphericity
.877
Approx. Chi-Square
731.667
Df
55
Sig.
.000
These two factors extracted from the post-study feedback are adopted as
independent variables in the linear regression. Activity participated which reflects system
use, is put into dependent variable blank. Table 6 reveals that, the coefficients of the
“perceived usefulness” is positive and the result is statistically significant (p = 0.014, <
0.05), which agrees with the mentioned TAM based studies. However, “perceived ease of
288
D. Liang et al. (2014)
use” does not play a significant role in the adoption of this system as far as the Likert
style questions are considered.
Table 5
Factor analysis result (Rotated Component Matrix - Rotation converged in 3 iterations)
Variable
Component
1
.223
.034
.244
.428
.440
.695
.726
.639
.792
.736
.722
User_friendly
System_stability
Low_operative_difficulty
Tech_y_other_support
individual_needs
Internationalization
ref2prepare
signin2attendence
quiz2master
peer_eval2effi
award2hardworking
2
.805
.882
.810
.592
.640
.322
.203
.089
.109
.264
.373
Table 6
Regression Result (Coefficients - Dependent variable: activity participated)
Unstandardized Coefficients
B
Std. Error
(Constant)
91.978
1.897
Usefulness
4.731
1.904
Ease of use
-.548
1.904
Model
Standardized
Coefficients
t
Sig.
48.486
.000
.211
2.485
.014
-.024
-.288
.774
Beta
When we look into the comments and suggestions in q23, it is noticed that severe
usability problems did influence the use of the system. Here are several exemplars from
respondents whose activities participated are below the average (91.1).
(1)
The live video suspend from time to time because of the slow Internet, which
contributes to poor effect of the class. System crashes generated negative
emotions and led to my absence of some activities. Hope these could be solved
next time.
(2)
The temporal plan of activities lacks rationality. Feelings of the online learners
are not fully considered. The video quality is low and voice is not distinct. All
these could have brought about dropping. To sum up, there is a big difference
between online and face-to-face learning.
(3)
Often, the busy network and system crashes influence my learning results.
Knowledge Management & E-Learning, 6(3), 281–298
289
Indeed, since the survey did not cover learners who dropped the course halfway, it
is possible that low perceived ease of use is responsible for their cease of usage. However,
it can be implied from the statistical analysis that as long as the usability is acceptable,
there is no causal relationship between the different perceived ease of use and the
disparity of learner’s participation.
4.4. Analysis of learning outcome
Effects on the two elements of the grades, regular ones and the final essay score, are
examined separately. Table 7 provides the output of quiz and homework score regression,
which indicates that participating online activities in open online course has a positive
correlation with learning outcome.
Table 7
Regressing quiz and homework score on participation and Mooc experience (Coefficients)
Model
(Constant)
Participation
MOOCed
Unstandardized
B
Std. Error
t
Sig.
Collinearity
Tolerance
VIF
28.085
5.377
5.223
.000
.630
.053
11.917
.000
.974
1.027
-2.042
2.620
-.779
.437
.995
1.005
Chen’s (2010) model predicted that participation was a mediator of the
relationship between perceived usefulness and learning outcome. To test the mediating
relationship, Baron and Kenny’s (1986) approach is used, which compares the effects of
mediator under test on the outcome variable controlling and without controlling the
predictor. The result is depicted in Table 8.
Table 8
Mediating relationships test (Coefficients - Dependent Variable: quiz_score)
Unstandardized
Coefficients
Standardized
Coefficients
B
Std. Error
Beta
t
Sig.
With
Participation
.561
1.194
0.029
.470
.639
Without
Participation
3.416
1.647
.176
2.073
.040
The difference in Beta indicates that participation is a complete mediator of the
relationship. So far, the nexus between perceived learning experience and outcome is
built, i.e., the former influences use of system, and consequentially, the outcome.
While the average score of quizzes and homework is believed to reflect the daily
learning outcome, the mechanism behind the performance in final essay writing seems far
more complicated. Information searching level, writing ability and knowledge base all
290
D. Liang et al. (2014)
might play a part in the score. Thus, the low coefficient of “participation” in Table 9 can
be explained.
Table 9
Regression result of essay score (Coefficients)
Coefficients
Model
(Constant)
Participation
MOOCed
Collinearity Statistics
t
Sig.
B
Std. Error
Tolerance
VIF
89.036
2.053
43.367
.000
.010
.020
.477
.635
.976
1.024
.905
.901
1.004
.317
.993
1.007
Furthermore, both Table 7 and Table 8 elucidate that, introduced to the regression
as dummy variables, whether MOOC is taken before has no statistically significant
impact on the behavior and learning outcome of open online course learners as a whole.
4.5. Analysis of learner’s satisfaction
Table 10 demonstrates that perceived usefulness and ease of use both positively influence
learners’ satisfaction. It can be inferred that although perceived ease of use does not
immediately give rise to more active participation in the short-term online open course,
their satisfaction might encourage usage of a similar system in the future, according to
Seddon’s model (Chen, 2010).
Table 10
Essay score (Coefficients)
Model
Unstandardized Coefficients
B
Std. Error
(Constant)
3.801
.054
Usefulness
.502
.054
Ease of use
.495
.054
Standardized Coefficients
t
Sig.
70.502
.000
.533
9.273
.000
-.523
9.142
.000
Beta
5. Further data mining
In order to verify the aforesaid conclusion and to optimize the model, data mining
process is conducted. Since clustering is mostly used in grouping students or tests into
related groups for individualized teaching and pedagogy adjusting (Vellido, Castro, &
Nebot, 2010), its practical value to short-term open online course remains doubtful. That
is because there is hardly any opportunity or obligation for a teacher to instruct the
learners after the open online course. Thus, “classify” and “visualize” in Weka (2013) are
chosen as approaches.
Knowledge Management & E-Learning, 6(3), 281–298
291
Weka is an open-source software platform that provides a collection of machine
learning and data mining algorithms for data pre-processing, classification, clustering,
association rules, and visualization (García, Romero, Ventura, de Castro & Calders,
2010). It supports best known classification algorithms like ID3 and C4.5 (Hämäläinen &
Vinni, 2010). Hence, the data is explored with Weka 3.7.10, the newest version.
5.1. Classification
Two nominal attribute, quiz_pass(0, 1) and essay_pass(0, 1), are created to represent (1)
whether a learner’s average score of quizzes and homework passed 80 and (2) whether
the final essay was submitted. These two conditions were required for the learners to get
the certificate of the summer school. The naming of the other attributes is the same as
that in the basic SPSS analysis.
Table 11
a) Quiz and homework score classifaction
Scheme
Relation
Instances
Attributes (21)
weka.classifiers.trees.J48 -C 0.25 -M 2
noname-weka.filters.unsupervised.attribute.Remove-R2,20,22-26,29-38
136
Participation
User_friendly
System_stability
Low_operative_difficulty Tech_y_other_support
individual_needs
internationality
Low_interuption
ref2prepare
signin2attendence
quiz2master
peer_eval2effi
award2hardworking
Usefulness
Ease_of_Use
Video_watched
MOOCed
Study_place
quiz_pass
Female0_Male1
Age
Test mode
10-fold cross-validation
Number of Leaves
6
Size of the tree
11
Summary
Correctly Classified Instances
110
80.8824%
Incorrectly Classified Instances
26
19.1176%
Kappa statistic
0.3432
Mean absolute error
0.2203
Root mean squared error
0.4318
Relative absolute error
70.4999%
Root relative squared error
109.7284%
Coverage of cases (0.95 level)
83.8235%
Mean rel. region size (0.95 level)
54.7794%
Total Number of Instances
136
292
D. Liang et al. (2014)
b) Detailed accuracy by class
Weighted
Avg.
c)
TP
Rate
FP
Rate
Precision
Recall
FMeasure
MCC
ROC
Area
PRC
Area
Class
.423
.100
.500
.423
.458
.345
.493
.288
0
.900
.890
.868
.900
.884
.345
.493
.775
1
.809
.486
.798
.809
.803
.345
.493
.681
Confusion matrix
Classified as
a
b
a=0
11
15
b=1
11
99
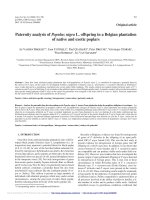
Fig. 1. Decision tree
Knowledge Management & E-Learning, 6(3), 281–298
293
We adopt trees-J48 as the classifier, which is often used in e-learning data mining
(Romero, Ventura, & García, 2008). J48 is realization of the C4.5 algorithm in Weka,
including efficient pruning (Weka, 2013). Quiz_pass is firstly selected as grouping
variables, with default test options and parameters. The outputs are demonstrated in Table.
11 and Fig. 1.
According to Table.11, the reliability of this classification is 80.88%, which is
acceptable. The decision tree in Fig. 1 lends supports to some of the conclusions
mentioned above and provides supplementary information to the model:
(1)
Participating activity positively affects the overall score of quizzes and
homework. Nearly all of the learners who took part in more than 77 activities
got a score over the required 80.
(2)
Although there is no statistically significant relationship between the MOOC
experience and the participation of all the learners as a whole, MOOC
experience might play a role in influencing the performance of less active
students who participated less than 77 activities. The fact that only one of the ten
such students passed can be explained as experienced MOOC learner has clearer
needs and expectations, which could lead to higher halfway dropping rate.
(3)
Perceived usefulness, especially feelings on q20, to which extent peer evaluation
increased efficiency and q19 to which extent quiz promoted mastering, not only
improves the score indirectly by promoting participation, but also has direct
bearing with the overall performance. This is consistent with Islam’s (2013)
conclusion on ordinary online course management system.
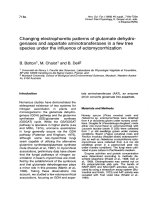
Fig. 2. Homework and quiz score distribution
294
D. Liang et al. (2014)
5.2. Visualization
To illustrate the correlation among the main attributes in Fig. 1, a scatter plot is chosen in
the matrix of “visualize”. As shown in Fig.2, x-axis represents participation, while y-axis
represents quiz_score. Different colors are used to represent perceived usefulness of quiz
at different levels, i.e., blue for 1, brown for 3 and orange for 5. Besides, two auxiliary
lines are added manually, to indicate the threshold value of participation and the cut-off
score.
6. Conclusion and limitation
With analysis of questionnaire feedbacks and Moodle data in a medium open online
course, some of the relationship between perceived learning expereince, learning
behavior, and learning outcome has been found as the following.
Firstly, the perceived usefulness of an open online course positively influences
use of its system, and consequentially, the learner’s outcome. Accordingly, as a practical
implication of this research, we find it essential to attach more importance to the
dissemination of the course, not merely for increasing the registrants. It might
considerably lead to better learning outcome of the users. More specifically, not only
introduction to the teaching form of the MOOC should be provided online as we did last
summer ( but also the usefulness of every lecture ought
to be emphasized during the enrollment and between classes. Besides, since MOOC
experience is becoming more and more common among the learners, it could be helpful
that individual needs are inquired before the course. By adjusting teaching contents and
methods according to the needs, we can keep more learners with MOOC experience
active, so as to improve their overall performance.
Secondly, as long as the usability is acceptable, there is no causal relationship
between the different perceived ease of use and the disparity of learner’s use of the
system during the course. Short-term MOOC disagrees with common long-range elearning at this point. However, the stability of the CMS and the quality of the videos are
suggested to be improved by quite a few users. We hope the dropping rate be lowered
and the satisfaction be increased in the next summer school, which requires enhancing the
robustness of the whole system. Hence, the usability of the system in the large concurrent
processing environment will be one of our top concerns afterwards.
Thirdly, whether MOOC has taken before has no statistically significant impact
on the behavior and outcome of open online course learners. However, MOOC
experience does influence the performance of the learners that have taken part in only
some of the activities.
Admittedly, though we have verified some correlation, the mechanism behind the
effect of perceived usefulness in open online course has not been studied yet.
Furthermore, due to paper limitation, the analysis fails to consider the entire educational
background of learners and other factors, so that the outcomes of MOOC learners cannot
be fully predicted so far.
Our future research will try to discover more learning mechanism of MOOC users
with bigger data and more reliable survey. For example, users’ learning styles will be
taken into consideration in questionnaire design. What is more, we are going to apply text
mining to the analysis of cooperative learning and inquiry learning in the forum of the
online course system, which might reveal the detailed pattern of open online course study.
Knowledge Management & E-Learning, 6(3), 281–298
295
References
Aher, S. B., & Lobo, L. M. R. J. (2013). Combination of machine learning algorithms for
recommendation of courses in e-learning system based on historical data. KnowledgeBased Systems, 51, 1–14.
Al-alak, B. A., & Alnawas, I. A. (2011). Measuring the acceptance and adoption of elearning by academic staff. Knowledge Management & E-Learning (KM&EL), 3(2),
201–221.
Alario-Hoyos, C., Pérez-Sanagustín, M., Delgado-Kloos, C., Parada, H. A., MuñozOrganero, M., & Rodríguez-de-las-Heras, A. (2013). Analysing the impact of built-in
and external social tools in a MOOC on educational technologies. Lecture Notes in
Computer Science, 8095, 5–18.
Baker, R. S., & Yacef, K. (2009). The state of educational data mining in 2009: A review
and future visions. Journal of Educational Data Mining, 1(1), 3–17.
Baron, R. M., & Kenny, D. A. (1986). The moderator–mediator variable distinction in
social psychological research: Conceptual, strategic, and statistical considerations.
Journal of personality and social psychology, 51(6), 1173–1182.
Bovo, A., Sanchez, S., Heguy, O., & Duthen, Y. (2013). Clustering moodle data as a tool
for profiling students. In Proceeding of Second International Conference on eLearning and e-Technologies in Education (ICEEE) (pp. 121–126).
Chen, H. J. (2010). Linking employees’ e-learning system use to their overall job
outcomes: An empirical study based on the IS success model. Computers &
Education, 55(4), 1628–1639.
Cross, A., Bayyapunedi, M., Ravindran, D., Cutrell, E., & Thies, W. (2014). VidWiki:
Enabling the crowd to improve the legibility of online educational videos. In
Proceeding of ACM Conference on Computer Supported Cooperative Work and
Social Computing (CSCW 2014).
Davis, F. D. (1989). Perceived usefulness, perceived ease of use, and user acceptance of
information technology. MIS Quarterly, 13(3), 319–340.
Dellarocas, C., & Van Alstyne, M. (2013). Money models for MOOCs. Communications
of the ACM, 56(8), 25–28.
García, E., Romero, C., Ventura, S., de Castro, C., & Calders, T. (2010). Association rule
mining in learning management systems. In C. Romero, S. Ventura, M. Pechenizkiy,
& R. Baker (Eds.), Handbook of Educational Data Mining (pp. 93–106). Boca Raton,
Fl: CRC Press.
Gillani, N. (2013). Learner communications in massively open online courses
(OxCHEPS
Occasional
Paper
No.
53).
Retrieved
from
/>Grainger, B., (2013). Massive open online course (MOOC) report 2013. Retrieved from
/>Hämäläinen, W., & Vinni, M. (2010). Classifiers for educational data mining. In C.
Romero, S. Ventura, M. Pechenizkiy, & R. Baker (Eds.), Handbook of Educational
Data Mining (pp. 57–74). Boca Raton, Fl: CRC Press.
Ho, A. D., Reich, B. J. F., Nesterko, S. O., Seaton, D. T., Mullaney, T. P., Waldo, J. H.,
& Chuang, I. (2014). HarvardX and MITx: The first year of open online courses
(HarvardX and MITx Working Paper No. 1). Social Science Research Network:
Social Science Electronic Publishing.
Islam, A. K. M. (2013). Investigating e-learning system usage outcomes in the university
context. Computers & Education, 69, 387–399.
Jia, J., Wang, A., Wu, X., Shang, J., Yang, B., Miao, J., & Cai, W. (2013). The design
and practice of a medium open online course. In Proceedings of the 10th Beijing
296
D. Liang et al. (2014)
Forum Educational Panel (pp.141–156).
Juhary, J. (2014). Perceived usefulness and ease of use of the learning management
system as a learning tool. International Education Studies, 7(8), 23–34.
Mehaffy, G. L. (2012). Challenge and change. Educause Review, 47(5), 25–42.
MOOCs@Edinburgh Group. (2013). MOOCs @ Edinburgh 2013: Report #1. Retrieved
from />Nasser, R., Cherif, M., & Romanowski, M. (2011). Factors that impact student usage of
the learning management system in Qatari schools. The International Review of
Research in Open and Distance Learning, 12(6), 39–62.
Pappano, L. (2012, November 2). The year of the MOOC. The New York Times.
Psaromiligkos, Y., Orfanidou, M., Kytagias, C., & Zafiri, E. (2011). Mining log data for
the analysis of learners’ behaviour in web-based learning management systems.
Operational Research, 11(2), 187–200.
Rizzardini, R. H., Gütl, C., Chang, V., & Morales, M. (2014). MOOC in Latin America:
Implementation and lessons learned. In Proceeding of the 2nd International
Workshop on Learning Technology for Education in Cloud (pp. 147–158). Springer.
Romero, C., Espejo, P. G., Zafra, A., Romero, J. R., & Ventura, S. (2013). Web usage
mining for predicting final marks of students that use Moodle courses. Computer
Applications in Engineering Education, 21(1), 135–146.
Romero, C., Ventura, S., & García, E. (2008). Data mining in course management
systems: Moodle case study and tutorial. Computers & Education, 51(1), 368–384.
Romero, C., Ventura, S., Pechenizkiy, M., & Baker, R. S. (Eds.). (2010). Handbook of
educational data mining. Boca Raton, Fl: CRC Press.
Romero, M., & Usart, M. (2013). Serious games integration in an entrepreneurship
massive online open course (MOOC). Lecture Notes in Computer Science, 8101,
212–225.
Scardilli, B. (2013). MOOCs: Classes for the masses. Information Today, 30, 32–35.
Vellido, A., Castro, F., & Nebot, A. (2010). Clustering educational data. In C. Romero, S.
Ventura, M. Pechenizkiy, & R. Baker (Eds.), Handbook of Educational Data Mining
(pp. 75–92). Boca Raton, Fl: CRC Press.
Weka.
(2013).
Weka
manual
3.7.10.
Retrieved
from
/>Zafra, A., Romero, C., & Ventura, S. (2010). Multi-instance learning versus singleinstance learning for predicting the student’s performance. In C. Romero, S. Ventura,
M. Pechenizkiy, & R. Baker (Eds.), Handbook of Educational Data Mining (pp. 187–
200). Boca Raton, Fl: CRC Press.
Knowledge Management & E-Learning, 6(3), 281–298
297
Appendix
The questionnaire of New Media and Learning Summer School Learning
Experience and Outcome Survey (translated)
Part 1: basic information
(1) The location of your school:
(2) Your profession:
a. Undergraduate student b. Master candidate
c.
Doctor candidate d. University teacher
e. Middle school teacher or others
(3) Your major: a. Education technology
b. Computer engineering c.
management
Information
d. Other
(4) Your grade: a. First year
b. Second year
c. Third year
d.
Fourth
year
e. Other
(5) Your research direction:
(6) Your gender: a. Female
b. Male
(7) Your age:
(8) Have you watched open online educational resources (e.g. MIT OCW and Netease
open class)?
a. Yes
b. No
(9) Have you taken part in MOOC? a. Yes
b. NO
(10) Your study place during the summer school:
(11) a. Home
b. School
c. Internet bar
d. Other
Part 2: learning experience (Please choose 1 - 5 according to your feelings
during the course. 1 for strongly disagree; 5 for strongly agree)
(12) The course management system’s user interface is user friendly.
(13) The course management system is stable.
(14) Operation on the system is not hard to me.
(15) I got satisfactory supports on technical and other affairs.
(16) The course meets my individual needs.
(17) The course is highly international.
(18) References uploaded before class helps me preview the lecture.
298
D. Liang et al. (2014)
(19) Daily sign-in on the system encourages my attendance to the lecture.
(20) Quizzes and homework led to better mastering of key points.
(21) The mechanism of peer evaluation increased efficiency.
(22) Awards promoted my hardworking.
(23) I am satisfied with the course.
(24) Any comments or suggestions to the entire open online course please: