The General Health Questionnaire-28 (GHQ-28) as an outcome measurement in a randomized controlled trial in a Norwegian stroke population
Bạn đang xem bản rút gọn của tài liệu. Xem và tải ngay bản đầy đủ của tài liệu tại đây (946.06 KB, 11 trang )
Hjelle et al. BMC Psychology
(2019) 7:18
/>
RESEARCH ARTICLE
Open Access
The General Health Questionnaire-28
(GHQ-28) as an outcome measurement in a
randomized controlled trial in a Norwegian
stroke population
Ellen G. Hjelle1*, Line Kildal Bragstad1,2, Manuela Zucknick3, Marit Kirkevold1, Bente Thommessen4 and
Unni Sveen5,6
Abstract
Background: Several studies have documented the variety of post-stroke psychosocial challenges, which are complex,
multifaceted, and affect a patient’s rehabilitation and recovery. Due to the consequences of these challenges,
psychosocial well-being should be considered an important outcome of the stroke rehabilitation. Thus, a valid
and reliable instrument that is appropriate for the stroke population is required. The factor structure of the
Norwegian version of GHQ-28 has not previously been examined when applied to a stroke population.
The purpose of this study was to explore the psychometric properties of the GHQ-28 when applied in the
stroke population included in the randomized controlled trial; “Psychosocial well-being following stroke”, by
evaluating the internal consistency, exploring the factor structure, construct validity and measurement invariance.
Methods: Data were obtained from 322 individuals with a stroke onset within the past month. The Kaiser-Meyer-Olkin
(KMO) test was used to test the sampling adequacy for exploratory factor analysis, and the Bartlett’s test of sphericity
was used to test equal variances. Internal consistency was analysed using Cronbach’s alpha. The factor structure of the
GHQ-28 was evaluated by exploratory factor analysis (EFA), and a confirmatory factor analysis (CFA) was used to determine
the goodness of fit to the original structure of the outcome measurement. Measurement invariance for two time points
was evaluated by configural, metric and scalar invariance.
Results: The results from the EFA supported the four-factor dimensionality, but some of the items were loaded on
different factors compared to those of the original structure. The differences resulted in a reduced goodness of fit in
the CFA. Measurement invariance at two time points was confirmed.
Conclusions: The change in mean score from one to six months on the GHQ-28 and the factor composition are
assumed to be affected by characteristics in the stroke population. The results, when applying the GHQ-28 in a stroke
population, and sub-factor analysis based on the original factor structure should be interpreted with caution.
Trial registration: ClinicalTrials.gov, NCT02338869, registered 10/04/2014.
Keywords: Factor analysis, Psychometric properties, Stroke, Quality of life
* Correspondence:
1
Department of Nursing Science, and Research Center for Habilitation and
Rehabilitation Services and Models (CHARM), Faculty of Medicine, University
of Oslo, Oslo, Norway
Full list of author information is available at the end of the article
© The Author(s). 2019 Open Access This article is distributed under the terms of the Creative Commons Attribution 4.0
International License ( which permits unrestricted use, distribution, and
reproduction in any medium, provided you give appropriate credit to the original author(s) and the source, provide a link to
the Creative Commons license, and indicate if changes were made. The Creative Commons Public Domain Dedication waiver
( applies to the data made available in this article, unless otherwise stated.
Hjelle et al. BMC Psychology
(2019) 7:18
Background
Stroke may cause a number of psychosocial challenges
that affect a patient’s rehabilitation and recovery [1, 2].
Several studies have documented the variety of poststroke psychosocial challenges, which are complex and
multifaceted and may have different trajectories [3, 4].
Due to the consequences of these challenges for stroke
rehabilitation, psychosocial well-being should be considered an important outcome of rehabilitation.
One instrument that has been widely used for screening and assessing mental symptoms and psychosocial
well-being is the General Health Questionnaire (GHQ).
The purpose of the instrument is to discover features
that distinguish psychiatric patients from individuals
who consider themselves to be healthy, and the questionnaire particularly targets the grey area between psychological sickness and health [5]. Based on the original
60-item version, several versions of GHQ have been
constructed. The GHQ-28 was developed by Goldberg
and Hillier in 1979 and is based on an exploratory factor
analysis (EFA) of the original GHQ-60 [6].
The GHQ-28 is currently being applied as the primary
outcome measurement in a study evaluating the effect of
a psychosocial intervention on well-being after stroke
[7]. The present study was part of this multicentre, prospective, longitudinal, randomized controlled trial.
The GHQ-28 is a self-administered instrument and is
considered appropriate for research purposes [5]. This
scaled version was intended for studies in which the investigators seek more information than that provided by
a single severity score. In the construction of the
GHQ-28, items were selected to cover four main areas:
somatic symptoms, anxiety and insomnia, social dysfunction and severe depression [6]. The GHQ-28 focuses
on breaks in normal function that lead to an inability to
carry out one’s normal healthy activities. The questionnaire is concerned with the manifestation of new phenomena of a distressing nature within the last few weeks [5].
The GHQ-28 was originally developed in English for
Londoners. The questionnaire has been translated into
several different languages, including a Norwegian translation by Tom Andersen [8]. The dimensions of psychological health have been suggested to be universal across
cultures [6]. The stability of the factor structures has
been evaluated [9, 10] across different cultures and
samples [11–14]. The stability has mostly been confirmed across several different centres, except for that in
the study of Prady et al. They did not confirm goodness
of fit to the original structure or measure invariance
across different cultures [12].
Two studies have assessed the validity of the GHQ-28
for screening for post-stroke depression, in relation to
diagnosis by a standardized psychiatric interview [15, 16].
The researchers found that patients with depression
Page 2 of 11
scored significantly higher on the GHQ-28 than non-depressed stroke patients. The only study found, that evaluated measurement invariance of GHQ-28 in a stroke
population is that of Munyonbwe et al. [17], who evaluated measurement invariance prior to merging two samples for analysis. In their conclusion, the researchers
established a strong measurement invariance in two different stroke populations and confirmed the original
four-factor structure. They did not assess the measurement invariance over time, but recommended that future research on measurement invariance also evaluate
if the same construct is being measured across different
time points within samples [17].
In Norway, psychometric properties of the GHQ-30
version have been examined when used in a population of older people living at home [18]. In this study,
the original factor structure of the GHQ-30 was supported. Sveen et al. [19] tested the factor structure of
the 20-item version in patients who had suffered a
moderate stroke. The factor analysis in that study generated three factors: anxiety, coping, and satisfaction. The
factor structure of the Norwegian version of GHQ-28 has
not previously been examined when applied to a stroke
population.
Finding the right outcome measurement is an important aim when evaluating a complex intervention [20].
Culture and treatment vary between populations and
countries. We believe that an investigation of the
GHQ-28 when applied in a Norwegian stroke population
are a valuable contribution to the knowledge of suitable
outcome measurements for evaluating effect of psychosocial interventions in various stroke populations.
The aim of the present study was to explore the
psychometric properties of the GHQ-28 when applied in
a Norwegian stroke population by evaluating the internal
consistency, exploring the factor structure, construct
validity and measurement invariance.
Methods
Setting and study population
In total, 353 patients from 11 Norwegian acute stroke
or rehabilitation units providing acute stroke care
were included in the study from November 2014 to
November 2016. The inclusion criteria were as follows: the participants should be 18 years of age or
older, have suffered an acute stroke within the last
month, be medically stable, be evaluated by the
recruiting personnel to have sufficient cognitive functioning to participate, be able to understand and speak
Norwegian, and be capable of giving informed consent. Exclusion criteria were having moderate to
severe dementia, other serious somatic or psychiatric
diseases, or severe aphasia.
Hjelle et al. BMC Psychology
(2019) 7:18
Data collection procedures
Data were collected at baseline (T1) and six (T2) months
post-stroke. The GHQ-28, administered as a highly
structured interview, was the primary outcome measurement of the RCT along with five secondary outcome
measurements and the registration of demographic data.
The data collection were conducted in the participants’
homes or wherever the participants were at the time of
the assessment. The assessor read the questions to the
respondent, and recorded the respondent’s answers in a
web-based secure questionnaire by using a tablet.
GHQ-28
To evaluate the effect of the psychosocial intervention
on well-being, the GHQ-28 was chosen as the primary
outcome based on results from a comparable trial and
because it was evaluated as an appropriate tool to
capture emotional stress [5]. The GHQ-28 requests
participants to indicate how their health in general has
been over the past few weeks, using behavioural items
with a 4-point scale indicating the following frequencies
of experience: “not at all”, “no more than usual”, “rather
more than usual” and “much more than usual”. The
scoring system applied in this study was the same as the
original scoring system [6], the Likert scale 0, 1, 2, 3
[21]. The minimum score for the 28 version is 0, and the
maximum is 84. Higher GHQ-28 scores indicate higher
levels of distress. Goldberg suggests that participants
with total scores of 23 or below should be classified as
non-psychiatric, while participants with scores > 24 may
be classified as psychiatric, but this score is not an
absolute cut-off. It is recommended that each researcher
derive a cut-off score based on the mean of their
respective sample [22].
Statistics
Exploratory factor analysis (EFA) was performed using
SPSS Statistics for Windows, Version 24.0 [23]. Monte
Carlo PCA was used for the parallel analysis [24]. The
lavaan package version 0.5–23 [25] in R version 3.03
[26] was used to conduct the confirmatory factor
analysis (CFA) and the analysis of metric invariance.
The minimum amount of data for factor analysis was
satisfied [27, 28], with a final sample size of 322
(complete cases) for the exploratory factor analysis at
time point T1 (providing a ratio of 11.5 cases per variable). The 285 complete cases with data from both T1
and T2 were used for the CFA (providing a ratio of 10.2
cases per variable).
The data were screened for outliers, skewness and
missing values. The missing values were treated as missing at random (MAR). Using multiple imputation by
chained equations (MICE) in SPSS, the single missing
items where imputed at both time points [29, 30]. The
Page 3 of 11
MICE imputation model was constructed to include
each of the 28 single items across time points both as
predictors and to be imputed using the SPSS default imputation method of linear regression. Item constraints
were limited according to the Likert-scoring method and
imputation was specified to the closest integer. The multiple imputation produced five imputed data sets.
Because we only use the T1 data for the EFA and exclude
the cases completely missing at T2 for the CFA, missing
values were minimal (< 1% for both time points). The result are therefore only presented from one (imputation 1)
imputed dataset instead of pooled results of the five
imputed datasets, which is an acceptable approach for
very low proportions of missing data (< 3%) [31].
Initially, the factorability of the questionnaire was
examined. Several criteria for the factorability of a correlation were used. The correlation matrix was examined
for correlations above 0.3 [28]. The Kaiser-Meyer-Olkin
(KMO) measure was used to test the sampling adequacy
and was required to exceed 0.60 [32]. The result of
Bartlett’s test of sphericity [33] was considered statistically
significant if the p-value was < 0.05. Cronbach’s alpha was
used to estimate the reliability of the instruments based
on a required internal consistency > 0.7 [27, 34].
The factor structure was explored by EFA prior to
evaluating construct validity by CFA. The EFA was conducted using the unweighted least squares method with
direct oblimin rotation with Kaiser normalization to
account for correlations between the items [28].
The number of factors to be retained was guided by
three decision rules: Kaiser’s criterion (eigenvalue > 1), inspection of the scree plots, and Horn’s parallel analysis
[24]. Parallel analysis has been shown to provide more
consistent results when estimating the number of components than the more traditional methods based on eigenvalue > 1 and scree plots alone [27]. Only factors with
eigenvalues that exceeded the corresponding values from
the random dataset in the parallel analysis were retained.
As recommended, only factors loading greater than 0.30
were displayed, making the output easier to interpret [27].
CFA, using maximum likelihood estimation was conducted to evaluate the model fit to the original construct
of the GHQ-28 as proposed by Goldberg et.al [6], by
examining if indicators of selected constructs loaded
onto separate factors in the expected manner [35]. The
analysis was performed by group using data from both
the baseline and six-month datasets.
Several goodness-of-fit indicators were considered
in the analyses. Comparative fit index (CFI) and
Tucker-Lewis index (TLI) values less than .95 indicated lack of fit, and values above .95 indicated good
fit [28, 36]. A root mean squared error of approximation (RMSEA) of .06 or lower is suggested to indicate
a good fit [36].
Hjelle et al. BMC Psychology
(2019) 7:18
Page 4 of 11
We assessed measurement invariance by investigating
three levels of invariance, as recommended in previous
studies [37, 38]. The most basic level of measurement
invariance is configural invariance, which assumes that
the items load on the same latent factors across groups,
but factor loadings can vary. The second level, metric
invariance, requires that all factor loadings are the same
across groups. Scalar invariance is the strongest form of
invariance; it implies metric invariance and in addition
tests if the intercepts are the same across the two time
points. A change in CFI of less than 0.01 was considered
evidence of invariance. This cut-off is based on the cut-off value used in a comparable study [17] and recommendations [36].
considering potential higher severity and consequences
of stroke for the participants missing at T2.
Results
Four forced factors
Sample characteristics
Inspection of the correlation matrix revealed that all 28
items correlated > .3 with at least one other factor.
There were significant positive correlations among the
four latent factors (Table 3) supporting the use of
oblique (oblimin) rotation [28] and indicating that
respondents who showed high level in one dimension
were more likely to show high level in the others as well.
The KMO measure was 0.883, and Bartlett’s test of
sphericity reached statistical significance (p < 0.001) supporting the suitability for factor analysis.
The rotated solution revealed a structure with a number of strong loadings > .45 [28]. Only five of the included variables loaded less than .45 (.34–.44). All the
variables loaded substantially on one component.
The four-component solution explained a total of
51.6% of the variance at 1 month, with Factor 1 contributing to 27.8%, factor 2 contributing to 9.9%, factor 3
contributing to 8.2% and factor 4 contributing to 5.7%.
Details from the analysis are listed in Table 4.
The Norwegian version of the GHQ-28 was internally
consistent, as indicated by Cronbach alpha values of
0.844, 0.881, 0.838 and 0.719 for the four subscales.
Inspection of the pattern matrix shows that all the
anxiety and insomnia questions cluster together, accompanied by one question from the social dysfunction subscale and three from the severe depression subscale.
Only four questions remain in the severe depression factor. The questions regarding somatic symptoms cluster
together with six of the questions from the social dysfunction subscale. The three questions concerning
headaches or having hot or cold spells form their
own category.
Overall, these results support a four-factor solution as
proposed by Goldberg and Hillier [6]. However, the content of the factors does not fully support the original
scale structure. This finding makes it difficult to confirm
the original factor composition by examining the results
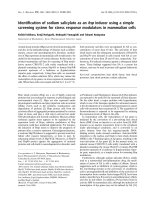
The flow of participants is shown in Fig. 1 and the characteristics of the 322 randomized are shown in Table 1.
The age ranged from 20 to 90 years, with a mean age of
66.2 years (SD 12.6). There were more males (59%) than
females (41%) participating in the study. According to
the measurement of neurological deficits, National Institutes of Health Stroke Scale (NIHSS), among the participants for whom we have information, 70% had no or
minor symptoms (scoring between 0 and 5 on the
NIHSS). In addition, based on the national register for
stroke patients admitted to hospitals in Norway, our
participants are on average 8 years younger than the
national stroke population. We have 5% more men than
expected based on the stroke population in Norway and
fewer patients with higher stroke severity [39].
At 1 month post-stroke (T1), the sum scores on the
GHQ-28 ranged from 6 to 72, with a mean sum score of
27 (SD 11.4). At 6 months post-stroke (T2), the sum
scores ranged from 5 to 60, with a mean sum score of
20 (SD 10.2).
There were few missing values in the dataset, representing only 0.29% of the 11 total values for the single
items at T1, and there were no complete missing cases.
The total percentage of missing values at T2 was 11.6%
measured in single items; however, after excluding the
37 complete missing cases, the percentage of missing
values was only 0.09%.
The 37 participants that were lost to follow up at T2,
did not have higher mean score on GHQ-28 compared
to the 285 with data from both time points, but the
mean age were higher (5 years) and they reported more
severe symptoms, more depression and more experiences of fatigue. However, only data from participants
that were assessed at both T1 and T2 was used for the
CFA. Since we are comparing the same set of patients at
T1 and T2, the results are comparable regardless of
Exploratory factor analysis (EFA)
No forced factors
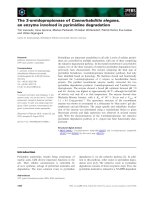
The exploratory analysis of the imputed dataset, with no
forced factors, resulted in five factors exceeding an
eigenvalue of one, and the scree plot showed a change in
the curve after five factors (Fig. 2).
Horn’s parallel analysis (Table 2) showed that only four
components exceeded the corresponding criterion value
for a randomly generated data matrix of the same size
(28 variables × 322 respondents).
Based on these analyses, four factors were retained for
further EFA.
Hjelle et al. BMC Psychology
(2019) 7:18
Page 5 of 11
Fig. 1 CONSORT diagram of the flow of patients through the trial
of the EFA alone. Therefore, the next step taken was to
test, by means of CFA, the fit of the original structure in
our stroke sample.
which a model fits reasonably well in a population [35],
exceeded the recommended fit index of 0.06 by 0.02. By
this, we could not confirm construct validity. The fit
indices are listed in Table 5.
Confirmatory factor analysis (CFA)
We fit the model using the full information maximum
likelihood (FIML). The comparative fit indices (CFI and
TLI) did not reach the level of 0.95, which would indicate a good fit [28, 36]. The root mean squared error of
approximation (RMSEA), which assesses the extent to
Measurements of invariance
The results from the testing of measurement invariance
showed that the GHQ-28 questionnaire has comparable
measurement properties at T1 and T2. The fit of the least
restrictive configural invariance model was compared with
Hjelle et al. BMC Psychology
(2019) 7:18
Page 6 of 11
Table 1 Characteristics at baseline (T1) and data from the Norwegian stroke population
Mean (SD)/ Total (%)
The Norwegian stroke register a
Mean (SD)
66.2 (12.6)
74.4
Median
67
76
Range
20–90
19–104
Missing
0
-
Female
132 (41%)
3895 (46%)
Male
190 (59%)
4514(54%)
Missing
0
-
Age
Gender
National Institutes of Health Stroke Scale (NIHSS) b
0–5
170 (70%)
4119 (65%)
6–10
45 (19%)
1009 (16%)
11–15
17 (7%)
505 (8%)
16 +
8 (4%)
675 (11%)
Missing
82 (25%)
2230 (26%)
GHQ-28 (T1) Min 6, Max 72
27 (11.4)
-
Complete cases missing
0
-
GHQ-28 sum score
GHQ-28 (T2 (n = 285)) Min 5, Max 60
20 (10.2)
-
Complete cases missing
37 (11%)
-
a
Data from the Norwegian stroke population admitted to hospitals in 2015 registered in a Norwegian stroke register [39]. b Of the 240 patients for whom we had
baseline data and the 6308 for whom data were registered in the Norwegian stroke register
the results from the more restrictive metric and scalar invariance models (Table 6). Neither the metric nor scalar
invariance model produced a change in the CFI of ≥0.01,
which confirmed the metric and scalar measurement
invariance within groups for the two time points.
Discussion
The aim of the study was to explore the psychometric
properties of the GHQ-28 when applied in a Norwegian
stroke population by evaluating the internal consistency,
exploring the factor structure, construct validity and
measurement invariance.
Overall, the results from the EFA support a four-factor
solution, but some of the items load on different factors
from those in the original version proposed by Goldberg
and Hillier [6]. The often-suggested threshold for the indices of goodness of fit in a CFA was not achieved,
which indicates that caution is required when interpreting subfactor scores in a stroke sample. Measurement
invariance was established for the same groups over two
time points, which has, to the best of our knowledge,
not previously been evaluated for GHQ-28 in a stroke
population. This confirms that the same construct is
being measured at both time points.
The EFA shows that the first factor in our sample
addresses issues concerning anxiety and insomnia, in
addition to one item from the social dysfunction
subscale regarding enjoyment of daily activities and
three items regarding nervousness and feelings of hopelessness originally categorized in the severe depression
subcategory. This finding reflects the correlation between anxiety and depressive symptoms, which are
known to be associated with one another in a stroke
population [40, 41].
The second factor consists of the four most severe
questions from the severe depression category about lack
of joy in life and suicidality. The severity of the questions
distinguishes them from the other questions regarding
less severe depressive thoughts that correlate with
anxiety and insomnia. Because the questions that address depressive thoughts are split between two factors
in this study, examining the scoring in the original severe depression category alone is not sufficient when
evaluating depression in a stroke population.
The third category contains four items from the original somatic symptoms factor and six items from the
social dysfunction factor. Not feeling “perfectly well and
in good health” in addition to feelings of being “run
down and out of sorts”, “in need of a good tonic” or
having “feelings of being ill” are, not unexpectedly, associated with social dysfunction. Altogether, these seven
subjective evaluation questions address factors of social
Hjelle et al. BMC Psychology
(2019) 7:18
Page 7 of 11
Fig. 2 Screeplot from the EFA with no forced factors
interrelation, emotional reactions, and judgements
formed about life satisfaction and fulfilment, which can
be interpreted as aspects of social function and psychosocial well-being.
The original population in which the measurement
was developed did not suffer from any specific somatic
illnesses. It has previously been claimed that certain
responses on the GHQ-28 can be produced by physical
or psychiatric disease [8, 42, 43]. In our study, an example of this situation is particularly apparent when we
investigate the fourth factor from the EFA. This factor is
formed by the items addressing somatic symptoms such
as headache or having hot or cold spells. Pain and headache is a complication that can occur after stroke [44]
and may also be a known side effect of medications used
as secondary prevention after stroke [45] and is therefore not necessarily related to psychological distress.
Even if an association with psychological challenges can
be argued, forming a separate category, this does not
necessarily make the items irrelevant to the evaluation
of psychosocial well-being using the GHQ-28 total score
since pain is known to be associated with health-related
quality of life [46].
There are challenges applying a rating scale across
countries and languages and to different populations.
The stability of the factor structure has been examined
in a study comparing the results from several different
countries [10]. The researchers highlight some factors
that might explain the differences as variances in the
expression of distress, effect of translation and degree of
industrial development. In our sample, most of the participants were born in Norway to Norwegian parents
(92%). Even if the sample in this study is homogeneous,
the original factor structure was developed in a London
cultural setting. Subtle changes in understanding due to
linguistic nuances or cultural differences in beliefs about
Table 2 Horn’s parallel analysis of the five factors exceeding an
eigenvalue of 1
Table 3 Factor correlation matrix a
Factor
1
2
3
4
Component
number
Actual eigenvalue
from the EFA at T1
Criterion value from
the parallel analysis
Decision
1
1000
–0,380
–0,459
0,279
1
7.795
1.589
Accept
2
–0,380
1000
0,259
0,017
3
–0,459
0,254
1000
-0,157
4
0,279
0,017
-0,157
1000
2
2.772
1.497
Accept
3
2.302
1.433
Accept
4
1.596
1.381
Accept
5
1.038
1.331
Reject
Extraction Method: Unweighted Least Squares. Rotation Method: Oblimin with
Kaiser Normalization, Imputation 1
a
If correlations between factors are > 0.3, oblique rotation is the
recommended approach because it produces a clearer result than orthogonal
Hjelle et al. BMC Psychology
(2019) 7:18
Page 8 of 11
Table 4 Exploratory factor analysis (EFA) with four forced factors (n = 322, Imputation 1)
Factor 1
Explaining 27.8%
of the variance
Cronbach’s α:
0.844
Factor 2
Explaining 9.9%
of the variance
Cronbach’s α:
0.881
Factor 3
Explaining 8.2% of
the variance
Cronbach’s α:
0.838
Factor 4
Explaining 5.7%
of the variance
Cronbach’s α:
0.719
Pattern Structure Pattern Structure Pattern Structure Pattern Structure
a
(A) Somatic symptoms
1. Been feeling perfectly well and in good health?
−0.742 −0.694
0.457
2. Been feeling in need of a good tonic?
−0.364 −0.430
0.270
3. Been feeling run down and out of sorts?
−0.514 −0.569
0.378
4. Been feeling that you are ill?
−0.491 −0.568
0.432
5. Been getting any pains in your head?
0.718
0.754
0.535
6. Been getting a feeling of tightness or pressure in your
head?
0.637
0.677
0.518
7. Been having hot or cold spells?
0.448
0.508
0.320
(B) Anxiety and insomnia
1. Been losing much sleep over worry?
0.572
0.610
0.414
2. Been having difficulty in staying asleep once you fall
asleep?
0.344
0.433
0.321
3. Been feeling constantly under strain?
0.585
0.585
0.372
4. Been getting edgy or bad tempered?
0.485
0.508
0.327
5. Been getting scared or panicky for no reason?
0.635
0.612
0.444
6. Been feeling everything is getting on top of you?
0.621
0.659
0.442
7. Been feeling nervous and strung-out all the time?
0.710
0.713
0.482
(C) Social dysfunction
−0.521 −0.553
1. Been managing to keep yourself busy and occupied?
0. 381
2. Been taking longer over the things you do?
−0.670 −0.644
0.427
3. Been feeling on the whole that you were doing things
well?
−0.692 −0.689
0.480
4. Been satisfied with the way you have carried out your
tasks?
−0.688 −0.716
0.499
5. Been feeling that you are playing a useful part in things?
−0.646 −0.643
0.439
6. Been feeling capable of making decisions about things?
−0.349 −0.403
0.220
7. Been able to enjoy your normal day-to-day activities?
0.392
0.442
0.327
1. Been thinking of yourself as a worthless person?
0.515
0.589
0.469
2. Been feeling that life is entirely hopeless?
0.580
0.670
0.584
(D) Severe depression
3. Been feeling that life is not worth living?
−0.591 −0.699
0.560
4. Been thinking of the possibility that you may do away
with yourself?
−0.974 −0.957
0.827
5. Been feeling at times that you could not do anything
because your nerves were too bad?
a
0.493
0.596
0.480
6. Been finding yourself wishing you were dead and away
from it all?
−0.827 −0.856
0.730
7. Been finding that the idea of taking your own life keeps
coming into your mind?
−0.869 −0.835
0.726
Communalities indicate the amount of variance in each variable that is accounted for
Hjelle et al. BMC Psychology
(2019) 7:18
Page 9 of 11
Table 5 Fit indices and estimates of the latent variable for the
T1 and T2 datasets (imputation 1) (n = 285)
Table 6 Overall fit indices from the measurement invariance
tests
Items
T1
T2
χ2(df)
CFI
TLI
RMSEA
χ 2 (df)
p < 0.001 (378)
p < 0.001 (378)
Measurement
invariance modela
CFIb
0.784
0.774
Configural
2143.235 (688) p < 0.001
0.779
0.757
0.086
Metric
2176.377 (716) p < 0.001
0.778
0.766
0.085
Scalar
2262.083 (740) p < 0.001
0.769
0.764
0.085
TLI
0.762
0.752
RMSEA
0.084
0.088
CFI comparable fit index, TLI Tucker-Lewis index, RMSEA root mean square
error of approximation
a
Latent variablesa
(A) Somatic symptoms
Item 1
0.518
0.399
Item 2
0.452
0.457
Item 3
0.627
0.634
Item 4
0.702
0.535
Item 5
0.521
0.337
Item 6
0.501
0.475
Item 7
0.379
0.300
Item 1
0.623
0.528
Item 2
0.390
0.416
Item 3
0.480
0.383
Item 4
0.442
0.449
Item 5
0.522
0.414
Item 6
0.570
0.499
Item 7
0.589
0.506
Item 1
0.449
0.406
Item 2
0.451
0.415
Item 3
0.413
0.365
Item 4
0.562
0.477
Item 5
0.453
0.414
Item 6
0.213
0.172
Item 7
0.333
0.269
Item 1
0.385
0.414
Item 2
0.436
0.480
Item 3
0.465
0.442
Item 4
0.410
0.347
Item 5
0.335
0.343
Item 6
0.413
0.456
Item 7
0.354
0.365
(B) Anxiety and insomnia
(C) Social dysfunction
(D) Severe depression
a
All the estimates had a p-value < 0.001
b
CFI comparative fit index, TLI Tucker–Lewis index, RMSEA root mean square
error of approximation
health, expectations for the rehabilitation process or
health care system may influence how the questionnaire
was scored.
A strength in this study is that there were few missing
items. Another strength is the application of both
exploratory and confirmatory factor analyses.
One limitation is not having a sufficient sample to split
the material for the EFA and CFA. Another limitation is
that the patients with the most severe strokes or aphasia
were difficult to enrol due to early inclusion and requirements for informed consent. Nevertheless, the study
sample is representative of a large amount of the stroke
population in Norway, since mild and moderate strokes
are far more common than severe strokes [39].
Conclusions
The Norwegian version of the GHQ-28 confirms a
four-factor solution, but with some differences in the
factor structure compared to that of the original version.
The CFA did not reach the strict cut-off for goodness of
fit recommended in the literature. Measurement invariance across time points was confirmed, indicating that
the same construct of the GHQ-28 is measured across
time. However, the change in mean score on the
GHQ-28 and the factor composition are assumed to be
affected by characteristics in the stroke population. The
results, when applying GHQ-28 in a stroke population,
and sub-factor analysis based on the original factor
structure should be interpreted with caution.
Abbreviations
CFA: Confirmatory factor analysis; CFI : Comparative fit index;
EFA: Exploratory factor analysis; GHQ - 28: General Health Questionnaire - 28;
KMO: Kaiser-Meyer-Olkin; NIHSS: National Institutes of Health Stroke Scale;
RMSEA : Root mean square error of approximation; TLI : Tucker–Lewis index
Acknowledgements
Not applicable.
Funding
This work was supported by a grant from the Extra Foundation (2015/
FO13753), the South-Eastern Norway Regional Health Authority (Project no.
2013086) and funding from the European Union Seventh Framework
Programme (FP7-PEOPLE-2013-COFUND) under grant agreement no 609020
- Scientia Fellows.
Hjelle et al. BMC Psychology
(2019) 7:18
Availability of data and materials
Datasets generated and analyzed during the current study are not publicly
available due to strict ethics regulation in Norway, but may be available from
the corresponding author on reasonable request.
Authors’ contribution
All authors have made substantial contributions to the manuscript and made
the final approval of the version to be submitted. Even if EGH has been in
charge of the process, the writing of the manuscript was done in close
collaboration between all authors. EGH and MZ conducted the statistical
analyses and MZ, LKB, MK, BT and US have reviewed and provided
comments on the subsequent drafts.
Ethics approval and consent to participate
Ethical approval was obtained from the Regional Committee for Ethics in
Medical Research (2013/2047) and by the Data Protection Authorities (2014/
1026). All patients gave their written consent before inclusion.
Competing interests
The authors declare that they have no competing interests.
Publisher’s Note
Springer Nature remains neutral with regard to jurisdictional claims in
published maps and institutional affiliations.
Author details
1
Department of Nursing Science, and Research Center for Habilitation and
Rehabilitation Services and Models (CHARM), Faculty of Medicine, University
of Oslo, Oslo, Norway. 2Department of Geriatric Medicine, Oslo University
Hospital, Oslo, Norway. 3Oslo Centre for Biostatistics and Epidemiology,
Department of Biostatistics, Faculty of Medicine, University of Oslo, Oslo,
Norway. 4Department of Neurology, Akershus University Hospital, Lorenskog,
Norway. 5Department of Geriatric Medicine and Physical Medicine and
Rehabilitation, Oslo University Hospital, Oslo, Norway. 6Faculty of Health
Sciences, Oslo Metropolitan University, Oslo, Norway.
Received: 6 July 2018 Accepted: 27 February 2019
References
1. Kouwenhoven SE, Kirkevold M, Engedal K, Kim HS. Depression in acute
stroke: prevalence, dominant symptoms and associated factors. A systematic
literature review. Disabil Rehabil. 2011;33(7):539–56. />09638288.2010.505997.
2. Hackett ML, Anderson CS, House A, Halteh C. Interventions for preventing
depression after stroke. Cochrane Database Syst Rev. 2008;3:CD003689.
/>3. Hawkins RJ, Jowett A, Godfrey M, Mellish K, Young J, Farrin A, et al.
Poststroke trajectories: the process of recovery over the longer term
following stroke. Glob Qual Nurs Res. 2017;4:2333393617730209. https://doi.
org/10.1177/2333393617730209.
4. van Mierlo M, van Heugten C, Post MWM, Hoekstra T, Visser-Meily A.
Trajectories of health-related quality of life after stroke: results from a oneyear prospective cohort study. Disabil Rehabil. 2017:1–10. />1080/09638288.2017.1292320.
5. Goldberg D, Williams P. A user’s guide to the general health questionnaire.
London: Nfer-Nelson; 1991.
6. Goldberg DP, Hillier VF. A scaled version of the general health
questionnaire. Psychol Med. 1979;9(1):139–45.
7. Kirkevold M, Kildal Bragstad L, Bronken BA, Kvigne K, Martinsen R, Gabrielsen
Hjelle E, et al. Promoting psychosocial well-being following stroke: study
protocol for a randomized, controlled trial. BMC Psychol. 2018;6(1):12.
/>8. Malt UF, Mogstad TE, Refnin IB. Goldberg's general health questionnaire.
Tidsskr Nor Laegeforen. 1989;109(13):1391–4.
9. Goldberg DP, Gater R, Sartorius N, Ustun TB, Piccinelli M, Gureje O, et al. The
validity of two versions of the GHQ in the WHO study of mental illness in
general health care. Psychol Med. 1997;27(1):191–7.
10. Werneke U, Goldberg DP, Yalcin I, Ustun BT. The stability of the
factor structure of the general health questionnaire. Psychol Med.
2000;30(4):823–9.
Page 10 of 11
11. Ardakani A, Seghatoleslam T, Habil H, Jameei F, Rashid R, Zahirodin A, et al.
Construct validity of symptom Checklist-90-revised (SCL-90-R) and general
health Questionnaire-28 (GHQ-28) in patients with drug addiction and
diabetes, and Normal population. Iran J Public Health. 2016;45(4):451–9.
12. Prady S, Miles J, Pickett K, Fairley L, Bloor K, Gilbody S, et al. The
psychometric properties of the subscales of the GHQ-28 in a multi-ethnic
maternal sample: results from the born in Bradford cohort. BMC Psychiatry.
2013;13:55. />13. de Kock FS, Gorgens-Ekermans G, Dhladhla TJ. A confirmatory factor analysis
of the general health Questionnaire-28 in a black south African sample. J
Health Psychol. 2014;19(10):1222–31. />1359105313488972.
14. Molina JD, Andrade-Rosa C, Gonzalez-Parra S, Blasco-Fontecilla H, Real MA,
Pintor C. The factor structure of the general health questionnaire (GHQ): a
scaled version for general practice in Spain.(report). Eur Psychiatry. 2006;
21(7):478. />15. Lincoln NB, Nicholl CR, Flannaghan T, Leonard M, Van der Gucht E. The
validity of questionnaire measures for assessing depression after stroke. Clin
Rehabil. 2003;17(8):840–6. />16. Thomas SA, Lincoln NB. Factors relating to depression after stroke. Br J Clin
Psychol. 2006;45(Pt 1):49–61. />17. Munyombwe T, West RM, Hill K. Testing measurement invariance of the
GHQ-28 in stroke patients. Qual Life Res. 2015;24(8):1823–7. />10.1007/s11136-015-0924-8.
18. Dale B, Soderhamn U, Soderhamn O. Psychometric properties of the
Norwegian version of the general health questionnaire (GHQ-30) among
older people living at home. Psychol Res Behav Manag. 2012;5:151–7.
/>19. Sveen U, Thommessen B, Bautz-Holter E, Wyller TB, Laake K. Well-being and
instrumental activities of daily living after stroke. Clin Rehabil. 2004;18(3):267–74.
20. Richards DA, Hallberg IR. Complex interventions in health: an overview of
research methods. New York: Routledge; 2015.
21. Likert R. A technique for the measurement of attitudes. Arch Psychol. 1932;
22(140):55.
22. Goldberg DP, Oldehinkel T, Ormel J. Why GHQ threshold varies from one
place to another. Psychol Med. 1998;28(4):915–21.
23. Corp I. IBM SPSS statistics for windows, version 24.0. Armonk: IBM
Corp; 2016.
24. Watkins MW. Determining parallel analysis criteria. J Mod Appl Stat
Methods. 2006;5(2):344–6. />25. Rosseel Y. Lavaan: an R package for structural equation modeling. J Stat
Softw. 2012;48(2):1-36.
26. Team R. RStudio: integrated development for R. Boston: RStudio, Inc; 2015.
27. Pallant J. SPSS Survival Manual : A Step by Step Guide to Data Analysis
Using SPSS. Berkshire: Open University press; 2011.
28. Tabachnick BG, Fidell LS. Using multivariate statistics (6th ed., new
international ed. ed., always learning). Harlow: Pearson; 2014.
29. Plumpton CO, Morris T, Hughes DA, White IR. Multiple imputation of
multiple multi-item scales when a full imputation model is infeasible. BMC
Res Notes. 2016;9:45. />30. White IR, Royston P, Wood AM. Multiple imputation using chained
equations: issues and guidance for practice. Stat Med. 2011;30(4):377–99.
/>31. Harrell JFE, Bickel P, Diggle P, Fienberg SE, Gather U, Olkin I, et al.
Regression Modeling Strategies: With Applications to Linear Models, Logistic
and Ordinal Regression, and Survival Analysis (2nd ed. 2015 ed., springer
series in statistics). Cham: Springer international publishing; 2015.
32. Kaiser H. An index of factorial simplicity. Psychometrika. 1974;39(1):31–6.
/>33. Bartlett MS. A note on the multiplying factors for various chi square
approximations. J R Stat Soc Series B Methodol. 1954;16(2):296–8.
34. DeVellis RF. Scale development : theory and applications (fourth edition. Ed.,
applied social research methods series). Los Angeles: SAGE; 2017.
35. Brown TA. Confirmatory factor analysis for applied research (2nd ed. ed.,
confirmatory factor analysis for applied research). New York: Guilford press; 2015.
36. Hu LT, Bentler P. Cutoff criteria for fit indexes in covariance structure
analysis: conventional criteria versus new alternatives. Struct Equ Model
Multidiscip J. 1999;6(1):1–55. />37. van de Schoot R, Lugtig P, Hox J. A checklist for testing measurement
invariance. Eur J Dev Psychol. 2012;9(4):486–92. />17405629.2012.686740.
Hjelle et al. BMC Psychology
(2019) 7:18
38. Chungkham HS, Ingre M, Karasek R, Westerlund H, Theorell T. Factor
structure and longitudinal measurement invariance of the demand control
support model: an evidence from the Swedish longitudinal occupational
survey of health (SLOSH). PLoS One. 2013;8(8):e70541. />1371/journal.pone.0070541.
39. Norwegian Directorate of Health. Norsk hjerneslag register. Utarbeidet av
Nasjonalt sekretariat for Norsk hjerneslagregister, Seksjon for medisinske
kvalitetsregistre. Trondheim: St. Olavs Hospital HF; 2015. https://www.
kvalitetsregistre.no/registers/353/resultater. Accessed 13 June 18
40. Spurgeon L, James G, Sackley C. The hospital anxiety and depression scale:
a pilot study to examine its latent structure and the link between
psychological state and symptom severity in transient ischaemic attack
patients. Psychol Health Med. 2016;21(5):632–8. />13548506.2015.1074711.
41. Schottke H, Giabbiconi CM. Post-stroke depression and post-stroke anxiety:
prevalence and predictors. Int Psychogeriatr. 2015;27(11):1805–12. https://
doi.org/10.1017/s1041610215000988.
42. Goldberg D. Use of the general health questionnaire in clinical work. Br
Med J (Clin Res Ed). 1986;293(6556):1188–9.
43. van Hemert AM, den Heijer M, Vorstenbosch M, Bolk JH. Detecting
psychiatric disorders in medical practice using the general health
questionnaire. Why do cut-off scores vary? Psychol Med. 1995;25(1):165–70.
44. Harrison RA, Field TS. Post stroke pain: identification, assessment, and
therapy. Cerebrovasc Dis. 2015;39(3–4):190–201. />000375397.
45. Halkes PH, van Gijn J, Kappelle LJ, Koudstaal PJ, Algra A. Aspirin plus
dipyridamole versus aspirin alone after cerebral ischaemia of arterial origin
(ESPRIT): randomised controlled trial. Lancet. 2006;367(9523):1665–73.
/>46. Naess H, Lunde L, Brogger J. The effects of fatigue, pain, and depression on
quality of life in ischemic stroke patients: the Bergen stroke study. Vasc
Health Risk Manag. 2012;8:407–13. />
Page 11 of 11