Agreement between parent and child report of physical activity, sedentary and dietary behaviours in 9-12-year-old children and associations with children’s weight status
Bạn đang xem bản rút gọn của tài liệu. Xem và tải ngay bản đầy đủ của tài liệu tại đây (443.09 KB, 11 trang )
Koning et al. BMC Psychology (2018) 6:14
/>
RESEARCH ARTICLE
Open Access
Agreement between parent and child
report of physical activity, sedentary and
dietary behaviours in 9-12-year-old children
and associations with children’s weight
status
Maaike Koning1* , Astrid de Jong1,2, Elske de Jong1,3, Tommy L. S. Visscher1, Jacob C. Seidell1,2
and Carry M. Renders1,2
Abstract
Background: To date, population based surveys aimed at gaining insight in health related behaviour of children
have often used either child self-reports or parent proxy reports. It remains unclear however, if surveys using
different sources of information from either parents or children are comparable. In addition, (over)weight status of
children can lead to under- and over reporting by parents and children as a result of social desirability bias. We
aimed at gaining insight in the level of agreement between parents and child reports regarding aspects of certain
dietary, physical activity and sedentary behaviours, and whether there are differences in agreement between
parents and child reports in healthy-weight and overweight children.
Methods: Weighted kappa was used to determine the level of agreement between child and parent reports on
health-related behaviour in 1998 parent-child dyads. We also stratified for weight status of the children. Information
on children’s health related behaviours was obtained by parental and children’s questionnaires, and children’s
height and weight were measured. Associations between children’s weight status and children reporting less,
reporting more and reporting the same amount of health behaviour as their parents were investigated with
multinomial logistic regression analysis.
Results: The Cohen’s kappa coefficients ranged from almost perfect agreement for the variable means of
transportation, fair for the variables breakfast consumption and frequency of outside play to slight for the variables
duration of outside play, frequency and duration of TV/DVD viewing and family dinner. Overweight children were
significantly more likely to report less breakfast consumption (OR = 2.6 (95% CI: 1.3 – 5.1)) and lower frequency of
outside play than their parents (OR = 1.8 (95% CI: 1.1 – 2.9)).
Conclusion: There can be considerable disagreement between the health related behaviours of children as
reported by parents or the children themselves. Based on the present study, it cannot be concluded whether
parents’ or children’s reports are more accurate. For future studies, social desirability and recall bias would be best
demonstrated in a validation study comparing child and parent self-reports with more objective measures of
physical activity and food intake.
Keywords: Agreement, Child reports, Parent proxy reports, Health behaviours, Meal patterns, Physical activity
* Correspondence:
1
Research Centre Healthy Cities, Knowledge Centre for Health and Social
work, Windesheim University of Applied Sciences, PO box 10090, 8000 GB
Zwolle, the Netherlands
Full list of author information is available at the end of the article
© The Author(s). 2018 Open Access This article is distributed under the terms of the Creative Commons Attribution 4.0
International License ( which permits unrestricted use, distribution, and
reproduction in any medium, provided you give appropriate credit to the original author(s) and the source, provide a link to
the Creative Commons license, and indicate if changes were made. The Creative Commons Public Domain Dedication waiver
( applies to the data made available in this article, unless otherwise stated.
(2018) 6:14
Koning
Page 2 of 11
Background
’
–
–
“
”
’
–
’
’
Methods
Study design
–
’
’
–
’
’
’
–
Koning et al. BMC Psychology (2018) 6:14
studies. For children younger than 12 years old parental
consent only is sufficient for participation, and for children older than 16 years old no parental consent is
needed for participation. Medical ethical approval was
obtained from the Medical Ethics Committee of the VU
University Medical Centre.
Study population
A total of 43 primary schools in the city of Zwolle were
invited to participate, of which 35 (81%) schools participated. When schools did not want to participate, it was
mostly because of other priorities. Participating schools
were equally spread over all neighborhoods in Zwolle.
When a school agreed to be included in the study, all
children attending the school (4-12 years) and their parents were invited to participate by means of letters distributed via the schools. For this study passive consent,
which involved distributing a letter to the children’s parents and to children that were 12 years or older describing the study and instructing them to respond only if
they did not want (their child) to participate, was required from all parents and from those children that
were 12 years old and older. In these letters we included
information on the consent procedure, and underlined
the possibility for children (and parents) to end participation in the study at any time, even when consent has
been obtained. There were 135 (2.2%) parents that did
not give consent for participation and 34 (0.6%) children
that refused to participate in the anthropometrical measurements. Children without anthropometrical data were
excluded from this study because weight status of the
child is a crucial variable in this study. Further exclusion
criteria for participants were not being proficient in the
Dutch language, being older than 12 years of age, and
not living in the city of Zwolle.
A total of 3328 children aged 9 to 12 years old from
the 6th, 7th and 8th grade completed questionnaires,
but 1330 of those children did not have a matched parent report of health behaviours, leaving a sample of 1998
matched parent and child reports. Additionally, anthropometrical measurements of the children (height, weight
and waist circumference) were performed. Eligible children included those who had an anthropometric measurement (height and weight), whose parents filled in a
self-report questionnaire about the reported behaviours,
and who completed a questionnaire themselves. A total
of 1998 children aged 9 to 12 years old met these criteria
and were included in this study.
Measurements
Anthropometric measurements
Anthropometric measurements were performed during 3
weeks in October and November 2012. Trained students
measured body height, weight and waist circumference
Page 3 of 11
using a standardized protocol [25, 26]. Height was measured to the nearest 0.1 cm with a stadiometer, and weight
was measured to the nearest 0.1 kg with a Seca digital
scale. During the measurements, the children wore gym
clothing and no shoes. Body Mass Index (BMI) was calculated as weight in kilograms divided by height in meters
squared. The children’s age- and sex-specific BMI cut-off
points suggested by Cole et al. were used to define thinness, healthy weight, overweight and obesity [27, 28]. We
used the term thinness which WHO uses to mean low
BMI in adults and adolescents [29]. The international
BMI cut offs for child overweight and obesity are based
on the adult cut offs of 25 and 30 at 18 years and cover
the age range 2-18 years [28]. It would be logical to produce BMI cut offs for underweight or thinness using the
same principle. However, presently, no expert guidelines
for thinness exist, and the current cut-offs classifying thinness are merely based on supposition [27, 30, 31]. In
addition, underweight or thinness does not have the same
meaning in adults and children. In adults, underweight or
thinness indicates low BMI, and can have serious health
consequences and comorbidities, whereas in children
underweight is low weight for age and wasting is low
weight for height [29]. Cole et al. suggest extending the
adult term of thinness to children, meaning low BMI for
age [27]. For these reasons, and because the prevalence
rates of thinness (9%) and obesity (1.4%) in our study were
relatively low, we grouped children who were not overweight and defined them as ‘healthy-weight children’ and
grouped children who were overweight and obese and defined them as ‘overweight’.
Questionnaires
The ChecKid children’s questionnaire consisted of questions on health-related lifestyle behaviours (diet, physical
activity, sleeping habits, sedentary behaviour) and
determinants of these behaviours (e.g. home and school
environments) and was designed for children aged 9
-12 years of age attending grade 6, 7 and 8 in Dutch
primary schools. The children’s questionnaire concerned
children’s behaviour during a regular schoolday as we
were especially interested in finding indications for interventions that could possibly be implemented or
supported in a school setting. The ChecKid parental
questionnaire consisted of questions on the same subjects but also included socio-demographic variables such
as the child’s age, gender, postal code, ethnicity (assessed
by country of birth of both parents) and socio-economic
status (SES) (assessed by educational level of parents).
Existing validated questionnaires on health behaviour
were used for the design of the questionnaires [32, 33].
Because a limited amount of questions was worded in
exactly the same way in both the parent and children’s
questionnaires, we could only use these questions for
Koning et al. BMC Psychology (2018) 6:14
our analyses on the level of agreement between parent
and child reports. Questions worded in exactly the same
way on the parent and child questionnaires were used
for the analyses regarding parent-child agreement. For
example, we asked children the following questions ‘On
how many days do you eat breakfast before going to
school during the schoolweek?’ and ‘On how many days
do you eat dinner at the dining table with your parents
during the schoolweek?’. The corresponding questions for
the parents were ‘On how many days does your child eat
breakfast before going to school during the schoolweek’
and ‘On how many days do you and your child eat together at the dining table during the schoolweek?’.Children could respond with: (almost) never; 1 day per week;
2 days per week; 3 days per week; 4 days per week; 5 days
per week, and the corresponding response categories for
parents were: 0 or < 1; 1; 2; 3; 4; 5 days in a regular school
week. For the exact questions used see Additional file 1.
Health behaviours
We investigated the level of agreement between parent
and children reports with respect to five important
health related behaviours: breakfast consumption; family
dinner; outside play; means of transportation to school
and TV/DVD viewing. Outside play was used as indicator of the child’s physical activity, and TV/DVD viewing
was used as an important indicator of sedentary behaviour. Family dinner and breakfast consumption were
used as indicators of the child’s dietary behaviour. As the
main purpose of this study was to examine agreement
between the reports, we only used five questions which
were worded identically in the parental and children’s
questionnaires. We were aware that that the examined
behaviours were used as indicators of the specific behaviours, and thus may not represent the wider health related behaviour.
Frequency of breakfast consumption on schooldays
and frequency of eating a family dinner together at the
table on schooldays in both parents and children were
used as indicators of meal patterns.
Outside play was used as an indicator for physical
activity and was measured by investigating time spent
on outside play. Parents and children were asked to
report frequency and duration of time (in categories)
spent on outside play. Average time per day spent on
the behaviour was calculated by multiplying the number
of days that the child spent on the behaviour by the
mid-category values of duration of the item in 5 categories: < 0.5, 0.5-1, 1-2, 2-3, and > 3 h a day, and dividing
this by 5; the number of schooldays per week. The categories ‘2-3 h’ and ‘more than 3 hours’ were combined
so that the response categories in the parents’ reports
were the same as they were for the children’s reports.
Current recommendations for children aged 5 to 17 years
Page 4 of 11
are to spend at least 60 min per day on outside play
[34]. Therefore, outdoor play was dichotomized as < 60
and ≥ 60 min per day.
TV/DVD viewing was used as an indicator for sedentary behaviour, as TV viewing has been known to be an
important determinant for the development of overweight [35]. Parents and children were asked to report
frequency and duration of time (in categories) spent
watching TV/DVD. Average time per day spent on the
behaviour was calculated by multiplying the number of
days that the child spent on the behaviour by the mid-category values of duration of the item in 5 categories: <
0.5, 0.5-1, 1-2, 2-3, and > 3 h a day, and dividing this by
5; the number of schooldays per week. The categories ‘23 h’ and ‘more than 3 hours’ were combined so that the
response categories in the parents’ reports were the
same as they were for the children’s reports. Current
recommendations for children aged 4 to 17 years are not
to use screentime for more than 2 h per day [36, 37].
Thus, TV/DVD viewing was dichotomized as < 2 and ≥
2 h per day.
Means of transportation to school could be indicated
by the following options: cycling; walking; on the back of
a scooter; on the back of a bicycle; brought by car; by
bus; other.
Statistical analyses
Statistical analyses were conducted using the PASW 20.0
and Stata 11 (StataCorp, College Station, Texas) software
packages. Descriptive statistics were used (mean, standard deviations and percentages) to describe the study
sample and the differences in parent reports of the behaviours and child reports of the behaviours.
Level of agreement between parent proxy reports and
child-self reports.
To assess the level of agreement between child and
parent reports about frequency of breakfast consumption, frequency of family dinner, average duration and
frequency of outside play and average duration and frequency of TV/DVD viewing, we compared calculated
averages of frequency and duration of the studied behaviours. To do so, the weighted kappa statistic was used.
The response categories of these variables are ordinal
which means that not every disagreement can be
weighted the same; for example, a difference between
categories of ‘0 days per week’ and ‘5 days per week’ is a
more serious discrepancy than a difference between
categories of ‘3 days per week’ and ‘4 days per week’. In
this study, we used the non-weighted kappa statistic
to determine the level of agreement between child
and parent reports on the means of transportation to
school, because of the categorical response categories.
The non-weighted kappa statistic does not take the
extent of disagreement in account, every disagreement
Koning et al. BMC Psychology (2018) 6:14
is weighted evenly [38, 39]. To classify the strength of
agreements the standards of Landis and Koch were
used for the kappa coefficients: ≤0 = poor, 0.01–0.20 =
slight, 0.21–0.40 = fair, 0.41–0.60 = moderate, 0.61–0.
80 = substantial, and 0.81–1.0 = almost perfect [38].
The level of agreement between children and their
parents was compared between categories of children’s
weight status in stratified analyses. We calculated kappa
CI’s for healthy-weight and overweight children and
compared these (Table 3).
Level of agreement between parent reports and child
reports in healthy-weight and overweight children.
We also explored whether children reported more,
less or the same amount of the health related behaviour as their parents. The parent-child dyads were
categorized into three categories: 1) children reporting the same frequency or duration of the health related behaviour as their parent; 2) children reporting
lower frequency or shorter duration of the health related behaviour than their parent (i.e., less hours or
days per week of TV/DVD viewing or outdoor play,
or less days on which they ate breakfast and participated in a family dinner); 3) children reporting
higher frequency or longer duration of the health related behaviour than their parent (i.e., children reported more hours or days per week of TV/DVD
viewing or outdoor play than parents, or more days
on which they ate breakfast and participated in a
family dinner). Children’s weight status and the
reporting categories were explored using multinomial
logistic regression analysis. First, crude analyses were
performed. Second, adjusted analyses were carried
out, controlling for potential confounding effects of
gender, SES and ethnicity, weight status and age of
the parent.
Results
Demographic variables and health behaviours
The study sample consisted of slightly more girls
than boys (Table 1). The majority of children were
of Dutch origin. Mean age of the children was 10.
6 years, ranging from 9 to 12 years. The parental
questionnaires were completed most often by the
mother (86.0%) and parents’ mean age was 41.7 years
(SD 4.7). Of the parents, 11% had a low level of
education, 21% a medium level of education and
68% a high level of education. In Table 2 the studied
behaviours as reported by children and parents are
presented.
The percentage of children reporting the same amount
of behaviour as their parents was lowest for frequency of
outside play (30.1%) and duration of TV/DVD viewing
(37.5%), and highest for breakfast consumption (95.1%)
and family dinner (71.3%). The percentage of children
Page 5 of 11
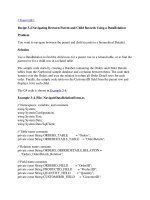
Table 1 Sociodemographic characteristics of the study
population
Total study sample
(N = 1998)
Mean age of the child – (SD)
10.6 (0.96)
Gender (% boys)
49.4%
Age of the respondent parent (years); mean (SD)
41.74 (4.70)
Relationship to child of respondent parent
Mother/female caregiver (%)
86.0
Socio-economic status (%)
Low
11.3
Middle
20.8
High
67.9
Ethnicity (%)
Non-Western background
10.1
Weight status child (%)
Thinness
9.0
Healthy weight
80.0
Overweight
9.6
Obesity
1.4
Weight status respondent parent (%)
Thinness
1.6
Healthy weight
66.9
Overweight
25.3
Obesity
6.2
reporting less than their parents was highest for the duration (44.5%) and frequency of TV/DVD viewing (33.3%)
and the duration of outside play (33.3%), and the percentage of children reporting more than their parents was
highest for frequency of outside play (53.5%).
We investigated differences by gender, ethnicity and
socioeconomic status (SES), and we found a statistically
significant difference between girls and boys for the frequency of outside play; compared to boys, girls more
often reported a greater frequency of outside play than
their parents. A statistically significant effect of SES was
found for the frequency of outside play; compared to
children of lower SES, children of high SES were more
likely to report a higher frequency of outside play than
their parents. For the variables frequency of breakfast
consumption and frequency of TV/DVD viewing we
found a different effect of SES, children of high SES
more often reporting the same frequency as their parents. We also found an effect of ethnicity, compared
with children of western ethnicity, children of nonwestern ethnicity were more likely to disagree with their
parents on the frequency of breakfast consumption, and
Koning et al. BMC Psychology (2018) 6:14
Page 6 of 11
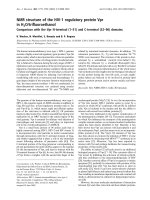
Table 2 Health behaviours as reported by children themselves
and as reported by their parents
Children (%)
Parents (%)
Health behaviours
N = 1998
N = 1998
Breakfast consumption: daily
95.7%
97.3%
5 days a school week
77.6%
85.2%
3-4 days a school week
17.3%
13.3%
0-2 days a school week
5.1%
1.7%
5 days a school week
48.7%
21.5%
3-4 days a school week
37.2%
48.9%
0-2 days a school week
14.0%
28.6%
48.2%
56.4%
5 days a school week
55.3%
70.9%
3-4 days a school week
26.1%
16.5%
0-2 days a school week
18.6%
12.6%
Television viewing, duration: > 2 h a day
7.4%
7.9%
Cycling
76.4%
76.7%
Walking
17.2%
18.1%
Other (by car, bus)
6.5%
5.2%
Family dinner
Outside play; frequency:
Outside play; duration: > 1 h per day
Television viewing, frequency:
Means of transportation to school
report either a higher or lower frequency of breakfast
consumption.
Level of agreement between parent proxy reports and
child-self reports
The Cohen’s kappa coefficients ranged from almost perfect agreement for the variable means of transportation
(0.82), fair for the variables breakfast consumption (0.33)
and frequency of outside play (0.21) to slight for the variables duration of outside play (0.19), frequency (0.19)
and duration of TV/DVD viewing (0.16), and family dinner (0.13) (Table 3).
Level of agreement between parent reports and child
reports in healthy-weight and overweight children
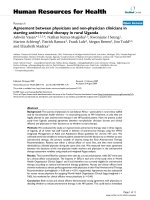
Kappa
Level of agreement was also explored by child weight
status. As can be seen in Table 3, the level of agreement
is not significantly different between children with or
without overweight. In four variables (frequency of outside play, means of transportation to school, frequency
and duration of TV/DVD viewing) the weighted kappa
was higher among healthy-weight children than in overweight children, though this was not statistically significantly different.
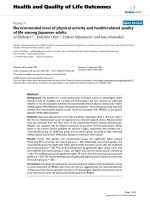
Logistic regression
Multinominal regression analyses were performed with
the reported behaviour categorized in three categories
(children reporting the same frequency or duration of
the health related behaviour as their parent, children
reporting lower frequency or shorter duration of the
health related behaviour than their parent, and children
reporting higher frequency or longer duration of the
health related behaviour than their parent) as the
dependent variable and weight status of the child dichotomized as overweight versus healthy-weight as the independent variable. After adjustment for gender, SES,
ethnicity, parental weight status, and parents age, overweight children had higher odds for reporting less frequent breakfast consumption than their parents (OR, 2.
6; 95% CI 1.3- 5.1), and for reporting lower frequency of
outside play than their parents (OR, 1.8; 95% CI 1.1-2.9).
Both these results were statistically significant (Table 4).
Discussion
In our study, children more often reported less (frequency or duration of ) healthy and unhealthy behaviours
than parents did, this especially is true for the variable
duration of TV/DVD viewing for which most children
(44.5%) reported less than their parents. An exception is
frequency of outside play for which most children reported more than their parents (53.5%). In other studies
Table 3 Kappa for the separate questionnaire items, stratified by weight status of the child
Child’s weight status
Total
Healthy Weight
Overweight
Health behaviour
Number of parent child dyads
Kappa (95% CI)
Kappa (95% CI)
Kappa (95% CI)
Breakfast consumption
1965
0.33 (0.21 – 0.45)
0.27 (0.15 – 0.40)
0.45 (0.22 – 0.66)
Family dinner
1965
0.13 (0.09 – 0.17)
0.11 (0.07 – 0.15)
0.24 (0.10 – 0.39)
Outside play; frequency
1930
0.21 (0.18 – 0.24)
0.21 (0.18 – 0.24)
0.19 (0.10 – 0.29)
Outside play; duration
1917
0.19 (0.16 – 0.22)
0.19 (0.15 – 0.22)
0.22 (0.14 – 0.31)
TV/DVD viewing; frequency
1930
0.19 (0.15 – 0.22)
0.19 (0.15 – 0.23)
0.15 (0.05 – 0.27)
TV/DVD viewing; duration
1930
0.16 (0.13 – 0.19)
0.16 (0.13 – 0.20)
0.10 (0.02 – 0.18)
Means of transportation to school
1930
0.82 (0.80 – 0.85)
0.83 (0.80 – 0.86)
0.76 (0.66 – 0.85)
1965
1917
Duration of outside play
Duration of TV/DVD viewing
1.3 (0.9–1.8)
0.9 (0.6–1.2)
1.0 (0.7–1.4)
1.7 (1.1–2.5)*
0.9 (0.6–1.4)
3.2 (1.8–5.7)**
OR (95%-CI)
1.2 (0.8–1.8)
0.8 (0.5–1.2)
0.9 (0.7–1.3)
1.0 (0.7–1.4)
0.8 (0.5–1.3)
1.1 (0.4– 3.3)
OR (95%-CI)
1.2 (0.8–1.7)
1.1 (0.7–1.7)
0.9 (0.6–1.5)
0.9 (0.6 – 1.3)
1.0 (0.7 – 1.4)
1.1 (0.7–1.5)
1.2 (0.8–1.8)
0.6 (0.3–1.1)
0.8 (0.3–2.5)
OR (95%-CI)
1.8 (1.1–2.9)*
0.7 (0.5–1.1)
2.6 (1.3- 5.1)*
OR (95%-CI)
Abbreviations: SES socioeconomic status, OR odds ratios, CI confidence interval
Healthy-weight children was set as reference group
P-values: * p < 0.05 for difference between healthy-weight children and overweight children; ** p < 0.001 for difference between healthy-weight children and overweight children
1930
1930
Frequency of TV/DVD viewing
Sedentary behaviours
1930
Frequency of outside play
Physical activity behaviours
1965
Family dinner
N
Breakfast consumption
Dietary behaviours
Reporting less than their
parent
Reporting more than their
parent
Adjusted for gender, SES and ethnicity, weight status and age of parent
Reporting less than their
parent
Reporting more than their
parent
Crude analyses, unadjusted
Table 4 Multinomial logistic regressions showing associations between weight status of the child and the child reporting more or less health related behaviour than their
parent
Koning et al. BMC Psychology (2018) 6:14
Page 7 of 11
Koning et al. BMC Psychology (2018) 6:14
children would report significantly more hours of sedentary activities than their parents, and also greater participation in physical activities [7] and higher intake of
sugar-sweetened beverages than their parents [33].
An explanation for the lower report of duration of
watching TV/DVD and the higher report of frequencies
of outside play of children may be that parents are not
always fully aware of their children’s activities during the
day and that parents and children may use different definitions/interpretations when filling in a survey. It may
also be difficult for children to accurately estimate a behaviour such as TV/DVD viewing, as the daily amount
may fluctuate more than is the case for other health
behaviours. Though parent proxy reports are believed to
be reasonably accurate if the reported behaviour of the
child takes place inside the home [15, 16], parental
obesity status and/or the extent to which parents perceive information about their child’s diet as a reflection
of their child’s weight may compromise reporting accuracy. It has also been suggested that a part of the inaccuracy of children’s or parents’ self-reports is deliberate and
might be due to social desirability [10]. In addition,
many parents underreport the weight status of their
children which may also reflect social desirability and
lack of awareness [40].
The present study also shows high percentages of
children and parents reporting the same behaviour for
both breakfast consumption and family dinner, although
the kappa scores are no more than fair. This discrepancy
in agreement may be accounted for by children and parents providing matching reports for breakfast consumption and the prevalences of the studied behaviours being
high (the prevalence of eating breakfast daily was 97.3%
and family dinner was 85.2% as reported by parents).
The kappa statistic is generally thought to be a more robust measure than simple percent agreement calculation,
since kappa takes into account the possibility of the
agreement occurring by chance [41]. Kappa is dependent
of the spread of agreement in categories, and sometimes
we see discrepancies occur because of this, because
while the percentage agreement is the same, the percentage agreement that would occur ‘by chance’ can be
higher because of high prevalences of the studied behaviour [42–44]. Therefore, kappa can still be relatively low
while, in percentages, most parents and children agree.
To our knowledge, agreement between children and
parents reports of dietary factors, such as breakfast consumption and having a family dinner together have not
been studied before. Studies that investigated the level of
agreement between child self-reports and parent-proxy
reports of fruit and vegetable consumption in Dutch
children showed slight to fair agreement [6, 17] . In our
study, we found slight to fair agreement for child and
parent reports of meal consumption. The agreement on
Page 8 of 11
the item of family dinner was significantly lower than
the agreement on the item of breakfast consumption
and it is difficult to find an explanation for this. Perhaps
the item of family dinner is more subjective than it
seems [45]: in the children’s questionnaire, we ask how
often the child eats at the dining table with his/her
parents, while in the parents’ questionnaire, the question
is aimed at the parent (how often do you eat dinner with
your child at the dining table?). It is possible that the
child mostly eats dinner together with the other (non-respondent) parent. Our results concerning reports of
meal consumption comply with other studies finding
low agreement between parent and child reports.
Our results concerning physical activity and sedentary
behaviour are in line with other research. In a study that
measured the level of agreement between parents’ and
children’s reports of watching television and engaging in
sports/outside activities fair agreement was also found
[46]. In addition, another study that determined the level
of agreement between parent and child reports of leisure
sports and television viewing, found slight agreement on
those items [7]. We found slight to fair agreement for
the variable outside play and slight agreement for the
variable TV/DVD viewing. There may be different reasons for these findings concerning the low agreement
for these behaviours. The perception of what outside
play exactly entails may differ between children and parents because outside play takes place outside the home.
Even though TV/DVD viewing takes place inside the
home and may be regulated by parents, many children
today have their own television in their bedroom and
their screentime behaviour may go unnoticed by parents.
For both outside play and TV/DVD viewing, children may
have some difficulties remembering and conceptualizing
both the frequency and duration of these behaviours.
Because of plausible explanations that children and
parents may both be more accurate reporters of children’s’ health behaviours, and that this accuracy may
vary for children and parents for different health behaviours, it is possible that in future studies using questionnaires regarding children’s health behaviours, both child
and parent reports will be explored [47] since we do not
have an objective measurement of the reported behaviours and we therefore cannot say anything about the
‘true’ behaviours. The question remains how to adequately address these different data sources, underlining the need for validation studies..
Healthy-weight and overweight children
Overweight children were significantly more likely than
healthy-weight children to report less frequent breakfast
consumption (OR, 2.6; 95% CI 1.3- 5.1), and lower frequency of outside play than their parents (OR, 1.8; 95% CI
1.1-2.9). Other studies found that even among children as
Koning et al. BMC Psychology (2018) 6:14
young as 9 years old, systematic underreporting of dietary
intake and over reporting of physical activity by overweight individuals may occur as a result of social desirability [22, 48–50]. Possibly it is not the children (with
overweight) but their parents who were more likely to give
social desirable answers [51]. We however did not find
that parents consistently reported more favorable scores.
Weight status of the child remains a source of influence
to consider when measuring certain health related behaviours with questionnaires.
Strengths and limitations of the study
The study is strengthened by the large amount of
parent-child dyads in the total sample, 1998 dyads were
eligible for the study which are enough dyads to perform
reasonable valid (kappa) analyses [52]. The high participation rates and the equal spread of participating
schools across one city in the Netherlands also added to
the strengths of this study. Furthermore, the weight status of children was obtained by trained students following a protocol, and the questionnaires of children and
parents and anthropometric measurements were completed within the same month, which means that both
children and parents reported about the same actual
behaviour.
Some limitations of our study can be identified. Even
though the participation rates were very high, children
from families with low and middle SES were underrepresented as was also the case in a previous study
using the data from previous ChecKid measurements,
implying possible selection bias [53]. Furthermore, we
investigated questionnaire items on schooldays only and
not on weekend days. It may be informative to compare
the levels of agreement between school and weekend
days as parents could be more aware of their children’s
behaviour during weekends. We grouped overweight
and obese children but we might have found different
agreements for these subgroups if we had been able to
separate the overweight and the obese children, as another study found lower agreement in the obese subgroups [7]. Another possible limitation is the arbitrary
cut-offs for the strengths of agreement [52], though the
kappa scores found in our study do not differ much
from other similar studies [6, 7, 17].
Conclusion
To date, population based surveys aimed at gaining
insight in health related behaviour of children have often
used either child self-reports or parent proxy reports to
measure these behaviours in children. However, it remains unclear if surveys using different sources of information from either parents or children are comparable.
There can be considerable disagreement between the
health related behaviours of children reported by parents
Page 9 of 11
or the children themselves and weight status of the child
may be a factor that can influence this agreement. In
addition, questionnaires are susceptible to subjectivity
and can be interpreted differently by parents and children. Since we do not have an objective measurement of
the reported behaviours and we therefore cannot say
anything about the ‘true’ behaviours, it is possible that in
future studies regarding children’s health behaviours
both child and parent reports will be investigated [44].
The question remains how to adequately address these
different data sources, underlining the need for validation studies. For future studies, social desirability and
recall bias would be best demonstrated in a validation
study comparing child and parent self-reports with more
objective measures of physical activity and food intake.
Additional file
Additional file 1: Questions questionnaire Checkid. Questions from the
ChecKid questionnaire. Questions used for this manuscript from the
parental and children’s ChecKid questionnaires. (DOCX 20 kb)
Abbreviations
BMI: Body mass index; CI: Confidence interval; OR: Odds ratios; SES: Socioeconomic status
Acknowledgements
We would like to thank our partners in this monitoring study: the Zwolle city
council, the municipal health services and several welfare organizations in
the city. We would also like to thank the schools, children and parents who
participated in this study, and acknowledge the help of all the students who
performed the anthropometric measurements.
Funding
We received no specific grant from any funding agency in public, commercial
or non-profit sectors. This study was funded by Windesheim University of
Applied Sciences, the VU University of Amsterdam and the municipal health
services in Zwolle. Windesheim University of Applied Sciences, the VU University
of Amsterdam and the municipal health services funded the design of the
study and the collection of data. The analysis and interpretation of the data and
the writing of the manuscript were funded by Windesheim University of
Applied Sciences.
Availability of data and materials
The datasets generated and analysed during the current study are not
publicly available due to agreements we have made concerning the
exchange and use of our data, but are available from the corresponding
author [MK] on reasonable request. These data are primary data acquired by
(one of) the authors.
Authors’ contributions
JCS, CMR and TLSV were responsible for the study design. JCS and CMR
supervised the data collection. MK was responsible for the statistical analyses
and interpretation of the data in agreement with AJ, TH, JCS, CMR, EdJ and
TLSV. MK wrote the first version of the manuscript and all authors
participated in the revisions of the manuscript. All authors read and
approved the final manuscript.
Ethics approval and consent to participate
The Medical Ethical Committee of the VU University Medical Centre in
Amsterdam has reviewed the research proposal for this study and declared
that this study does not fall within the ambit of the Medical Research
Involving Human Subjects Act (also known by its Dutch abbreviation “WMO”)
and, therefore, does not require further approval of an ethics review board.
The Medical Ethical Committee had no objection against the execution of
Koning et al. BMC Psychology (2018) 6:14
this research proposal and the consenting process of this study (MEC-2011411). From parents of all participating children and from children who were
12 years old or older at the time of data collection themselves, consent to
participation was obtained by an “opt-out” procedure. All individual
participants and parents of individual participants were informed and given
multiple opportunities to refuse participation or to end participation when
consent was already given. Registration number provided by the Medical
Ethical Committee of the VU University Medical Centre in Amsterdam:
2011/411 (March 8, 2012).
Consent for publication
Not applicable.
Competing interests
The authors declare that they have no competing interests.
Publisher’s Note
Springer Nature remains neutral with regard to jurisdictional claims in
published maps and institutional affiliations.
Author details
1
Research Centre Healthy Cities, Knowledge Centre for Health and Social
work, Windesheim University of Applied Sciences, PO box 10090, 8000 GB
Zwolle, the Netherlands. 2Department of Health Sciences, Vrije Universiteit,
Amsterdam, the Netherlands. 3Pedagogical Studies, Department for Health
and Social Work, Windesheim University of Applied Sciences, Zwolle, The
Netherlands.
Received: 3 May 2017 Accepted: 26 March 2018
References
1. Partnerschap Overgewicht Nederland: Zorgstandaard Obesitas. Amsterdam,
2010.
2. Romon M, et al. Downward trends in the prevalence of childhood
overweight in the setting of 12-year school- and community-based
programmes. Public Health Nutr. 2009;12(10):1735–42.
3. Borys JM, et al. EPODE approach for childhood obesity prevention:
methods, progress and international development. Obes Rev. 2012;13(4):
299–315.
4. Borys JM, et al. Tackling health inequities and reducing obesity
prevalence: the EPODE community-based approach. Ann Nutr
Metab. 2016;68(Suppl 2):35–8.
5. Livingstone MB, Robson PJ, Wallace JM. Issues in dietary intake assessment
of children and adolescents. Br J Nutr. 2004;92(Suppl 2):S213–22.
6. Reinaerts E, de Nooijer J, de Vries NK. Parental versus child reporting of fruit
and vegetable consumption. Int J Behav Nutr Phys Act. 2007;4:33.
7. Sithole F, Veugelers PJ. Parent and child reports of children's activity. Health
Rep. 2008;19(3):19–24.
8. Field AE, et al. Reproducibility and validity of a food frequency
questionnaire among fourth to seventh grade inner-city school children:
implications of age and day-to-day variation in dietary intake. Public Health
Nutr. 1999;2(3):293–300.
9. Burrows TL, Martin RJ, Collins CE. A systematic review of the validity of
dietary assessment methods in children when compared with the method
of doubly labeled water. J Am Diet Assoc. 2010;110(10):1501–10.
10. Livingstone M, Robson P. Measurement of dietary intake in children. Proc
Nutr Soc. 2000;59(02):279–93.
11. Trost SG. State of the art reviews: measurement of physical activity in
children and adolescents. Am J Lifestyle Med. 2007;1(4):299–314.
12. Lubans DR, et al. A systematic review of the validity and reliability of
sedentary behaviour measures used with children and adolescents. Obes
Rev. 2011;12(10):781–99.
13. Kohl Iii HW, Fulton JE, Caspersen CJ. Assessment of physical activity
among children and adolescents: a review and synthesis. Prev Med.
2000;31(2):S54–76.
14. de Bourdeaudhuij I, van Oost P. Personal and family determinants of dietary
behaviour in adolescents and their parents. Psychol Health. 2000;15:751–70.
15. Baranowski T, et al. Accuracy of maternal dietary recall for preschool
children. J Am Diet Assoc. 1991;91(6):669–74.
Page 10 of 11
16. Basch CE, et al. Validation of mothers’ reports of dietary intake by four to
seven year-old children. Am J Public Health. 1990;80(11):1314–7.
17. Tak N, et al. Parent and child reports of fruit and vegetable intakes and
related family environmental factors show low levels of agreement. J Hum
Nutr Diet. 2006;19(4):275–85.
18. Reichert FF, et al. Self-reporting versus parental reporting of physical activity
in adolescents: the 11-year follow-up of the 1993 Pelotas (Brazil) birth
cohort study. Cad Saude Publica. 2010;26(10):1921–7.
19. Collins C, Watson J, Burrows T. Measuring dietary intake in children and
adolescents in the context of overweight and obesity. Int J Obes. 2010;
34(7):1103–15.
20. Klesges LM, et al. Social desirability bias in self-reported dietary, physical
activity and weight concerns measures in 8- to 10-year-old AfricanAmerican girls: results from the girls health enrichment multisite studies
(GEMS). Prev Med. 2004;38, Supplement(0):78–87.
21. Magarey A, et al. Assessing dietary intake in children and adolescents:
considerations and recommendations for obesity research. Int J Pediatr
Obes. 2011;6(1):2–11.
22. McPherson RS, et al. Dietary assessment methods among school-aged
children: validity and reliability. Prev Med. 2000;31(2):S11–33.
23. Cullinan J, Cawley J. Parental misclassification of child overweight/obese
status: the role of parental education and parental weight status. Econ Hum
Biol. 2016;24:92–103.
24. Braet C, et al. Are two informants better than one? Parent-child agreement
on the eating styles of children who are overweight. Eur Eat Disord Rev.
2007;15(6):410–7.
25. Guidelines for Collecting Heights and Weights on Children and
Adolescents in School Settings. Center for Weight and Health, College
of Natural Resources, University of California, Berkeley, the United
States. Sept 2000.
26. Roodveldt R, Marks GC, Davies PS. Standard methods for the collection and
collation of anthropometric data in children. Canberra: Department of
Health and Aged Care; 2001.
27. Cole TJ, et al. Body mass index cut offs to define thinness in children and
adolescents: international survey. BMJ. 2007;335(7612):194.
28. Cole TJ, et al. Establishing a standard definition for child overweight and
obesity worldwide: international survey. BMJ. 2000;320(7244):1240–3.
29. WHO. Physical status: the use and interpretation of anthropometry. Geneva:
WHO; 1995. p. 1995.
30. de Onis M, Habicht JP. Anthropometric reference data for international use:
recommendations from a World Health Organization expert committee. Am
J Clin Nutr. 1996;64(4):650–8.
31. de Wilde JA, van Dommelen P, Middelkoop BJ. Appropriate body mass
index cut-offs to determine thinness, overweight and obesity in south Asian
children in the Netherlands. PLoS One. 2013;8(12):e82822.
32. Singh AS, et al. Design of the Dutch Obesity Intervention in Teenagers
(NRG-DOiT): systematic development, implementation and evaluation of a
school-based intervention aimed at the prevention of excessive weight gain
in adolescents. BMC Public Health. 2006;6:304.
33. De Vries S, Bakker I, van Overbeek K, de Boer N, Hopman-Rock M. Kinderen
in prioriteitswijken: lichamelijke (in)activiteit en overgewicht (children in
priority-neighbourhoods: physical (in)actvity and overweight). Leiden: TNO,
Quality of Life; 2005.
34. WHO, Global recommendations on physical activity for health. 2010.
35. de Jong E, et al. Association between TV viewing, computer use and
overweight, determinants and competing activities of screen time in 4- to
13-year-old children. Int J Obes. 2013;37(1):47–53.
36. Schmidt ME, et al. Systematic review of effective strategies for reducing screen
time among young children. Obesity (Silver Spring). 2012;20(7):1338–54.
37. Hildebrandt VH, C Bernaards, Stubbe JH, Trendrapport Bewegen en
Gezondheid 2010/2011. TNO 2013.
38. Landis JR, Koch GG. The measurement of observer agreement for
categorical data. Biometrics. 1977;33(1):159–74.
39. Cohen J. Weighted kappa: nominal scale agreement provision for scaled
disagreement or partial credit. Psychol Bull. 1968;70(4):213.
40. Lundahl A, Kidwell KM, Nelson TD. Parental underestimates of child weight:
a meta-analysis. Pediatrics. 2014;133(3):e689–703.
41. Gwet K. Inter-rater reliability: dependency on trait prevalence and marginal
homogeneity. Stat Methods Inter-Rater Reliab Assess Ser. 2002;2:1–9.
42. Brennan P, Silman A. Statistical methods for assessing observer variability in
clinical measures. BMJ. 1992;304(6840):1491–4.
Koning et al. BMC Psychology (2018) 6:14
Page 11 of 11
43. Cicchetti DV, Feinstein AR. High agreement but low kappa: II. Resolving the
paradoxes. J Clin Epidemiol. 1990;43(6):551–8.
44. Feinstein AR, Cicchetti DV. High agreement but low kappa .1. The problems
of 2 paradoxes. J Clin Epidemiol. 1990;43(6):543–9.
45. Whiteman D, Green A. Wherein lies the truth? Assessment of agreement
between parent proxy and child respondents. Int J Epidemiol. 1997;26(4):855–9.
46. Rah MJ, et al. Levels of agreement between parents’ and children’s reports
of near work. Ophthalmic Epidemiol. 2002;9(3):191–203.
47. Kraemer HC, et al. A new approach to integrating data from multiple
informants in psychiatric assessment and research: mixing and matching
contexts and perspectives. Am J Psychiatry. 2003;160(9):1566–77.
48. Johnson-Down L, et al. High prevalence of obesity in low income and
multiethnic schoolchildren: a diet and physical activity assessment. J Nutr.
1997;127(12):2310–5.
49. Fisher JO, et al. Influence of body composition on the accuracy of reported
energy intake in children. Obes Res. 2000;8(8):597–603.
50. McMurray RG, et al. Do overweight girls overreport physical activity? Am J
Health Behav. 2008;32(5):538–46.
51. de Bourdeaudhuij I. Personal and family determinants of dietary behaviour in
adolescents and their parents. Psychol Health. 2000;15:751–70.
52. Sim J, Wright CC. The kappa statistic in reliability studies: use, interpretation,
and sample size requirements. Phys Ther. 2005;85(3):257–68.
53. De Jong E, et al. Behavioural and socio-demographic characteristics of
Dutch neighbourhoods with high prevalence of childhood obesity. Int J
Pediatr Obes. 2011;6(3-4):298–305.
Submit your next manuscript to BioMed Central
and we will help you at every step:
• We accept pre-submission inquiries
• Our selector tool helps you to find the most relevant journal
• We provide round the clock customer support
• Convenient online submission
• Thorough peer review
• Inclusion in PubMed and all major indexing services
• Maximum visibility for your research
Submit your manuscript at
www.biomedcentral.com/submit