Parent-child proximity and personality: Basic human values and moving distance
Bạn đang xem bản rút gọn của tài liệu. Xem và tải ngay bản đầy đủ của tài liệu tại đây (1.49 MB, 12 trang )
Stieger and Lewetz BMC Psychology (2016) 4:26
DOI 10.1186/s40359-016-0132-5
RESEARCH ARTICLE
Open Access
Parent-child proximity and personality:
basic human values and moving distance
Stefan Stieger1,2* and David Lewetz1
Abstract
Background: An important event in many young people’s lives is moving out of the parental home. This event is
often operationalized as the distance between parents and their children, i.e., parent-child proximity.
Methods: The present study (N = 1,451) analyzed correlates of parent-child proximity through the lens of human
value theory (Schwartz, Advances in experimental social psychology, 1992). Besides a classical proximity measure (i.
e., parent-child), we also calculated the distance between childhood and current place of residence (i.e.,
childhood-now), as well as parent-childhood proximity (distance between children’s childhood place of residence
and the current place of residence of parents), which acts as a control group because this distance is most
probably chosen by the parents.
Results: As hypothesized, we found that participants valuing universalism and self-direction as important (i.e.,
associated with growth and anxiety-freedom) moved further away from the place where their parents live and the
place where they grew up than participants valuing self-protection and anxiety-avoidance (e.g., tradition, security,
conformity).
Conclusions: This study not only adds to research on psychological motivations to move, it endorses value theory
as being a useful lens through which to analyze migration behavior.
Keywords: Basic human values, Parent-child proximity, Value theory, Dominance analysis
Background
Migration – stimulated by globalization – is increasingly
emerging as an important sphere of societal and civic
interest. But moving from one place to another has always naturally occurred, typified by when children leave
their homes for work or to set up families of their own
[27]. This behavior has fallen under the umbrella topic
of parent-child proximity (e.g., [15, 19, 23, 39]).
Research about parent-child proximity has analyzed
sociocultural aspects, such as through an examination of
family bonds that are assumed to be tighter in southern
regions of Europe than northern regions (e.g., [29]).
Moreover, demographic aspects, such as sex, age, marital
status, education, or family size (for a discussion, see
[16]), as well as socioeconomic aspects such as financial
support through the family [39] and geographical
* Correspondence: ;
1
Department of Basic Psychological Research and Research Methods, School
of Psychology, University of Vienna, Vienna, Austria
2
Research Methods, Assessment, and iScience, Department of Psychology,
University of Konstanz, Konstanz, Germany
aspects such as the attractiveness of places [1], have all
been frequently studied. Besides these sociological,
demographic, economic, and environmental studies, psychological research has also examined determinants of
the decision to change one’s residence.
For example, Jokela et al. [18] analyzed temperament
traits (i.e., emotionality, sociability, and activity) in a
large prospective study in Finland. They found that more
(vs. less) sociable individuals had greater moving distances and were more likely to move to urban (vs. rural)
areas. Furthermore, individuals high (vs. low) in the temperament trait of emotionality had decreased moving
distance, but an increased likelihood of leaving the parental home. The Big Five personality traits have also
been analyzed in terms of moving behaviors. It has been
found that men (but not women) higher in neuroticism
and extraversion were more likely to move [35]. In short,
past research has found that moving decisions are not
only influenced by demographic aspects (e.g., education),
sociological aspects (e.g., family bonds), genetic
© 2016 Stieger and Lewetz. Open Access This article is distributed under the terms of the Creative Commons Attribution 4.0
International License ( which permits unrestricted use, distribution, and
reproduction in any medium, provided you give appropriate credit to the original author(s) and the source, provide a link to
the Creative Commons license, and indicate if changes were made. The Creative Commons Public Domain Dedication waiver
( applies to the data made available in this article, unless otherwise stated.
Stieger and Lewetz BMC Psychology (2016) 4:26
dispositions [8], and economic considerations (e.g., earnings), but also by psychological aspects such as temperament traits, personality, and affect [37].
But what is the motivation to move? Another potentially interesting lens that could guide moving behavior
is values. Values are considered as being guiding principles and motivations in human life, feeding our goals
[31]. Perhaps the most influential theory about values is
‘personal value theory’ [31], which proposes a widelyaccepted, fine-grained model of basic human values. The
level of detail of this model makes it ideal to analyses
motivations to move.
Basic human values
The concept of values has a long history (e.g., [14]) and,
largely because of its universal nature in relation to human behavior, has emerged as an important concept in
several scientific disciplines, such as psychology, sociology, business, management, and politics (e.g., [33]). In
particular, Schwartz [31] proposed a widely-accepted
model of basic human values based on 6 main features:
values are beliefs, values are desirable goals, values
Page 2 of 12
transcend specific actions and situations, values serve as
standards or criteria, values are ordered by importance,
and the relative importance of multiple values guides action (for a detailed description, see [34]). Based on these
main features, Schwartz described ten broad values that
he assumed to be universal across humans and cultures
[5, 13, 32]. These values can be described as a guiding
standard of human life, which are fundamentally important and a central part of identity. However, the values
are not independent from each other; rather, they have
dynamic relationships with each other and can be organized in a circular structure (circumplex model: [31]; see
also Fig. 1). Values close to each other regarding their
circular configuration share some congruency in their
underlying motivation, whereas values opposite to each
other are in conflict. For example, Hedonism is close to
Stimulation in the circular order, which is reflected by a
positive correlation, whereas Hedonism is opposite to
Humility in the circular model and is therefore negatively correlated with this value. Based on this view, further higher-order factors can be described on bipolar
dimensions that form a continuum of related
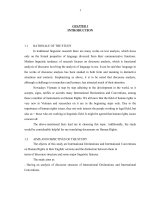
Fig. 1 Radial plot of the explained variance of all 19 values onto migration distance. Explained variance values in % from the dominance analysis.
Direction of the effects based on the sign of the Spearman correlation coefficient. Humility was excluded by setting the values to zero
Stieger and Lewetz BMC Psychology (2016) 4:26
motivations (e.g., self-transcendence vs. self-enhancement;
conservation vs. openness to change; see [34]). This structure has been confirmed in several cross-cultural studies
(e.g., [5]). It is important to note that it is assumed that
cultures do not differ in the structure of basic values rather than in the importance they attribute to the respective values. Meanwhile, an even more elaborate model has
been proposed by Schwartz, in which 19 different values
are differentiated ([34]; see also [9]).
In short, Schwartz’s [31] value theory attempts to explain human action on the same fundamental level as
personality theories (e.g., Big Five). Furthermore, human
values are multi-faceted, but can condensed to broad
basic motivations (e.g., growth vs. self-protection; see
Fig. 1, outer circles). This makes them ideal to analyze
moving behavior because moving itself is influenced by
many diverse decisions, not only sociocultural and socioeconomic needs, but also psychological ones, such as
certain personality constellations [42] or affect [37]. Furthermore, one main feature of basic human values is
that the relative importance of multiple values guides action, i.e., moving behavior is probably not guided by one
single value, but rather by the interplay of several values.
Research question
Data collection for the present study took place in
German-speaking countries of Europe, which represent
long-term politically stable, economically-developed societies with a high standard of living. Therefore, we can
expect that participants were generally motivated to
move by an optimistic outlook in life, rather than a pessimistic one as proposed by deficiency models [45]. Deficiency models postulate that a lack of personal and
social resources are the driving forces behind moving, at
least in countries with political and/or economic problems. This is also in line with results of Stieger et al.
[37], who found that parent-child proximity was associated with positive affect, where affect can be best described as a sort of basic mood, which in turn is the
breeding ground for emotions. Individuals with high
positive affect (i.e., enthusiastic, active, and attentive;
[44]) moved further away from their parents than individuals with low positive affect.
Research question 1: If value theory is a useful lens
through which to analyze migration behavior, then according to the deficiency model German-speaking participants should be generally motivated to move because
of an optimistic outlook in life. If this is the case, then
values associated with growth and anxiety-freedom
should be positively associated with parent-child proximity, whereas values associated with self-protection and
anxiety avoidance should be negatively correlated with
parent-child proximity.
Page 3 of 12
When it comes to basic human values, Tartakovsky and
Schwartz [38] attempted to integrate optimistic and pessimistic motives by suggesting a typology of potential motivations to move and related them to basic human values.
They postulated four different potential motivations, each
(except idealism, which was not assessed) expressed a set
of basic human values. The preservation motivation
(physical, social, and psychological security for oneself and
one’s family) is associated with the higher order value of
Conservation (Conformity, Tradition, and Security). Selfdevelopment (personal growth, acquiring new knowledge
and skills) is associated with the higher order value of
Openness to change (Self-direction, Stimulation, and Hedonism). Materialism (financial well-being, wealth, and
control over material resources) is associated with the
higher order value of Self-enhancement (Achievement,
Power). Finally, idealism (building a better society) is associated with the higher order value of Self-transcendence.
This typology is also relevant for the present study. For
example, individuals with high preservation motivations
(i.e., reflected by the values of Tradition, Security, and
Conformity) will be unlikely to move very far, as compared
with individuals with a low priority for preservation (for a
similar reasoning about identification with a nation, see
[30]). Similarly, traditions are socialized during childhood
and youth. Therefore, individuals who value tradition will
be unlikely to move very far away from their parents’ place
(or place of childhood), as compared with individuals who
do not foster traditions. The same rational applies to security: Individuals who value safety and stability in society
will be unlikely to move far away from the environment
they live in (e.g., place were they grew up or place were
their parents live), as compared with individuals who do
not value safety. Similar arguments can be applied to all
other values, as well as basic motivations formulated in
the typology of Tartakovsky and Schwartz [38].
Research question 2: If value theory is a useful lens
through which to analyze migration behavior, then according to the motivation typology of Tartakovsky and Schwartz
[38], German-speaking participants who move very far
away from their parents’ homes should be motivated by
personal growth and acquiring new knowledge and skills,
rather than physical, social, and psychological security for
oneself and one’s family. If this is the case, then we would
expect values associated with growth and anxiety-freedom
to be more important than values associated with selfprotection and anxiety-avoidance (see the three circular
areas in Fig. 1), the further someone moves away from his/
her familiar place of living (childhood, parents’ place).
Method
Power analysis
Research about moving behavior starts from the premise
that this behavior is multicausal. This is also reflected by
Stieger and Lewetz BMC Psychology (2016) 4:26
finding relatively weak effects and low explained variance values, because one study usually cannot address
all possible predictors (e.g., [21]: R2 ~ 13 %; [36]: R2 ~
2 %). One of the strongest predictors seems to be the
educational level (‘brain drain’ hypothesis; e.g., β ~ .30 in
[37]; see also [21]), but most significant predictors are of
relatively weak effect size. Therefore, we assumed we
would likewise find weak effects in the present study (r
= .1 according to [10]).
An as yet overlooked aspect regarding power is the reliability of the measures used. If measures are unreliable,
then power is also reduced (for a discussion, see [20]).
Therefore, we also accounted for lower measurement reliability. The lowest presented measurement reliability
presented in Schwartz et al. [34] was .63, which was
found for the Humility value. Based on this lowest measurement reliability value, we calculated a corrected lower
effect size of r = .079 as the basis for the power analysis
(for calculation details, see [17]; for a discussion, see
[6]). Because we were interested in the predictive value
of each single predictor and not all predictors together,
we chose the bivariate normal model for correlations instead of the linear multiple regression model. Based on
this analysis, the new minimum sample size to detect effects was N = 1,255.
Participants
The recruited sample size was larger than the one required, which should additionally benefit statistical
power (required: N = 1,255; recruited: N = 1,450). Participants (54 % women) were German-speaking volunteers
(Mage = 44.2 years, SD = 16.2; range 18 to 99 years) recruited by word-of-mouth through friends and relatives
of several research assistants, constituting a convenience
sample. We used six different age-strata (18 – 25, 26 –
30, 31 – 40, 41 – 50, 51 – 60, 61+) with the aim of an
equal number of participants in each strata in the final
sample by using a systematic sampling approach (i.e.,
first, strata are filled up by random sampling; if a strata
is full, then the remaining strata are filled up by systematic sampling). This ensured a broad range of participants who already had their own households (i.e., had
moved away from their parents’ home).
In terms of educational qualifications, 10 % had completed primary education, 32 % had an apprenticeship
diploma, 33 % had completed secondary education, and
25 % had a university degree. Participants’ current relationship status was: 16 % single, 26 % in a relationship,
51 % married, 4 % divorced, and 3 % widowed.
Materials
Portray value questionnaire-revised (PVQ-R)
The PVQ-R [34] is a 57-item measure to assess 19 different human values (see Fig. 1). Each item presents a
Page 4 of 12
fictitious person’s goals, aspirations, or wishes that point
to a particular value. Participants were asked to state
how strongly they identified with the particular portrayed person on a 6-point Likert-type scale (1 = not like
me at all, 2 = not like me, 3 = a little like me, 4 = somewhat like me, 5 = like me, 6 = very much like me). Internal consistencies were mostly acceptable for 3-item
scales (see Table 2; range .56 to .88) and comparable
with past research ([34]; range .63 to .85), except for the
value Humility, which was below .50 in our study (.476).
Therefore, we have excluded Humility from all further
analyses. Value scores were ipsatized prior to analysis,
i.e., participant’s mean score across all 57 items were
subtracted from the value score of each value item. This
follows standard procedure (e.g., [3, 31]) and is done in
order to control for individual response tendencies,
which could create random variability, and also because
it is the relative importance of a value compared to other
values that matters, rather than the importance of a
value per se.
Place of residence
Research on determinants or correlates of moving behavior
(e.g., sex, age, marital status, education, family size, attractiveness of places), operationalized as distance between two
residences (e.g., parent-child proximity), is characterized by
low explained variance values (e.g., [21]: R2 ~ 13 %; [37]: R2
~ 10 %, range of significant beta weights between .05 to
.31). This may be explained as a function of several issues.
First, moving is grounded in many (cultural, economic,
demographic) aspects and, therefore, will be unlikely to be
predicted by a single factor, but rather by many factors that
each explain a small amount of the variance. Second, the
measurement of distance between two places is not errorfree. For example, almost all studies using distances do not
use the real distance between two addresses (usually because of privacy concerns), but rather geographical positions of the center of postal code areas or municipalities.
Furthermore, there is some debate as to whether the real
distance (e.g., when driving on the road), the distance as
the crow flies (i.e., linear distance between two places), or
even travel time is the best operationalization of migration.
Third, people often live in several places. For example,
many students live in student halls near their homes and
some people have secondary residences for leisure or work
reasons (e.g., because of large commuting distances). Thus,
it is often difficult to clearly define a certain place (e.g., the
place ‘home’).
To keep the measurement of distances as error-free as
possible, we took the following considerations into account. First, we tried to assess the distance as accurately
as possible. Asking participants about their real address violates ethics standards concerning anonymity. Therefore,
we used the postal code area, which is not as precise as the
Stieger and Lewetz BMC Psychology (2016) 4:26
real address but more precise than, for example, the municipality. Second, we calculated three operationalizations of
distance: the real distance when driving on the road, the
distance as the crow flies, and the travel time. Third, when
measuring distances, there was the question of the geographical reference point. Past research has used several approaches, including the last residence, the place of birth
(e.g., [18, 43]), the place where the parents live (parent-child
proximity: e.g., [22]), and so forth. Therefore, we calculated
three different measures of distance:
(1)We used the current place of parental residence to
assess parent-child proximity, as has been done frequently in past research
(2)Because the distance between parents and their
(adult) children is also influenced by the moving
behavior of the parents after children have left the
home, we also assessed the place of childhood where
participants predominantly grew up (until ~ 10 years
of age) to calculate a childhood-now proximity. We
assumed that the decision to move was made by parents when children were young; after that, this decision is more often determined by the children
themselves as they age (e.g., getting a first job, raising their own family). Therefore, the childhood-now
proximity could be a more valid measure of moving
than the parent-child proximity. Furthermore, this
second measure of proximity enabled us to conduct
sensitivity analysis [28] to show whether the results
hold stable when using a slightly different measure.
(3)Finally, we calculated the parent-childhood proximity, which acts as a control condition. The children’s
childhood place of living is the place when the family was still young (i.e., parents live together with
their young children). This place was most probably
chosen by the parents. The current place of parents
was also chosen by the parents. Therefore, the
parent-childhood proximity should be largely independent from influences of parent’s children.
To calculate these distances, participants were asked
about their current place of residence (country, place, postal
code), which they would describe as ‘home’ following the
place attachment concept (i.e., emotional bond between a
person and a particular place; [1, 24]). Furthermore, participants were asked about their mothers’ and fathers’ current
(or if already deceased, the last) place of residence (country,
place, postal code) to calculate the current parent-child
proximity, as well as the place of childhood where participants predominantly grew up (until ~ 10 years of age).
Procedure
Participants gave their informed consent, completed the
PVQ-R along with several other measures that were not
Page 5 of 12
part of this study, and finally provided demographic details (age, sex, highest educational level, current relationship status, and places of residence). For the purposes of
anonymity, each questionnaire was put into an envelope
and thrown into a box. Furthermore, all participants
took part on a voluntary basis and were not remunerated
for participation.
Analysis of Distances
In European German-speaking countries, municipalities
(equivalent to US counties), are divided into several postal code areas. This comes with the advantage that postal
code areas are geographically more precise than the municipality itself. Although the exact postal address would
have been best for calculating the parent-child proximity
(but problematic because of anonymity and ethics reasons), using distances between the centers of postal code
areas seem to be a very good estimator of the real
distance.
We determined three measures of proximity using the
Google Geocoder API: the real distance between parents
and their (adult) child using roads, the distance as the
crow flies, and the journey time. The Google Geocoder
API comes with the advantage of allowing for checks on
postal codes and places for their validity. By applying a
multistage approach, we first checked postal codes and
places for their validity. Then, longitude and latitude coordinates were determined and proximities of two postal
code areas were calculated, again using the Geocoder
API. In the case of unclear postal codes or places, further information was used to clarify the issue (e.g., other
stated postal codes or participants’ demographic data). If
still unclear, postal codes and places were deleted for
data quality reasons.
The road distance and journey time were automatically estimated from the optimal route, which was
provided by the Google Geocoder API. All three measures have their advantages and disadvantages. The
journey time might be more familiar to everyday experience (see also [41]) but has the disadvantage that
journey time is also influenced by driving behavior
and chosen route. The road distance has more face
validity than the distance as the crow flies (e.g., in
mountainous regions). Nevertheless, all three measures were highly correlated (all Spearman rank-order
correlations rsp > .99); we, therefore, decided to use
the distance as the crow flies, which is common practice in research on proximity (e.g., [18, 37]).
Distances were highly skewed (skewness > 6.3). Therefore, following standard practices, we log-transformed all
distances (1 + log10) before further analyses (e.g., [18]).1
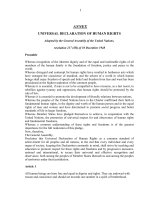
For a graphical overview of the distances between participants and their parents, see Fig. 2 (for ease of use, we
plotted only the postal codes of mothers).
Stieger and Lewetz BMC Psychology (2016) 4:26
Dominance analysis
Assessing a multicausal psychological phenomenon with
expected low effect sizes comes with several problems.
Using a multiple linear regression to assess the predictive value of several variables on the outcome measure
proceeds on the assumption that multicolinearity is either very low or absent. Multicolinearity is prevalent
when predictors share some variance (i.e., are intercorrelated). To control for multicolinearity, statistical packages calculate the so-called Variance Inflating Factors
(VIFs) to evaluate this problem.
In the present study, multicolinearity was a particular
problem for several reasons. First, the greater the number of predictor variables, the higher the probability of
intercorrelations and the more complex is their interplay. Second, in contrast to the Big Five personality
traits, the postulated 19 basic human values are assumed
to correlate with each other. The closer the values in the
circumplex circle (see Fig. 1), the higher their intercorrelations. Opposing values in the circumplex circle have
negative correlations. Therefore, multicolinearity is
Page 6 of 12
expected. Third, multicolinearity is even more of a problem when effect sizes are expectably low. Low VIFs suggest weak intercorrelations but weak intercorrelations
can have a substantial influence on estimating regression
coefficients when the expected effect size (i.e., regression
coefficient) is also low. Therefore, applying oftarticulated standards about acceptable VIFs (e.g., values
above 10 are problematic; for a discussion, see [26]) cannot be applied.
To account for all these aspects, we decided to conduct a dominance analysis [2, 7]. Dominance analyses
have the advantage of assessing the importance of each
predictor relative to the other predictors in the model.
This is done by looking at the contribution of a predictor in the linear model not only in conjunction with
the other predictors, but also in isolation. Practically, all
possible combinations of the predictor variables are used
to calculate partial, direct, and total effect parts by decomposing the total R2 (explained variance). The partial
effects are the contribution of all possible combinations
of predictors on the outcome measure by excluding either one or more predictors from the model. The direct
effect is the independent contribution without the other
predictors in the model (i.e., zero-order correlation with
the outcome measure). The total effect represents the
contribution when all predictors are included in the
model at once (i.e., the classical multiple linear regression). The outcome of the dominance analysis is composed of R2 values for each predictor representing the
real explained variance (i.e., adjusted for shared variances with other predictors). In the present study, dominance analyses were calculated using the R package
‘yhat’ [25].
Results
Descriptives
Fig. 2 Geographical distances between parents and their (adult)
children’s current place of residence, as well as distances between
(adult) children’s current place of residence and the place where
they grew up (i.e., place of childhood)
In 37 % of cases, participants lived in the same postal
code area as either their fathers, their mothers, or both
parents. Furthermore, in 70 % of cases, the postal code
of parents was identical (i.e., were probably still married
or still lived together). In general, participants’ postal
codes were widespread, resulting in 357 different postal
codes. For those who had moved, distances to fathers
were slightly smaller than to mothers (Mdmother =
38.4 km, Mdfather = 38.0 km). For further descriptives of
distances, see Table 1. For an overview of the geographical spread of all distances, see Fig. 2. Because fatherchild and mother-child proximities were highly correlated (rsp = .91, p < .001), we used mean distance scores
for further analyses (skewness = −0.5; SE = 0.07).
In 32 % of cases, the parents’ place of residence was
different from the (adult) children’s place of childhood,
i.e., parents moved away from the place where their
child grew up (see Fig. 2, third panel). This underlines
Stieger and Lewetz BMC Psychology (2016) 4:26
Page 7 of 12
Table 1 Descriptives of distances in kilometer
Proximity
Definition
n
Md
M
SD
min
max
Parent-child proximity
Distance between parents’ and their (adult) children’s
current place of residence.
1,364
8.9
153.7
597.7
0
9,825.0
Childhood-now proximity
Distance between participants’ place of childhood
and their current place of residence.
1,444
8.0
122.1
350.0
0
4,555.8
Parent-childhood proximity (control)
Distance between parents’ current place of
residence and their children’s place of childhood.
1,361
0.0
78.3
403.4
0
6,655.4
Distances are not log-transformed for descriptive purposes
our rational that using the parent’s current place of living might be not an optimal reference point of migration
behavior.
The sample represents classical moving behavior
within a particular culture (i.e., German-speaking European countries). The parents’ current place of residence
was outside this cultural region (i.e., participants immigrated) in only 4.9 % of cases. Furthermore, the participant’s place of childhood was not in the Germanspeaking cultural region in only 5.9 % of cases.
Dominance analysis
First, multiple linear regressions were calculated with all
participants (i.e., including those with distance 0) for power
reasons. For parent-child proximity and childhood-now
proximity, significant predictors were found with explained
variance values (R2) of 8.2 and 7.0 % respectively (see
Table 2). As hypothesized, the multiple linear regression for
parent-childhood proximity was not significant, with only
1.8 % explained variance. All VIFs, which are indicators of
multicolinearity, were < 4. Following current practices, VIFs
higher than 10 are regarded as problematic. As outlined
above, this depends on the expected effect size (i.e., beta
weights). The lower the expected effect size, the more a low
VIF level should be regarded as problematic. In the current
case, the impact of multicolinearity on the beta-weights
could also be tested by calculating Spearman rank-order
correlations between dominance weights (which should be
true values adjusted for intercorrelations) and the absolute
values of beta weights. If there is no multicolinearity, then
the order ranks of dominance weights should resemble the
order ranks of beta weights resulting in a perfect rankorder correlation of 1. The more the rank-order correlation
deviates from this perfect correlation, the more likely it is
that multicolinearity is a limiting factor. In fact, all three
rank-order correlations were below 1 (parent-child proximity: rsp = .54, p = .01; childhood-now proximity: rsp = .51, p
= .02; parent-childhood proximity: rsp = .80, p < .001).
Therefore, the dominance weights should be given preference over beta weights.
As expected, demographic variables, such as participant’s
sex, age, and highest educational level, explained large
amounts of the overall variance (3.8 % and 3.0 % respectively), but only for the parent-child and childhood-now
proximity (parent-childhood proximity: 0.4 %). Women
moved farther away from their parents and their place of
childhood than men (distance to parents: Mdmen = 33.2 km,
Mdwomen = 42.1 km; distance to childhood place: Mdmen =
34.7 km, Mwomen = 42.5 km). Furthermore, the higher the
educational level, the higher was the proximity to parents
and childhood place (average ΔMd gain of 25.3 km and
21.0 km, respectively, for each educational level). Education
was the strongest predictor in line with past research (see
also [21]).
Interestingly, the relative importance of basic human
values explained a similar amount of variance in the outcome measure as compared with demographics. The sum
of all dominance weights from all 19 values explained 4.2 %
for parent-child proximity and 4.0 % for childhood-now
proximity (parent-childhood proximity: 1.4 %). More specifically, the farther the distance the lower was the importance for values associated with the higher order value of
Conservation (e.g., Security-social, Tradition, Conformityrules), but the greater was the importance for values of
the higher order value of Self-transcendence (e.g.,
Universalism-concern, Universalism-tolerance) and Openness to change (e.g., Self-direction). This is in line with the
assumption that values opposite to each other in the circumplex model (see Fig. 1) should be antagonistic, e.g.,
the higher the importance of growth values, the lower
should be the importance of self-protection values.
Figure 1 shows the circular structure of all 19 basic human values together with the higher order values in the
outer circles. Values represent the dominance weights (see
Table 2) and the direction of the dominance weights is
based on the sign of the zero-order Spearman rank-order
correlation. Furthermore, Fig. 1 shows centroids, which are
the mean of the respective x and y values. These centroids
have to be interpreted with caution because the circumplex
structure of basic human values does not imply that all intervals are equal (i.e., values all of the same circular distance
to the neighboring values in the circle; [34]). Nevertheless,
we were not interested in the exact position of the centroid,
but rather the direction of the centroid from the center.
As can be seen in Fig. 1, the line of the reference category
(i.e., parent-childhood proximity) only shows minor deviations from the null-line, which results in a centroid that is
almost exactly presented in the middle of the circle.
Stieger and Lewetz BMC Psychology (2016) 4:26
Page 8 of 12
Table 2 Predictors of parent-child, childhood-now, and parent-childhood proximity
Parent-child proximity
Dominance % β
rsp
Childhood-now proximity
Parent-childhood proximity
(control)
Dominance % β
Dominance %
β
rsp
−.016 −.090a 0.25
−.041
−.071
0.65
.082a
.082a
<0.01
.003
.004
a
a
.024
.058
rsp
Demographics
Age
0.23
Sex
0.90
Education
Human values (PVQ-R)
−.022 −.098a 0.14
a
.102
a
a
.088
a
2.70
.161
.232
2.18
.141
.219
0.12
Cronbach α
Achievement
.668
0.06
.018
.037
0.07
.033
.029
0.06
.019
.026
Benevolence-caring
.732
0.05
.021
.030
0.17
.053
.047
0.02
−.003
.027
Benevolence-dependability
.693
0.09
−.037 −.008
0.10
−.039 −.004
0.01
−.007
.018
Conformity-interpersonal
.650
0.02
.010
0.17
.055
0.03
.005
.015
.008
.030
Conformity-rules
.880
0.92
−.079 −.163
0.68
−.062 −.132
0.05
−.022
−.040
Face
.647
0.10
.049
−.014
0.08
.046
−.010
0.19
−.046
−.049
Hedonism
.772
0.04
.003
.035
0.19
−.035 −.010
0.01
−.018
.022
Humility
.476 b
a
a
Power-dominance
.704
0.11
−.046 −.011
0.03
−.004 .012
0.03
−.030
−.011
Power-resources
.801
0.09
.051
0.09
.056
0.02
.007
.003
a
Self-direction-autonomy of action
.008
a
0.21
.040
.092
0.01
−.005
.025
0.27
.019
.120a
0.03
−.023
.044
.003
−.094
0.30
−.050
−.073
−.008 −.147a 0.13
−.020
−.065
.566
0.10
.010
Self-direction-autonomy of thought .558
0.24
−.002 .118a
.082
Security-personal
.778
0.16
−.008 −.095
Security-societal
.795
0.51
−.018 −.147a 0.44
a
a
.577
0.18
.021
Tradition
.855
0.37
−.025 −.115a 0.38
Universalism-concern
.761
0.39
.044
.099a
0.33
Universalism-nature
.858
0.18
.050
.035
0.09
.736
0.60
.063
.111
0.14
Stimulation
Universalism-tolerance
.013
a
.118
0.06
0.50
.006
a
a
.009
.044
−.020 −.115a 0.02
<.001
−.028
.044
.100a
0.19
.037
.062
.043
.013
0.06
−.036
−.014
0.19
.021
.071
.064
.090
a
.106
0.07
F(21,1341) = 5.67,
F(21,1422) = 5.12,
F(21,1338) = 1.17,
p < .001; R2 = 8.2 %
p < .001; R2 = 7.0 %
p = .272; R2 = 1.8 %
Coding of Sex: 1 = men; 2 = women. rsp = Spearman rank-order correlation. significant after correction for false discovery rates due to multiple testing [4].b Due to
the low reliablity, Humility was excluded from all analyses
a
Centroids for parent-child as well as childhood-now deviate
from the center away from the higher order value of Conservation towards the higher order value of Openness to
change. Interpreted more globally, both centroids head towards the higher order value of growth and anxietyfreedom away from self-protection and anxiety-avoidance
(see Fig. 1). This effect is mainly driven by the lower importance of the self-protection values (Conformity-rules,
Tradition, and Security-social). Furthermore, the lines for
parent-child and childhood-now proximity have a very
similar line structure, with only one descriptively larger deviation at the Hedonism value. This speaks to the robustness of the results found for parent-child proximity [28].
Discussion
The present sample was from German-speaking countries of Europe with a relatively high standard of living.
Therefore, we expected that people would be motivated
by values associated with growth and anxiety-freedom,
rather than self-protection and anxiety-avoidance because the study took place in politically stable,
economically-developed countries with a high standard
of living where people are generally motivated by an optimistic outlook in life, rather than a pessimistic one
(e.g., deficiency model, see [45]). This is what we found
in the present work. More precisely, participants who
preferred universalism (e.g., commitment to equality,
justice, and protection of people) and self-direction
values (e.g., freedom to follow one’s ideas and determine
one’s own actions), but at the same time showed a lower
preference for conformity, tradition, and security values,
moved further away than participants with opposite
preferences. This pattern was stable across different
proximity measures – the distance between participants’
Stieger and Lewetz BMC Psychology (2016) 4:26
and their parents’ current place of living (i.e., parentchild proximity), as well as the distance between participants’ current place of living and their place of childhood (i.e., place where they grew up: childhood-now
proximity). Although we argued that the second distance
should be considered more valid than the classical parentchild proximity because not confounded by the moving behavior of parents, both distances basically showed the same
pattern. This not only speaks to the robustness of our results, but suggests that the moving behavior of parents is
probably unsystematic, i.e., parents do not seem to systematically move towards or away from their children. This is
underlined by the similar median distances of parent-child
proximity and childhood-now proximity (38.3 vs. 38.9; see
Table 1).
Regarding the typology of potential motivations to move
[38], participants in the present study were motivated by
the general motives of self-development (personal growth,
acquiring new knowledge and skills) and idealism (building
a better world). On the contrary, participants who were instead motivated by preservation motivations (physical, social, and psychological security for oneself and one’s family)
moved less further away from their parents’ home. Interestingly, materialism (financial well-being, wealth, and control
over material resources) did not seem to have an influence
on the motivation to move. This also seems reasonable because all German-speaking countries generally have a high
standard of living.
In the current study, we also showed that expected
weak effects could be assessed with enough statistical
power to finally reveal an expected pattern. The overall
explained variance was small (~8 %) because of the
multi-causal nature of moving behavior, but still in line
with past research [21, 37]. If we compare the predictive
value of demographics and human values, both parts explained similar R2 values. Because human values outperformed education as a known strong predictor of
moving and moving distance (4.2 vs. 2.7 % and 4.0 vs.
2.2 %, respectively), this speaks to the meaningfulness of
measuring basic human values in the context of moving
behavior (see also [38, 42]).
Methodological considerations
To quantify the influence of several predictors on an
outcome measure, multiple linear regressions are usually
calculated. In the present study, we showed that, when
small effects are expected, many predictors are included
in the model, and multicolinearity is probable, a dominance analysis is superior. The dominance analysis has
the further advantage of giving more weight to the
values itself, rather than significance levels. This is an
oft-stipulated requirement to improve replicability and
reproducibility of psychological research [11, 12].
Page 9 of 12
Furthermore, we wish to discuss the validity of the
new 19-value segmentation of basic human values,
which was recently introduced by Schwartz et al. [34].
This new segmentation has two new values (Humility,
Face) and six values are now more differentiated (Universalism, Benevolence, Conformity, Security, Power,
and Self-direction) compared to the old model [31]. Vecchione et al. [42] have already shown that, at least for
the security value, the segmentation into ‘Security-personal’ and ‘Security-social’ is meaningful. In the current
study, we found the strongest support for the new segmentation for the Conformity value. People who moved
further away from their parents or childhood place
judged the importance of complying with rules, laws,
and formal obligations (i.e., reflected in the Conformityrules value) as less important than people who stayed rather close to their parents and childhood place. However, this pattern was not found for the Conformityinterpersonal value. The moving distance was not substantially associated with avoiding behaviors that could
upset or harm other people. Therefore, our results
present additional support for the validity of the new 19
value segmentation.
Limitations
Although values are considered to be relatively stable
over time, past research has found that values do change
occasionally, and that these changes are systematic and
meaningful (e.g., [3]). Therefore, in the present study, we
cannot infer whether a certain constellation of valueimportance is the cause or the consequence of a larger
distance between parents and (adult) children. It could
also be that the uncovered constellation is the result of
fitting into a new life situation after moving to a new
place by adjusting to the new life situation (e.g., [40]).
Nevertheless, we do think that value preference changes
due to changing one’s residence are probably not that
substantial in the present study.
The moving behavior observed almost entirely
reflected migration within the same cultural area. Participants did not have to adjust their values system as
much as, for example, individuals moving to a different
culture with a different language, customs, traditions, or
religion. Furthermore, because values are usually relatively stable over time (i.e., rather traits than states), it
seems plausible that some values become more important or less important, but this change is not so strong as
to result in a switch of value preferences to reluctance.
Although we cannot entirely settle this issue with the
current study because of the cross-sectional design, future research would profit from conducting longitudinal
studies about motivations to move.
Although the power of the study design was large
enough to detect even small effect sizes reliably, one
Stieger and Lewetz BMC Psychology (2016) 4:26
might argue that the reported pattern (see Fig. 1) in fact
reflects measurement error. We tried to address this
problem by introducing a third proximity measure that
should have no connection with participants’ motivation
to migrate. We chose the distance between participants’
place of childhood and their parents’ current place of
residence (i.e., parent-childhood proximity). This distance should only reflect motivations to move of participants’ parents and not of participants themselves.
Indeed, the regression model was not significant, cumulated dominance weights of all human values were low
(1.4 %), and the centroid in the circular model (see Fig. 1)
was almost exactly in the middle of the circle.
The present study also had a number of methodological limitations. Most importantly, the subscales of
the used PVQ-R have only 3 items each. This leads to
higher fluctuations in reliability estimates, which was
also found in the present study. For some subscales, the
reliability was unacceptably low from a methodological
point of view (e.g., Humility), although in line with the
original publication of the PVQ-19 [34]. Nevertheless,
future research could advance the PVQ-R by including
further items for each value to substantially raise reliability or at least revise the items of the Humility subscale.
Because the operationalization of distance was established as the distance between postal code areas (due to
privacy issues), quite a few participants had distance = 0.
This does not necessarily mean that these participants still
live with their parents; it only means that participants and
their parents share the same postal code area. To account
for this, we calculated the regression analyses again by excluding participants with distance = 0. Results only slightly
changed, probably due to the lower number of participants (parent-child proximity and childhood-now proximity: regression models still significant with nearly equal
explained variances: 7.8 and 7.9 % respectively; control
group parent-childhood proximity: model still not significant; explained variance increased to 5.0 %). Due to power
considerations, participants with distance = 0 remained in
all analyses.
Future directions
Future studies would profit from applying a longitudinal
design to disentangle motivational causes and consequence of moving behavior. Furthermore, it would be of
interest to examine whether the found pattern is also be
found in different cultures. This would not only add to
the generalizability of the effect in other countries, it
would also add to the theory about the motivations to
(e)migrate. As we have outlined in the Introduction, in
industrialized countries people are motivated more by
optimistic goals (e.g., individual growth, achievement),
whereas in countries with political and/or economic
problems, people are motivated more by pessimistic
Page 10 of 12
goals (e.g., fear reduction, raise personal security; [45]).
If this holds true, then we would expect the centroid
from Fig. 1 being in the lower part of the circular model
for countries with political turmoil or economic
upheavals.
Another interesting point for future research is of a
methodological nature. In the current study, we were
not only interested in the distance itself, but also the direction of moving might be of value. For example, do
parents move towards their children or away from their
children, and to what extent? Geographically speaking,
what is the angle between the childhood-now proximity
line and the parent-childhood proximity line? If this
angle is sharp, then parents did move towards their
(adult) children’s current place of living. The more obtuse this angle, the less close parents moved towards
their children. If this angle is larger than 90°, then parents moved away from their children, and so forth. This
additional measure would complement the classical
proximity measure, and could add to the understanding
of psychological underpinnings of moving behavior.
Further potential predictors of parent-child proximity,
which were not analyzed here, would also be of interest.
For example the emotional attachment to parents or in
general the rearing behavior of parents could have an influence on the parent-child proximity.
Ethics approval and consent to participate
The present study was conducted in accordance with the
principles of the Declaration of Helsinki and with institutional guidelines of the School of Psychology, University
of Vienna. Furthermore, the present study followed the
Guidelines for ethical conduct of behavioral projects involving human participants proposed by the American
Psychological Association. According to the institutional
guidelines of the University of Vienna, Austria
( approval by an ethics committee
was not necessary because the study did not affect
the physical or psychological integrity, the right for
privacy, or other personal rights or interests (see
§2(1)). All participants gave verbal informed consent
after having received a written description of the
study and could withdraw participation at any point.
Data collection was anonymous and no harmful procedures were used.
Consent for publication
Not applicable.
Availability of data and materials
Because we do not have the consent from the participants
to make the data publicly available through open access
repositories, the dataset supporting the conclusions of this
Stieger and Lewetz BMC Psychology (2016) 4:26
article is only available from the first author on demand.
All relevant materials can be accessed via the Open Science Framework platform ( />
Endnotes
1
We also applied a different transformation called
Rankit, which is also applicable for this type of data. Because log-transformations and Rankit transformations
were highly correlated (Pearson correlation r > .92), we
kept the log-transformation because it is predominantly
used in the literature on parent-child proximity.
Competing interests
The authors declare that they have no competing interest concerning
submission of the manuscript “Parent-child proximity and personality: Basic
human values and moving distance” to the Journal “BMC Psychology.”
Authors' contributions
SS designed the study and wrote the manuscript. DL developed software to
analyze the distance data and commented on the manuscript. Both authors
contributed to the analysis, read and approved the final manuscript.
Acknowledgements
The authors thank Viren Swami for his useful comments of the present
paper.
Funding
None.
Received: 16 March 2016 Accepted: 4 May 2016
References
1. Altman I, Low SM. Place attachment. New York: Plenum; 1992.
2. Azen R, Budescu DV. The dominance analysis approach for comparing
predictors in multiple regression. Psychol Methods. 2003;8:129–48.
3. Bardi A, Lee JA, Hofmann-Towfigh N, Soutar G. The structure of
intraindividual value change. J Pers Soc Psychol. 2009;97:913–29. doi:10.
1037/a0016617.
4. Benjamini Y, Hochberg Y. Controlling the false discovery rate: a practical
and powerful approach to multiple testing. J R Stat Soc Series B. 1995;57:
289–300.
5. Bilsky W, Janik M, Schwartz SH. The structural organization of human valuesevidence from three rounds of the European Social Survey (ESS). J CrossCult Psychol. 2011;42:759–76. doi:10.1177/0022022110362757.
6. Bobko P, Roth PL, Bobko C. Correcting the effect size of d for range
restriction and unreliability. Organ Res Methods. 2001;4:43–61.
7. Budescu DV. Dominance analysis: a new approach to the problem of
relative importance of predictors in multiple regression. Psychol Bull. 1993;
114:542–51.
8. Chen C, Burton M, Greenberger E, Dmitrieva J. Population migration and
the variation of dopamine D4 receptor (DRD4) allele frequencies around the
globe. Evol Hum Behav. 1999;20:309–24.
9. Cieciuch J, Schwartz SH. The number of distinct basic values and their
structure assessed by PVQ-40. J Pers Assess. 2012;94:321–8. doi:10.1080/
00223891.2012.655817.
10. Cohen J. Statistical power analysis for the behavioral sciences. 2nd ed. New
Jersey: Lawrence Erlbaum; 1988.
11. Cumming G. Replication and p intervals: p values predict the future only
vaguely, but confidence intervals do much better. Perspect Psychol Sci.
2008;3:286–300. doi:10.1111/j.1745-6924.2008.00079.x.
12. Cumming G. The new statistics: Why and how. Psychol Sci. 2014;25:7–29.
doi:10.1177/0956797613504966.
13. Davidov E, Schmidt P, Schwartz SH. Bringing values back in. The adequacy
of the European Social Survey to measure values in 20 countries. Public
Opin Q. 2008;72:420–45. doi:10.1093/poq/nfn035.
14. Durkheim E. Suicide. Glencoe: Free Press; 1964.
Page 11 of 12
15. Ha JH, Carr D. The effect of parent-child geographic proximity on widowed
parents’ psychological adjustment and social integration. Res Aging. 2005;
27:578–610. doi:10.1177/0164027505277977.
16. Hank K. Proximity and contacts between older parents and their children: a
European comparison. J Marriage Fam. 2007;69:157–73. doi:10.1111/j.17413737.2006.00351.x.
17. Hunter J, Schmidt F. Methods of meta-analysis: correcting error and bias in
research findings. Newbury Park: Sage; 1990.
18. Jokela M, Elovainio M, Kivimaki M, Keltikangas-Jarvinen L. Temperament and
migration patterns in Finland. Psychol Sci. 2008;19:831–7. doi:10.1111/j.14679280.2008.02164.x.
19. Lawton L, Silverstein M, Bengtson V. Affection, social contact, and
geographic distance between adult children and their parents. J Marriage
Fam. 1994;56:57–68.
20. LeBel EP, Paunonen SV. Sexy but often unreliable: the impact of unreliability
on the replicability of experimental findings with implicit measures. Pers
Soc Psychol Bull. 2011;37:570–83. doi:10.1177/0146167211400619.
21. Leopold T, Geißler F, Pink S. How far do children move? spatial distances
after leaving the parental home. Soc Sci Res. 2012;41:991–1002. doi:10.1016/
j.ssresearch.2012.03.004.
22. Michielin F, Mulder CH. Geographical distances between adult children and
their parents in the Netherlands. Demogr Res. 2007;17:655–78. doi:10.4054/
DemRes.2007.17.22.
23. Mulder CH. The family context and residential choice: a challenge for new
research. Popul Space Place. 2007;13:265–78. doi:10.1002/psp.456.
24. Nielsen-Pincus M, Hall T, Force JE, Wulfhorst JD. Sociodemographic effects
on place bonding. J Environ Psychol. 2010;30:443–54. doi:10.1016/j.jenvp.
2010.01.007.
25. Nimon K, Oswald FL. Understanding the results of multiple linear regression:
beyond standardized regression coefficients. Organ Res Methods. 2013;16:
650–74. doi:10.1177/1094428113493929.
26. O’Brien RM. A caution regarding rules of thumb for variance inflation
factors. Qual Quant. 2007;41:673–90. doi:10.1007/s11135-006-9018-6.
27. Oishi S. The psychology of residential mobility: implications for the self,
social relationships, and well-being. Perspect Psychol Sci. 2010;5:5–21. doi:
10.1177/1745691609356781.
28. Rasmussen AW, Stratton LS. How distance to a non-residential parent
relates to child outcomes, IZA Discussion Paper No. 6965; 2012. 2012.
Available at SSRN: = 2170653.
29. Reher DS. Family ties in western Europe: persistent contrasts. Popul Dev
Rev. 1998;24:203–34. doi:10.2307/2807972.
30. Roccas S, Schwartz SH, Amit A. Personal value priorities and national
identification. Pol Psychol. 2010;31:393–419. doi:10.1111/j.1467-9221.2010.
00763.x.
31. Schwartz SH. Universals in the content and structure of values: theory and
empirical tests in 20 countries. In: Zanna M, editor. Advances in
experimental social psychology. New York: Academic; 1992. p. 1–65.
32. Schwartz SH. Value orientations: measurement, antecedents and
consequences across nations. In: Jowell R, Roberts C, Fitzgerald R, Eva G,
editors. Measuring attitudes cross-nationally - lessons from the European
social survey. London: Sage; 2006. p. 169–203.
33. Schwartz SH, Caprara GV, Vecchione M. Basic personal values, core political
values, and voting: a longitudinal analysis. Pol Psychol. 2010;31:421–52. doi:
10.1111/j.1467-9221.2010.00764.x.
34. Schwartz SH, Cieciuch J, Vecchione M, Davidov E, Fischer R, …, Konty M.
Refining the theory of basic individual values. J Pers Soc Psychol. 2012;103:
663–88. doi:10.1037/a0029393.
35. Silventoinen K, Hammar N, Hedlund E, Koskenvuo M, Rönnemaa T, Kaprio J.
Selective international migration by social position, health behavior and
personality. Eur J Pub Health. 2008;18:150–5. doi:10.1093/eurpub/ckm052.
36. Shapiro A. Later-life divorce and parent-adult child contact and proximity: a
longitudinal analysis. J Fam Issues. 2003;24:264–85.
37. Stieger S, Voracek M, Nader IW. Parent–child proximity: automatic
cognitions matter. Soc Indic Res. 2014;119:967–78. doi:10.1007/s11205013-0524-3.
38. Tartakovsky E, Schwartz SH. Motivation for emigration, values, wellbeing,
and identification among young Russian Jews. Int J Psychol. 2001;36:88–99.
doi:10.1080/00207590042000100.
39. Tomassini C, Wolf DA, Rosina A. Parental housing assistance and
parent–child proximity in Italy. J Marriage Fam. 2003;65:700–15. doi:10.
1111/j.1741-3737.2003.00700.x.
Stieger and Lewetz BMC Psychology (2016) 4:26
Page 12 of 12
40. Vaidya JG, Gray EK, Haig JR, Mroczek DK, Watson D. Differential stability and
individual growth trajectories of Big five and affective traits during young
adulthood. J Pers. 2008;76:267–304. doi:10.1111/j.1467-6494.2007.00486.x.
41. van Diepen AML, Mulder CH. Distance to family members and
relocations of older adults. J Housing Built Environ. 2009;24:31–46. doi:
10.1007/s10901-008-9130-0.
42. Vecchione M, Caprara G, Schoen H, Castro JLG, Schwartz SH. The role of
personal values and basic traits in perceptions of the consequences of
immigration: a three-nation study. Br J Psychol. 2012;103:359–77. doi:10.
1111/j.2044-8295.2011.02079.x.
43. Voracek M, Alge N, Stieger S. Heterosis versus inbreeding depression effects:
an investigation of personality, digit ratio (2D:4D), and laterality traits. Mank
Q. 2011;52:191–212.
44. Watson D, Clark LA, Tellegen A. Development and validation of brief
measures of positive and negative affect: The PANAS scales. J Pers Soc
Psychol. 1988;54:1063–70. doi:10.1037/0022-3514.54.6.1063.
45. Winter-Ebmer R. Motivation for migration and economic success. J Econ
Psychol. 1994;15:269–84.
Submit your next manuscript to BioMed Central
and we will help you at every step:
• We accept pre-submission inquiries
• Our selector tool helps you to find the most relevant journal
• We provide round the clock customer support
• Convenient online submission
• Thorough peer review
• Inclusion in PubMed and all major indexing services
• Maximum visibility for your research
Submit your manuscript at
www.biomedcentral.com/submit