Accounting undergraduate Honors theses: The arms race in college athletics - Facility spending and its relationship to college athletics and university communities
Bạn đang xem bản rút gọn của tài liệu. Xem và tải ngay bản đầy đủ của tài liệu tại đây (748.88 KB, 37 trang )
University of Arkansas, Fayetteville
ScholarWorks@UARK
Accounting Undergraduate Honors Theses
Accounting
5-2014
The arms race in College Athletics:facility spending
and its relationship to College Athletics and
University Communities
Haley Roane Prewett
University of Arkansas, Fayetteville
Follow this and additional works at: />Part of the Business Administration, Management, and Operations Commons
Recommended Citation
Prewett, Haley Roane, "The arms race in College Athletics:facility spending and its relationship to College Athletics and University
Communities" (2014). Accounting Undergraduate Honors Theses. 7.
/>
This Thesis is brought to you for free and open access by the Accounting at ScholarWorks@UARK. It has been accepted for inclusion in Accounting
Undergraduate Honors Theses by an authorized administrator of ScholarWorks@UARK. For more information, please contact ,
The Arms Race in College Athletics: Facility Spending and its Relationship to
College Athletics and University Communities
By
Haley Prewett
Advisor: Dr. Steve Dittmore
An Honors Thesis in partial fulfillment of the requirements for the
degree Bachelor of Science in Business Administration in Accounting.
Sam M. Walton College of Business
University of Arkansas
Fayetteville, AR
May 10, 2014
Abstract
The arms race in collegiate athletic facilities continues to advance and involves more
and more money all the time. Large athletic departments continue to spend money on new,
large, state-of-the-art facilities for their programs in order to give them the ability to attract big
name coaches, players, and donors. College athletics is a major interest to many people in this
country and the fact that these programs have become more and more of a business makes
major facility expenditures an interesting and relevant topic to most of the general public. This
leads to the question of what factors within the athletic department and within the university
community are related to the amount of money that collegiate athletic departments spend on
their facilities. This specific study took data from a six year time period for FBS Division I
institutions in the areas of finance, athletic performance, facility usage, athletic department
size, and institutional factors. The data was gathered from a variety of outside sources and then
put through statistical analyses to find correlation and regression information between these
variables and facility spending. These tests provided information about the relationships
between the variables, how they affected each other, and what they could predict about facility
spending. The correlations provided insights into which variables actually affected the amount
of facility spending within a collegiate athletic department. It was not surprising that the
financial variables were the most related, but it was interesting to note that some of the
institutional factors and performance variables were not very related at all. The regressions also
proved to be informative because of the variables that contributed to the variance in spending
and which ones did not. These results even led to running a second regression with a change in
the independent and dependent variable to gain more insights. Although there is much
information about facility spending and the rising expenses in college athletics, there is not
much correlational data to date. The results from this study can help give collegiate athletic
departments more information and a more holistic picture of the relationships between these
important variables before they start investing in a new major facility.
i
Acknowledgements
I would like to thank the faculty and staff of the University of Arkansas. I would also like to specifically
thank the faculty and staff of the Sam M. Walton College of Business for constantly pushing me to grow
and for their continued support.
I would also like to thank Dr. Stephen Dittmore for all the time he gave to helping me through this thesis
process and for always being there to answer my questions and force me to think through everything I
did. I would like to thank Professor Ronn Smith for being willing to be the second reader of this paper
and for his feedback and help in improving this project.
Finally, I would like to thank my family and friends for always supporting me and continuously
encouraging and inspiring me.
ii
Table of Contents
Introduction……………………………………………………………………………………………………………………..1
Literature Review……………………………………………………………………………………………………………..3
Methodology…………………………………………………………………………………………………………………….6
Data & Results…………………………………………………………………………………………………………………11
Discussion……………………………………………………………………………………………………………………….19
Limitations………………………………………………………………………………………………………………………24
Future Research.……………………………………………………………………………………………………………..27
Bibliography.……………………………………………………………………………………………………………………30
Table of Tables
Table 1. Variable Information………………………………………………………………………………………….10
Table 2. Descriptive Statistics………………………………………………………………………………………….12
Table 3. Correlations……………………………………………………………………………………………………….15
Table of Figures
Figure 1. Regression Model Summary……………………………………………………………………………..17
Figure 2. Coefficients……………………………………………………………………………………………………….17
Figure 3. Regression Model Summary………………………………………………………………………………18
Figure 4. Coefficients……………………………………………………………………………………………………….18
iii
Introduction
When Oregon, Arkansas, and Alabama all revealed new and improved football facilities
in the same month, totaling $112 million spent, the collegiate athletics arms race was never
more prevalent. (Bennett, 2012 & Manfred, 2013). Institutions big and small across this
country are investing in new football stadiums, basketball arenas, practice facilities, studentathlete academic centers, and more. Collegiate athletics are as popular as ever, and the
landscape continues to become more and more of a business environment with the amount of
money involved continuing to increase and leaving a larger impact across the nation. The Knight
Commission (2013) reported that in a recent NCAA Presidential Task Force for Intercollegiate
Athletics study that “nearly 20 percent of current spending on average is tied to facility
expansion and capital debt.” (pg. 16). This shows how large the facility expenditures issue has
become. It is now a necessity for athletic departments to build these bigger and better facilities
in order to keep up with their peers. These facilities are used to attract the big name coaches
and recruits and also to please donors so that they will continue to support the program. There
does not seem to be a slowdown in the future, the large programs will continue to build more
and bigger facilities and the smaller ones will fight to stay relevant. All of this led to the goal of
this study: to analyze factors that contribute to the amount spent by collegiate athletic
departments on facilities. There is much information available about the amount that
institutions are spending and the rising costs of collegiate athletics, but there is not much
correlational data related to this topic. This study will attempt to explain the issues and provide
different variables that may be related to facility spending and in turn are influencing the arms
race.
1
This study uses public FBS Division I institutions only, since these institutions have the
high budget, high facility expenditure athletic departments. The amount of annual debt service
on facilities is used to represent the amount athletic departments are spending throughout this
study. The study looks at a period of six years from 2006-2011 to measure the relationships
between facility spending and 14 other variables. The other variables were chosen because
they are relevant to all athletic departments and universities communities, and it would be
beneficial to know how they are related to facility spending. The variables represented five
different categories: finance, athletic performance, facility usage, athletic department size, and
institutional factors. All of these variables matter to an athletic department when making any
big decisions, so it is important to understand how they are related to the decision of investing
in a new or upgraded facility.
Correlations between the Annual Debt Service on Facilities and all of the other variable
categories previously mentioned will allow for a greater understanding of the whole picture on
facility spending. Athletic Departments can take the knowledge of these relationships and use
them to help make more informed decisions about facility expenditures in the future. Facility
spending has created an all out arms race in college athletics, and it has become a major
concern for every athletic department, making the factors contributing to this spending very
intriguing. The correlational data is a new way to look at this information and will highlight
relationships between variables that may not have been known or explored before. The
regression data will also provide a way to understand which variables contribute the most to
the variances in spending and which do not.
2
This paper will outline the way the study was conducted and what was learned from it.
It will start with a review of other similar research and thoughts about the collegiate athletics
arms race and facility spending. This topic is widely publicized and there are several different
opinions to discuss. The paper will then outline the methodologies used in this specific study
and will detail more about each variable and what statistical tests were conducted to achieve
solid results. Then the paper will present the data and results from the statistical tests. It will
then analyze these results and discuss what can be learned from them and what they could
mean for athletic departments. Next, any limitations in the study will be presented in order for
the readers to understand the scope and generalizations that can be made. Finally, the paper
will end with recommendations about future research and what athletic departments should
do next with this research to help them make decisions about their future.
Literature Review
The issue of facility spending in collegiate athletics continues to garner more and more
attention every time a new, bigger, and better facility opens on a campus across this country.
There are several differing opinions about the current arms race throughout collegiate athletics.
There are opinions about the benefits of the facilities, the problems they cause, and the large
amounts of money being spent. Much of the information reports the amounts spent on these
new facilities, the amount of the budget at these institutions, and about subsidies that the
athletic departments receive from institutions. However, there is not much information
regarding the relationships that this increase in facility spending has with the other important
variables within an athletic department. This is why this study aims to fill some of that void and
provide a unique view of the spending on facilities within collegiate athletic departments.
3
As mentioned earlier, there are not a lot of previous studies similar to this one to draw
from but there are studies dealing with collegiate athletic departments’ budgets, and there is
plenty of research about college athletics spending as a whole to evaluate. For example,
McEvoy, Morse, & Shapiro’s (2013) study used several different variables that are important to
college athletic departments in its study to see what influenced revenue. In the study of
McEvoy et al., the research design was very similar to the one that this study employed because
it used a group of variables in statistical tests to determine how they were related to revenue.
The variables McEvoy et al. used in their study were analyzed when picking variables for the
study detailed in this paper and although not a lot of the same ones were used, the study by
McEvoy et al. provided a basis for finding variables that would be relevant to analyze in the
current study. The McEvoy et al. study found that conference affiliation was a primary predictor
of revenues, and although this variable was not touched in this study, it could definitely add to
facility spending information in the future.
The Knight Commission (2014) recently released a database all about spending within
college athletics. There are several different categories of spending addressed in the Knight
Commission database, and the study completed here used their information about the Annual
Debt Service on Facilities. The Knight Commission database information shows the public, in
many different ways, how much the spending in collegiate athletics has increased over the last
several years. There have been many articles that used this data to point out the percentage
change in spending per student athlete and even compare it to the percentage change in
spending per regular student. For example, according to a Vedder (2013) “inflation-adjusted
academic spending per student rose a modest 8% from 2005 to 2011. Meanwhile athletic
4
spending per athlete rose by more than 38%.” Vedder’s article is just one of many to reference
overall spending in collegiate athletics when talking about the arms race. This particular study
tries to narrow the spending down by focusing on facility spending only, but it is important to
see that the overall spending in athletics is following the same trends as facility spending. The
Knight Commission (2009) suggested the construction boom in athletics is mirroring what is
happening campus-wide across the country. This was an interesting point to make that the
arms race may not be solely focused in athletics, but is also happening with research
laboratories, residence halls, and other projects as well. Finally, this Knight Commission (2009)
article addressed different types of facility expenditures. It mentions football stadiums, for
example, being renovated or built new to include, “added capacity, luxury suites, and other
premium amenities.” (pg. 16-17). This shows how revenue streams are added from facility
spending. The added capacity means more ticket revenue, luxury suites mean people paying
more money to sit in them, and premium amenities keep people returning to your facility. It is
an interesting idea to see how these revenue producing facilities would influence athletic
department factors as compared to the non-revenue producing ones like practice facilities or
tutoring centers.
All of this information made it even clearer that the public and media are all over the
board on their opinions of the issue. There are people who believe the amount of spending
during this arms race is excessive, and there are studies that back up their claims, and there are
also those that believe these facilities add value to the institution and more importantly benefit
the student-athletes substantially, and there are figures that back this up as well. This led to the
development of the specific research question that this study aims to answer; what factors
5
contribute to the amount of money that college athletic departments spend on facilities? The
studies that have been done in the past reveal a lot about how departments spend their money
and compare this to a lot of different variables, but this new research should provide a way for
athletic departments to see something different when analyzing a new investment.
Methodology
The purpose of this study is to help better understand the current arms race in
collegiate athletics by analyzing the factors that contribute to the amount of facility spending
by collegiate athletic departments. In this study, the research design involved gathering the
data for a set of 14 quantitative variables that are important in college athletic departments
and university communities and then using statistical analyses to understand the relationships
between these variables and the facility spending at the chosen institutions. The amount of
annual debt service at these institutions was used to represent the amount of facility spending
throughout this study.
This methodological approach fit this study best because it helped reach the objective of
this study, understanding what factors affect the facility spending at these institutions. This
research problem focuses specifically on the relationships between variables so using a
statistical analysis on a set of variables that are related to the athletic departments and
universities and the amount of facility spending paints a picture of those relationships; if they
exist, and how strong they are. The correlations and regression results found made it possible
to analyze the relationships between the variables and what they mean for athletic
departments. This type of correlational data is not readily available to athletic departments and
6
using the methodology outlined here made it possible to address this need and provide new
information for athletic departments to consider when investing in a new facility of any kind.
Fourteen variables used in this study were chosen because they are relevant to this
research question and would help in drawing relevant conclusions. The 14 variables can be
broken down into five different categories. The first category is financial, which includes Annual
Revenue and Annual Expenses. The second category is performance, which includes Average
Number of Wins (Football), Average Number of Wins (Men’s Basketball), Average Number of
Wins (Women’s Basketball), and Average Director’s Cup Ranking. Facility usage is another
category, which includes Average Number of Home Contests (Football), Average Number of
Home Contests (Men’s Basketball), and Average Number of Home Contests (Women’s
Basketball). The size of athletic departments is another category and includes Average Male
Participants, Average Female Participants, and Average Total Participants. The final category is
institutional factors, which includes Average Enrollment and Average US News & World Report
Ranking. Table 1 on Page 14 shows more detailed information about each of the variables.
The data was gathered for each of these variables for each year from 2006-2011. The
years are congruent with school years, which is the way most universities report their fiscal
year. For example, the 2005-2006 school year is reported as 2006 in this data set and the 20102011 school year is reported as 2011 in this data set. The year 2006 was chosen as the first year
because it was the year that the BCS National Championship game began which started
pumping more money into college football through television distributions and such. This
additional revenue helped trigger the arms race along with programs trying to improve and
7
make it to this National Championship game. After finding the data for each individual year, an
average over the six years was taken for each variable at each institution. The relationships
between the variables were found using the averages of each variable at each institution over
the six year period included in this study.
There were a few different ways to measure a few of the variables but they were
standardized as much as possible to make it as simple as possible. For example, in the Number
of Wins and Number of Home Contest variables, no postseason events were included. For the
Number of Participants variables, the numbers are an unduplicated count in order to not count
student-athletes that participate in more than one sport twice. The Total Enrollment number is
undergraduate students only. Finally, the Director’s Cup and US News & World Report Rankings
were based on a point system. Only the institutions that were in the top one hundred received
points and these points were delineated. For example, the number one ranked school received
100 points and the number 100 ranked school received one point. These points were then
averaged over the six year time period, just like the rest of the variables, before being used in
the statistical analysis.
This study focused on institutions that would be relevant to the facility spending issue
and, therefore, the current arms race. This study includes 95 Division I FBS public institutions.
There are no private schools included because their information is not available to the public in
most cases and smaller NCAA divisions would not have been as relevant in the amounts of
facility spending. Any institutions that moved up to the FBS division during the time period in
8
the study were eliminated because their data would not have been standardized over the
whole period.
To gather the data several different sources of archival research were used. The data
was all already available to the public and combined in this process to determine the
relationships between the variables and amount of facility spending by each institution. All of
the data was originally gathered by an outside party. The information about each variable;
name, description, and original source can be found in Table 1 on Page 10.
9
Table 1. Variable Information
Variable Name
Description
Source
AnnualDebt
Average Annual Debt Service on Facilities *Payment of
principal and interest on athletic facilities debt in
reporting year.
Average Annual Revenue
*Total of Ticket Sales, Student Fees, School Funds,
Contributions, Rights/Licensing, & Other Revenue
ghtcommis
sion.org/reports/0e149f0f
*Knight Commission
/>/college/story/2012-05-14/ncaacollege-athletics-financesdatabase/54955804/1
*USA TODAY & Indiana University’s
National Sports Journalism Center
/>/college/story/2012-05-14/ncaacollege-athletics-financesdatabase/54955804/1
* USA TODAY & Indiana University’s
National Sports Journalism Center
/>*ESPN
/>*ESPN
/>*ESPN
/>*ESPN
/>*ESPN
/>*ESPN
/>adFile.aspx
*EADA Reports
/>adFile.aspx
*EADA Reports
/>adFile.aspx
*EADA Reports
/>adFile.aspx
*EADA Reports
/>acda-directorscup-previousscoring.html
*NACDA
America's best colleges (2006-2011 ed.).
Washington, D.C: U.S. News & World
Report.
*US News & World Report
AnnualRev
AnnualExp
Average Annual Expenses
*Total of Scholarships, Coaching Staff,
Building/Grounds, & Other Expenses
AvgWinsFB
Average Number of wins
*No postseason
AvgHomeFB
Average Number of home contests
*No postseason
AvgWinsMB
Average Number of wins
*No postseason
AvgHomeMB
Average Number of home contests
*No postseason
AvgWinsWB
Average Number of wins
*No postseason
AvgHomeWB
Average Number of home contests
*No postseason
AvgPartMen
Average unduplicated count of male student-athletes
AvgPartWom
Average Unduplicated count of female studentathletes
AvgPartTotal
Average Total unduplicated count of student-athletes
AvgEnroll
Average Total Undergraduate Enrollment
AvgDirCup
Average Director’s Cup Ranking
*Top 100 delineated
(Rank 1=100 points & Rank 100=1 point)
Not in Top 100=0 points
Average US News & World Report Ranking
*Top 100 delineated
(Rank 1=100 points, Rank 100=1 point)
Not in Top 100=0 points
AvgUSNews
10
The next step in the study was to understand the information resulting from the
statistical analysis. All of the data compiled, once turned into averages, was analyzed using SPSS
20.0 software. Specifically, the correlation results were used to determine which variables had
the strongest relationships with the annual debt service at the institutions. The higher the
correlation number the stronger the relationship is between that variable and the annual debt
service and the lower the number, the weaker the relationship is. A forward step-wise
regression was run next using average annual debt service as the dependent variable and this
information was used to determine the variables that contributed to the variance in spending.
This is possible because a forward step-wise regression eliminates variables from the model
that were not contributing to the adjusted r-squared, which is the number that “tells how much
of the variability of the dependent variable is explained by the independent variables” (Vogt,
2005). The correlation information led to running a second regression with the dependent
variable changed to Average Annual Expenses because it was the most highly correlated
independent variable and this regression information was also very informative and relevant
because of the variables that remained in the model and the ones that were eliminated.
Data & Results
The information presented below are the results of all the data that was gathered for
this study being put into the SPSS system and then running correlation and regression tests on
that data. These results aim to provide a unique view of collegiate athletic department
spending on facilities and how it is truly related to other relevant variables within an athletic
department and the institution as a whole.
11
Table 2 below shows the descriptive statistics for this group of data. The six years worth
of data was averaged to get one number for each institution for each variable. The descriptive
statistics below are the minimum, maximum, mean, and standard deviation of all of the
institutions together for each of the 15 variables measured. It is interesting to note some of the
ranges that this data showed; especially in terms of the financial variables. The Annual Revenue
variable had a range of $116,422,241 and the Annual Expenses variable had a range of
$105,707,544. It is also interesting to note that the mean Annual Revenue and Annual Expenses
are very similar numbers. Finally, because this study does focus on facility spending; it is of note
that the mean Annual Debt Service on Facilities is a little over $3.7 million for each of these 95
FBS Division I Institutions. There are several other numbers in this table that point to trends
within these institutions, but this study will focus mainly on the spending variables.
Table 2. Descriptive Statistics
AnnualDebt
Minimum
Maximum
Mean
Std. Deviation
.00
20,794,509.33
3,735,711.96
3,931,927.91
AnnualRev
9,478,460.00 125,900,701.00 48,201,977.24 28,210,277.52
AnnualExp
9,416,734.33 115,124,278.50 46,025,591.42 25,426,381.87
AvgWinsFB
2.17
11.17
6.27
1.97
AvgHomeFB
4.83
7.67
6.24
.65
AvgWinsMB
9.83
26.50
17.26
4.02
AvgHomeMB
13.00
18.83
16.26
1.44
AvgWinsWB
6.50
28.50
16.24
4.39
AvgHomeWB
12.00
18.17
15.14
1.28
AvgPartMen
164.80
524.83
273.33
65.31
AvgPartWom
113.33
429.00
214.58
71.96
AvgPartTotal
289.20
891.17
487.91
129.52
AvgEnroll
5,825.00
38,457.00
18,813.98
7,114.85
AvgDirCup
.00
96.67
37.38
34.83
AvgUSNews
.00
80.00
13.84
23.30
12
Table 3 on Page 15 illustrates the correlations found between all of the different
variables in this study. These correlations were part of the base used to answer the research
question presented in this study; what factors contribute to the amount of facility spending in
collegiate athletic departments. They are the link to be able to understand the relationships
between all of the athletic department and institutional factors and the annual debt service, or
facility spending amounts.
Table 3 illustrates Average Annual Expenses and Average Annual Revenues are the most
strongly correlated with Average Annual Debt Service at .733 and .719 respectively. Average
Number of Wins in Men’s Basketball and Average US News & World Rankings are the least
correlated at .190 and .264 respectively. The football variables are the most highly correlated
among the sports tested with correlations of .533 for Average Number of Wins and .588 for
Average Number of Home Contests. The Average Director’s Cup Ranking also shows a strong
relationship at .592. The institutional variables and size of the athletic department variables
were all not very highly correlated with the spending amounts, with Total Enrollment being the
most correlated of all of those.
It is also interesting to note some of the correlations among the independent variables.
For example, Average Annual Revenue and Average Annual Expenses are more highly
correlated with the Average Number of Home Contests than with the Average Number of Wins
in all three sports tested. The Financial variables are much more correlated with football than
the other sports. There are several other relationships between these variables that are
interesting and could be studied further in the future. All of these correlations paint a picture of
13
how interrelated collegiate athletic departments really are and how strong these relationships
are.
14
Table 3. Correlations
AnnualDebt
AnnualRev
AnnualExp
AvgWinsFB
AvgHomeFB
AvgWinsMB
AvgHomeMB
Avg
Wins
FB
Avg
Home
FB
Avg
Wins
MB
Avg
Home
MB
Avg
Wins
WB
Avg
Home
WB
Avg Part
Women
Avg
Part
Total
Avg
Enroll
Avg
Dir
Cup
AvgUS
News
0.377
0.372
0.381
0.422
0.592
0.264
0.478
0.607
0.614
0.647
0.580
0.887
0.554
0.419
0.491
0.641
0.638
0.678
0.605
0.900
0.576
0.314
0.340
0.259
0.308
0.222
0.279
0.255
0.472
0.174
0.422
0.781
0.317
0.479
0.455
0.486
0.500
0.484
0.746
0.395
1.000
0.563
0.221
0.366
0.269
0.352
0.331
0.284
0.420
0.292
1.000
0.301
0.558
0.421
0.445
0.459
0.377
0.644
0.374
1.000
0.373
0.405
0.338
0.392
0.215
0.454
0.294
1.000
0.365
0.277
0.338
0.168
0.448
0.287
1.000
0.780
0.938
0.503
0.675
0.710
1.000
0.949
0.567
0.620
0.659
1.000
0.569
0.685
0.724
1.000
0.588
0.467
1.000
0.646
Annual
Debt
Annual
Rev
Annual
Exp
1.000
0.719
0.733
0.533
0.588
0.190
0.484
0.265
0.440
1.000
0.991
0.551
0.801
0.435
0.675
0.397
1.000
0.551
0.814
0.455
0.697
1.000
0.466
0.087
1.000
AvgWinsWB
AvgHomeWB
AvgPartMen
AvgPartWomen
AvgPartTotal
AvgEnroll
AvgDirCup
AvgUSNews
Avg
Part
Men
1.000
15
After the correlations were run, the data was put through a step-wise regression to test
which variables actually contribute the most to predicting variances in spending.
Annual Debt Service
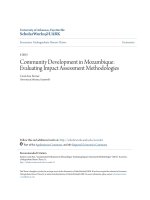
The first regression was run with the Annual Debt Service on Facilities variable as the
dependent variable as it has been throughout this study, and the other 14 variables were
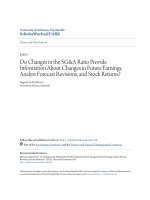
entered as the independent variables. As Figure 1 below shows, the step-wise regression
eliminated all of the independent variables except Annual Expenses, Average US News & World
Report Ranking, and Average Wins in Men’s Basketball. The other variables were eliminated
because they were not contributing to the overall model; meaning that the three variables
remaining in the model are responsible for being able to predict the variances in Annual Debt
Service on Facilities. The Adjusted R square value was used in this study to represent the
amount of variance that can be predicted, so the three variables remaining in the model are
able to predict 58.5% of the variances in facility spending based on this data.
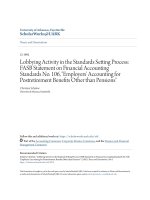
The overall regression analysis was statistically significant, where F (3, 91) = 45.121, p =
.000, R2 = .585. According to Figure 2, the standardized beta coefficients revealed that Annual
Expenses predicted the largest portion of Annual Debt Service on Facilities (β = .943) and that
Average US News & World Report Rankings and Average Wins in Men’s Basketball had an
inverse relationship with Annual Debt Service on Facilities (β = -.230) and (β =-.173)
respectively.
16
Figure 1. Regression Model Summary
Adjusted R Square Std. Error of the Estimate
Change Statistics
R Square Change F Change df1 df2 Sig. F Change
a
.585
2533771.738
.024
5.335
1
91
.023
a. Predictors: (Constant), AnnualExp, AvgUSNews, AvgWinsMB
Figure 2. Coefficients
Standardized Coefficients
t
Sig.
Beta
Model
(Constant)
.405
.687
AnnualExp
.943 10.792
.000
AvgUSNews
-.230 -2.820
.006
AvgWinsMB
-.173 -2.310
.023
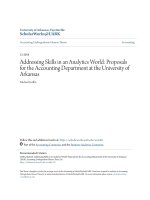
Annual Expenses
A second regression was run with the Annual Expenses variable as the
dependent variable because it was so highly correlated with the facility spending variable. This
led to interest in what would contribute to the variance in expenses and how that would
compare to what was found from Annual Debt Service on Facilities being the dependent
variable. Annual Debt Service on Facilities and the other 13 variables were used as independent
variables in this case. As Figure 3 below shows, the step-wise regression eliminated all of the
independent variables except Average Director’s Cup Ranking, Annual Debt Service on Facilities,
Average Home Contests in Football, and Average Participants Women. The other variables were
eliminated because they were not contributing to the overall model; meaning that the four
variables remaining in the model are responsible for being able to predict the variances in
17
Annual Expenses. The Adjusted R square value was used in this study to represent the amount
of variance that can be predicted, so the four variables remaining in the model are able to
predict 90.1% of the variances in expenses based on this data.
The overall regression analysis was statistically significant, where F (4, 91) = 215.490, p =
.000, R2 = .901. According to Figure 4, the standardized beta coefficients revealed that Average
Director’s Cup Ranking predicted the largest portion of Annual Expenses (β = .493) followed by
Annual Debt Service on Facilities (β = .261), Average Home Contests in Football (β = .228), and
finally Average Participation Women (β = .132).
Figure 3. Regression Model Summary
Adjusted R Square Std. Error of the Estimate
Change Statistics
R Square Change F Change df1 df2 Sig. F Change
a
.901
7989863.662
.011
10.205
1
a. Predictors: (Constant), AvgDirCup, AnnualDebt, AvgHomeFB, AvgPartWom
Figure 4. Coefficients
Standardized Coefficients
t
Sig.
Beta
Model
(Constant)
-3.447 .001
AvgDirCup
.493
8.736 .000
4 AnnualDebt
.261
6.237 .000
AvgHomeFB
.228
4.507 .000
AvgPartWom
.132
3.195 .002
18
90
.002
Discussion
This study looked at collegiate athletic spending on facilities in a unique way; it aimed to
provide information about how other relevant athletic department variables are related to this
spending. The results presented earlier indicate many interesting relationships between the
variables and also provided information from the regressions about predicting variances in the
spending. There are many ways to interpret all of these results and collegiate athletic
departments can now use these results to help them make more informed decisions about new
facility investments.
Annual Debt Service
The variables most highly correlated Annual Debt Service on Facilities were Annual
Expenses at .733 followed closely by Annual Revenue at .719. It is not surprising that these two
financial variables were the most closely correlated with facility spending because the amount
of money the department has does dictate its ability to afford new and upgraded facilities.
Although the current arms race definitely reaches all divisions in college athletics, it was started
and remains concentrated in the high budget athletic departments. These institutions that do
spend the most on facilities are most often the departments with the largest amounts of
revenue and therefore large amounts of expenses as well. This study continued to back this
thought by correlations that showed a strong relationship between the two.
The correlations also showed that the Average Number of Wins in Men’s Basketball and
the Average US News & World Report Ranking were the least correlated at .190 and .264
respectively. This is interesting because it shows that facility spending does not necessarily
19
translate to winning men’s basketball games and that having a successful men’s basketball
program does not mean the university will spend more on facilities. The US News & World
Report Ranking not being highly correlated is not quite as surprising because this is an academic
ranking of the institution. This weak relationship does possibly show that institutions that are
highly ranked academically may not focus as much on athletic facility spending and the
institutions that are focusing on athletic facility spending may not be ranked as high
academically. This distinct split between the two; athletics and academics, may not be the case
at all institutions, but it is interesting to note. It was also interesting to note that of the three
sports that were studied here, football was the most highly correlated with facility spending.
This is congruent with what most people think of when they hear about the collegiate athletics
facilities arms race. The renovations to football stadiums like Texas A&M is completing, the new
stadiums like Baylor is building, the operations centers like Oregon revealed, and the practice
facilities like Florida State is working on raising funds for are all examples that back up why
football may be the more correlated sport to facility spending. The Average Number of Wins in
Football correlation was .533 and the Average Number of Home Contests in Football was .588.
This shows that institutions are most likely to receive a return on their investment in facilities
when dealing with football over any other sport. The amount of spending on football may
actually translate into some success on the field which is why there continues to be
improvements in facilities all over the country. Athletic departments believe these facilities will
attract better student-athletes, coaches, and will please large donors.
Another interesting correlation worth mentioning is that the Average Director’s Cup
Ranking was fairly highly correlated at .592. This shows that good performance by the entire
20