Forecasting stock index based on hybrid artificial neural network models
Bạn đang xem bản rút gọn của tài liệu. Xem và tải ngay bản đầy đủ của tài liệu tại đây (916.79 KB, 6 trang )
Science & Technology Development Journal – Economics - Law and Management, 3(1):52- 57
Research Article
Forecasting stock index based on hybrid artificial neural network
models
Ta Quoc Bao1,* , Le Nhat Tan2 , Le Thi Thanh An3 , Bui Thi Thien My1
ABSTRACT
1
Forecasting stock index is a crucial financial problem which is recently received a lot of interests in
the field of artificial intelligence. In this paper we are going to study some hybrid artificial neural
network models. As main result, we show that hybrid models offer us effective tools to forecast
stock index accurately. Within this study, we have analyzed the performance of classical models
such as Autoregressive Integrated Moving Average (ARIMA), Artificial Neural Network (ANN) model
and the Hybrid model, in connection with real data coming from Vietnam Index (VNINDEX). Based
on some previous foreign data sets, for most of the complex time series, the novel hybrid models
have a good performance comparing to individual models like ARIMA and ANN. Regarding Vietnamese stock market, our results also show that the Hybrid model gives much better forecasting
accuracy compared with ARIMA and ANN models. Specifically, our results tell that the Hybrid combination model delivers smaller Root Mean Square Error (RMSE) and Mean Absolute Error (MAE)
than ARIMA and ANN models. The fitting curves demonstrate that the Hybrid model produces
closer trend so better describing the actual data. Via our study with Vietnam Index, it is confirmed
that the characteristics of ARIMA model are more suitable for linear time series while ANN model
is good to work with nonlinear time series. The Hybrid model takes into account both of these
features, so it could be employed in case of more generalized time series. As the financial market
is increasingly complex, the time series corresponding to stock indexes naturally consist of linear
and non-linear components. Because of these characteristic, the Hybrid ARIMA model with ANN
produces better prediction and estimation than other traditional models.
Key words: stock index, Hybrid models, Vietnamese stock market, ARIMA model, ANN model.
Banking University of Ho Chi Minh
City, Viet Nam
2
International University, VNUHCM,
Viet Nam
3
University of Economics and Law,
VNUHCM, Viet Nam
Correspondence
Ta Quoc Bao, Banking University of Ho
Chi Minh City, Viet Nam
Email:
History
• Received: 06-12-2018
• Accepted: 18-02-2019
• Published: 25-3-2019
DOI :
/>
Copyright
© VNU-HCM Press. This is an openaccess article distributed under the
terms of the Creative Commons
Attribution 4.0 International license.
INTRODUCTION
In the past two decades, the most popular techniques used in forecasting stock prices are the statistical models and the artificial intelligence models
(AI). Some most commonly used methods in the statistical models for time series analysis include, e.g.,
Autoregressive Integrated Moving Average (ARIMA)
or the well-known Box-Jenkins model, Exponential
Smoothing model (ESM), and Generalized Autoregressive Conditional Heteroskedasticity (GARCH)
volatility. Due to the fact that the mean and variance of financial time series change overtime, and,
hence, the series are not linear. More precisely, financial time series often contain both linear and nonlinear patterns. Therefore, one of the main restriction in these traditional models is that they only contain a linear structure. In fact, Refenes et al 1 showed
that the traditional statistical models, such as ARIMA
model, for forecasting have main limitations in applications to non-linear data set such as stock indices, exchange rates. The recent development in the theory of
computational intelligence provides powerful mathematical tools for private investors, portfolio man-
agers and also bankers to exploit the big data, especially, big data in finance. The AI models and machine learning techniques, e.g., the Artificial Neural
Network models (ANN) are introduced and utilized
to overcome these restrictions. These models contain
two components that are linear and non-linear parts.
Recently, a new approach which combines ARIMA
and ANN models for financial time series has been
studied, e.g., in Zhang 2 , Wang et al. 3 . This combination is called the hybrid model. It is showed that the
hybrid model gives more accurate result for forecasting time series, especially, for stock prices. The basic idea of hybrid ARIMA and Artificial Neural Network model is that the non-linear patterns can be presented as the residuals of the linear ARIMA model
which can be modeled by using artificial neural networks. Furthermore, the relationship between the linear and non-linear components is assumed to be additive. In this study we utilize the hybrid model to
forecast VNINDEX stock price. We find out the suitable ARIMA and ANN models for the time series and
then find out the appropriate a hybrid model which
combines the ARIMA and ANN models. Further-
Cite this article : Bao T Q, Tan L N, Thanh An L T, My B T T. Forecasting stock index based on hybrid
artificial neural network models. Sci. Tech. Dev. J. - Eco. Law Manag.; 3(1):52-57.
52
Science & Technology Development Journal – Economics - Law and Management, 3(1):52-57
more, we compare the results between hybrid model
and the individual ARIMA and ANN models in terms
of forecasting accuracy based on performance criteria
such as Root Mean Square Error (RMSE), Normalized
Mean Square Error (NMSE) and Mean Absolute Error
(MAE).
FORECASTING METHEDOLOGY
In this section we give a brief description on ARIMA
and Artificial Neural Network models. Furthermore,
we demonstrate the basic principle in the hybrid
model from ARIMA and ANN models.
The ARIMA model
ARIMA model was first initiated by Box and Jenkins 4 .
This model is one of the most general class of models
for forecasting a time series which can be made to be
stationary by differencing. More precisely, ARIMA
model is generalized from ARMA model (autoregressive moving average) in which the assumption on stationary of time series is not necessary. The important
characterization of ARIMA model is that the predictions of the behaviour of a time series in the future
depend on the past observations by a linear function
and random errors, i.e., the ARIMA equation for forecasting a stationary series Yt has the following form
predict for Yt at time t = constant+ weighted
sum of the last p values of Yt + weighted sum of
the last q values of errors
Intuitively speaking, for a non-stationary time series
Xt , we say that Xt is fitted by a ARIMA (p, d, q) process
if
(i) Yt := (1 − B)d Xt is a stationary time series, where
B is the backward shift operator, i.e., B j X = Xt− j , d
is the number of non-seasonal differences needed for
stationarity, it is called integration.
(ii) The stationary series Yt is a ARMA (p, q) process,
i.e., for every t
Yt = θ0 + ϕ1Yt−1 + ϕ2Yt−2 + · · · + ϕ pYt−p + εt −
θ1 εt−1 − θ2 εt−2 − · · · − θq εt−q ,
(
)
where εt ∼ N 0, σ 2 is the random error. The parameter p is the number of autoregressive terms and q is
the number of lagged forecast errors in the rediction
equation.
It is seen that ARIMA processes have two components
which are Autoregressive model (AR) of order p and
Moving-Average (MA) model.
The artificial neural network approach
One of the most important advantages of an Artificial Neural Networks is to approximate various complex non-linear time series. The ANN is developed
53
from statistical learning algorithm based on mimicking the neural networks in the human brain. It can
process parallelly information from data, and, hence,
the ANN provides a powerful tool for forecasting time
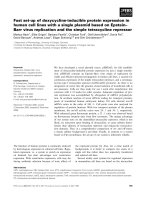
series more accurately. The ANN model consists of
layers which are an input layer, output layer and single
or more hidden layers. However, a single layer is the
most common in modelling and forecasting for time
series (see, e.g., 5 ). The algorithm of the ANN can be
described as follows. The input layer has one or more
inputs where an input is a vector value. Each node in
an input layer can be connected to the nodes of the
first hidden layer. The data go to the network through
hidden layers until attaining the output layer, for example, see the following Figure 1.
Intuitively Speaking, let Yt be a time series. The relationship between the future value (the output) and
its past values (the inputs) Yt−1 ,Yt−2 , . . . ,Yt−p can be
represented by the following equation
(
)
q
p
Yt = a0 + ∑ j=1 a j f ω0 j + ∑i=1 ωi jYt−i + εt ,
(1)
Where, at and ωi j , i = 1, 2, . . . , p; j = 1, 2, . . . , q are
parameters of the model. They are called the connection weight between layers of the model. Parameters p
and q are the number of input nodes and the number
of hidden nodes in the model. The function f is the
transfer function of the hidden layer taking the form
f (x) =
1
1 + e−x
It is seen that f is the logistic function 6 or the sigmoid
function taking values on [0, 1]. Furthermore, f is
real-valued and differentiable and has some properties such as non-positive first derivative with one local
minimum and one local maximum. From (1), we see
that the ANN model forecasts the future value by performing a non-linear functional mapping of the past
observations. Therefore, we can formulate its general
mathematical equation as follows
(
)
Yt = φ Yt−1 ,Yt−2 , . . . ,Yt−p , ω + εt ,
Where, ω is the vector of parameter and the function
ϕ is determined by the network structure and appropriate weights. Therefore, ANN can be seen as a nonlinear autoregressive model.
The main task when dealing with ANN model for a
time series is to select a correct the lagged observations p and an appropriate number of hidden nodes
q. Unfortunately, there is no theoretical methods to
guide the selection of these parameters, and, hence,
in practice, selecting the appropriate values p and q is
often conducted from experiments.
Science & Technology Development Journal – Economics - Law and Management, 3(1):52-57
Figure 1: 4-3-3-1neural network model. Source: towardsdatascience.com/multilayer-neural-networks-withsigmoid-function-deep-learning-for-rookies-2-bf464f09eb7f
The hybrid approach
DATA - RESULTS
As far as we know that ARIMA model is a good performance for forecasting linear time series and ANN
model is better selection for forecasting non-linear
time series. However, both models are not good
enough for fitting a more complex time series. Since,
a complex time series can be decomposed into a linear
component and a non-linear component, e.g., Fourier
decomposition. Hence, the hybrid model is employed
to model this type of time series in which ARIMA
and ANN approaches can be deployed to model the
linear component and the non-linear component, respectively (see, 2,3,7 ). More precisely, a time series Xt
can be represented as
Data set
Xt = Lt + Nt ,
(2)
where Lt , Nt denote the linear, non-linear components, respectively. These components can be fitted
from data. First stage, ARIMA approach is used to
model the linear component and, then, the residuals
et from the linear model can be seen as the non-linear
relationship. Hence, we can apply the ANN approach
to this component. Denote Lˆ t the forecast value at
time t, we have
et = Xt − Lˆ t .
By ANN approach, et takes the form
(
)
et = φ et−1 , et−2 , . . . , et−p , ω + εt ,
(3)
(4)
where, φ is a non-linear function determined by the
neural network and Et is the random error. Denote Nˆ t
the forecast value from (4). From (2), (3) and (4) we
have the forecast value Xˆt of the series
Xˆt = Lˆ t + Nˆ t ,
(5)
So, there are two steps to perform the hybrid ARIMA
neural network model as follows
(i) forecast values Lˆ t (resulted from ARIMA model)
(ii) forecast residuals Nˆ t (resulted from ARIMA
model) by ANN model
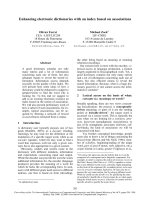
In this study the weekly closing prices for VNINDEX
from January 4, 2006 to September 28, 2018 are used
(Figures 2 and 3). There are total 663 trading weeks
in this period. The data is divided into two periods,
the first period includes 654 weeks (as a training set)
that are used for model estimation and the second period includes 9 weeks (as a test set) that is reserved for
forecasting and evaluation.
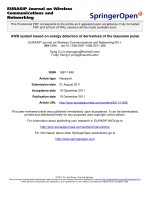
Financial time series are often not stationary, especially stock prices. Transform stock prices into log return prices is the most common method in analysing
financial data. Let Pt be the stock price at time t. The
log returns Rt are defined as
)
(
Pt
.
Rt := log
Pt−1
More details, we refer to 8 for good properties of log
return. The log returns are also called continuously
compounded returns. The plots of stock prices and
weekly log returns are shown in the following Figure 2
and Figure 3.
Error measures
We introduce some of the most common error measures or accuracy measures widely used for comparing different forecasts in financial time series. These
measures are used to identify which methods is one
of the most suitable forecast methods. The most
preferred measure used for forecasting accuracy of a
model is the Root Mean Square Error (RMSE), see,
e.g., R. Carbone and J. S. Armstrong 9 for more details.
It is defined as
√
(
)2
∑ Yr − Yˆt
RMSE :=
,
N
where N is the sample size.
54
Science & Technology Development Journal – Economics - Law and Management, 3(1):52-57
Figure 2: The daily closing prices from January 4, 2006 to September 28, 2018.
Figure 3: The weekly returns from January 4, 2006 to September 28, 2018.
The following Mean Absolute Percentage Error
(MAPE) is also used as a common error measure
(see 10 )
DISCUSSIONS
1
Yt − Yˆt .
N∑
it is seen that, this measure is easy to both understand
and compute.
This work is one first attempt applying sophisticated quantitative models to study VNINDEX. To
strengthen our results, further data sets and models should be used for testing and validation. We
are going to investigate other stock indexes given in
Thomson Reuters database as well as explore potential
developed models and their necessary improvement.
We also interested in studying whether different indexes coming from different countries favor the same
type of models, or create country- associated effect.
Results for price data
CONCLUSIONS
MAPE :=
1
N
∑
Yt − Yˆt
.
|Yt |
Another most popular error measure is known as the
Mean Absolute Error (MAE):
MAE :=
We use ARIMA, ANN and Hybrid model to fit VNINDEX data. We compare these models and chose the
best model for this data set. There are a number
studies fitting financial data by using these models
and show that the hybrid model is the best model
for fitting and forecasting closing prices of market
(see 2,3,11,12 ). In case Vietnamese market, we also see
that the hybrid is the best model for fitting VNINDEX,
see the following table for comparing error measures
of these models.
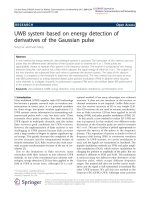
The comparison between the actual values and fitted
values of ARIMA and Hybrid models are given in Figure 4. This figure shows that Hybrid model has a good
performance in fitting VNINDEX.
55
In this study, we have analyzed the performance classical ARIMA, ANN model and the Hybrid model for
describing VNINDEX. Generally, for almost complex
time series, the novel hybrid models have a better performance than individual models ARIMA and ANN.
For Vietnamese stock market, the results show that
the Hybrid model also gives much better forecasting
accuracy as compared with ARIMA and ANN models.
ABBREVIATIONS
AI: Artificial Intelligence
ARIMA: Autoregressive Integrated Moving Average
ESM: Exponential Smoothing Model
Science & Technology Development Journal – Economics - Law and Management, 3(1):52-57
Table 1: Error Measures
MAE
RMSE
ARIMA
0.006225405
6.597903e-05
Hybrid
0.005496027
5.426601e-05
ANN
0.005751329
5.562526e-05
Figure 4: Fitting with ARIMA and Hybrid models.
GARCH: Generalized Autoregressive Conditional
Heteroskedasticity
ANN: Artificial Neural Network model
RMSE: Root Mean Square Error
NMSE: Normalized Mean Square Error
MAE: Mean Absolute Error
VNINDEX: Vietnam Index, a capitalizationweighted index of all the companies listed on the Ho
Chi Minh City Stock Exchange
COMPETING INTERESTS
The authors declare that they have no conflict of interest.
AUTHORS’ CONTRIBUTIONS
Ta Quoc Bao and Le Thi Thanh An initiate the idea,
study relevant models and seek for the data. Ta Quoc
Bao and Le Nhat Tan build the main programs for numerical simulations. All authors check the simulation
and contribute for the interpretation of the results. Ta
Quoc Bao and Le Thi Thanh An edit and revise the
text. All authors check and approve the article.
REFERENCES
1. Refenes AN, Zapranis A, Francis G. Stock performance modeling using neural networks: a comparative study with regression models. Neural networks. 1994;7(2):375–88. Available
from: />2. Zhang GP. Time series forecasting using a hybrid ARIMA and
neural network model. Neurocomputing; 2003.
3. Wang JJ, Wang JZ, Zhang ZG, Guo SP. Stock index forecasting
based on a hybrid model. Omega. 2012;40(6):758–66.
4. Box G, Jenkins G. Time Series Analysis, Forecasting and Control. San Francisco, CA: Holden-Day; 1970. .
5. Zhang G, Patuwo BE, Hu MY. Forecasting with artificial neural
networks: The state of the art. International journal of forecasting. 1998;14(1):35–62.
6. Jain AK, Mao J, Mohiuddin K. Artificial neural networks: A tutorial. Computer. 1996;(3):31–44. Available from: DOI Bookmark: 10.1109/2.485891.
7. Guresen E, Kayakutlu G, Daim T. Using artificial neural network
models in stock market index prediction. Expert Systems with
Applications. 2011;38(8):10389–97. Available from: https://d
oi.org/10.1016/j.eswa.2011.02.068.
8. Ruppert D, Matteson DS. Statistics and data analysis for financial engineering. Springer; 2015. Available from: DOI
10.1007/978-1-4939-2614-5.
9. Carbone R, Armstrong JS. Note. Evaluation of extrapolative
forecasting methods: results of a survey of academicians and
practitioners. Journal of Forecasting. 1982;1(2):215–7. https:/
/doi.org/10.1002/for.3980010207.
10. Armstrong JS, Collopy F. Error measures for generalizing
about forecasting methods: Empirical comparisons. International journal of forecasting. 1992;8(1):69–80.
11. Aslanargun A, Mammadov M, Yazici B, Yolacan S. Comparison
of ARIMA, neural networks and hybrid models in time series:
tourist arrival forecasting. Journal of Statistical Computation
Simulation. 2007;77(1):29–53.
12. Pai PF, Lin CS. A hybrid ARIMA and support vector machines
model in stock price forecasting. Omega. 2005;33(6):497–505.
Available from: />.
56
Tạp chí Phát triển Khoa học và Công nghệ – Kinh tế-Luật và Quản lý, 3(1):52- 57
Nghiên cứu
Dự báo chỉ số cổ phie´ˆ u bằng các mô hình mạng thần kinh nhân tạo
ke´ˆ t hợp
Tạ Quốc Bảo1,* , Lê Nhật Tân2 , Lê Thị Thanh An3 , Bùi Thị Thiên Mỹ1
TÓM TẮT
Dự báo chỉ số cổ phie´ˆ u là một trong những vấn đề tài chính quan trọng và gần đây đã thu hút được
nhiều sự quan tâm từ các chuyên gia trong lĩnh vực trí thông minh nhân tạo. Trong nghiên cứu
này, chúng tôi sử dụng một số mô hình mạng thần kinh ke´ˆ t hợp. Ke´ˆ t quả chính cho thấy mô hình
này cung cấp một công cụ hiệu quả để dự báo chính xác hơn chỉ số chứng khoán. Cụ thể, chúng
tôi đã so sánh hiệu quả dự báo chỉ số VNINDEX giữa các mô hình truyền thống ARIMA, ANN và mô
hình ke´ˆ t hợp Hybrid ARIMA và ANN. Dựa trên các số liệu từ các nước, đối với hầu he´ˆ t các chuỗi
thời gian phức tạp, mô hình ke´ˆ t hợp mới cho khả năng dự báo tốt hơn so với các mô hình riêng
lẻ ARIMA và ANN. Đối với thị trường cổ phie´ˆ u Việt Nam, ke´ˆ t quả cũng cho thấy các mô hình ke´ˆ t
hợp mới dự báo chính xác hơn đáng kể so với các mô hình ARIMA và ANN. Cụ thể, các ke´ˆ t quả của
chúng tôi cho thấy mô hình ke´ˆ t hợp Hybrid cho sai số bé hơn hẳn so với hai mô hình đơn ARIMA
và ANN. Các đồ thị xấp xỉ chỉ ra rằng mô hình Hybrid phản ánh chính xác xu hướng tăng giảm và
gần với dữ liệu thực te´ˆ hơn. Đặc điểm của mô hình ARIMA thường thích hợp cho các chuỗi thời
gian tuye´ˆ n tính trong khi mô hình ANN hay được sử dụng để dự báo cho các chuỗi thời gian phi
tuye´ˆ n. Mô hình Hybrid ke´ˆ t hợp được cả hai ye´ˆ u tố trên nên có thể sử dụng cho các chuỗi thời gian
tổng quát. Do thị trường tài chính ngày càng phức tạp nên đặc điểm của chuỗi thời gian tương
ứng với chỉ số chứng khoán thường bao gồm cả hai thành phần tuye´ˆ n tính và phi tuye´ˆ n. Vì đặc
tính này nên mô hình ke´ˆ t hợp Hybrid ARIMA với ANN cho ke´ˆ t quả dự báo và ước lượng tốt hơn các
mô hình truyền thống khác.
Từ khoá: Chỉ số cổ phie´ˆ u, các mô hình ke´ˆ t hợp, thị trường cổ phie´ˆ u Việt Nam, mô hình ARIMA, ANN
1
Trường Đại học Ngân hàng TP HCM
Trường Đại học Quốc te´ˆ , ĐHQG HCM
2
Trường Đại học Kinh te´ˆ Luật, ĐHQG
HCM
3
Liên hệ
Tạ Quốc Bảo, Trường Đại học Ngân hàng TP
HCM
Email:
Lịch sử
• Ngày nhận: 06-12-2018
• Ngày chấp nhận: 18-02-2019
• Ngày đăng: 25-03-2019
DOI : 10.32508/stdjelm.v3i1.540
Bản quyền
© ĐHQG Tp.HCM. Đây là bài báo công bố
mở được phát hành theo các điều khoản của
the Creative Commons Attribution 4.0
International license.
Trích dẫn bài báo này: Quốc Bảo T, Nhật Tân L, Thị Thanh An L, Thị Thiên Mỹ B. Dự báo chỉ số cổ phie´ˆ u
bằng các mô hình mạng thần kinh nhân tạo ke´ˆ t hợp. Sci. Tech. Dev. J. - Eco. Law Manag.; 3(1):52-57.
57