Investigation of DPA in the reactor pressure vessel of VVER-1000/V320
Bạn đang xem bản rút gọn của tài liệu. Xem và tải ngay bản đầy đủ của tài liệu tại đây (698.83 KB, 10 trang )
Nuclear Science and Technology, Vol.7, No. 4 (2017), pp. 16-25
Investigation of DPA in the reactor pressure vessel
of VVER-1000/V320
Nguyen Huu Tiep1*, Pham Nhu Viet Ha1, Nguyen Minh Tuan2
1
Institute for Nuclear Science and Technology, Vietnam Atomic Energy Institute
179 Hoang Quoc Viet Street, CauGiay, Ha Noi, Viet Nam
2
Dalat Nuclear Research Institute, Vietnam Atomic Energy Institute
01 Nguyen Tu Luc, Da Lat, Lam Dong, Viet Nam
*E-mail:
(Received 01 November 2017, accepted 30 December 2017)
Abstract: The most important ageing effect on the reactor pressure vessel (RPV) is radiation
embrittlement, which is mainly caused by fast neutrons during operation lifetime of nuclear reactors.
The aim of this study was to investigate the DPA (displacement per atom) rate, an important
parameter describing radiation damage to the RPV, and identify the position of the maximum DPA
rate in the RPV of the VVER-1000/V320 reactor using the Monte Carlo code MCNP5. To reduce
statistical errors in the MCNP5 simulation, the weight window technique was applied to non-repeated
structures outside the reactor core. The results showed the distribution of the DPA rate in the RPV and
the maximum DPA rate was found to be at the first millimeters of the RPV. Consequently, these
calculations could be useful for assessment of radiation damage to the RPV of VVER reactors.
Keywords: VVER, reactor pressure vessel embrittlement, DPA rate, weight window technique.
I. INTRODUCTION
During the operation of nuclear power
plants (NPPs), assessment of radiation
embrittlement of the structure materials and
reactor pressure vessels (RPVs) by neutron
and gamma is one of the most important
issues to ensure their integrity. In particular, it
is widely recognized that the service lifetime
of an RPV is limited by neutron irradiation
embrittlement [1].
As of 2014, there have been more than
100 serious nuclear accidents and incidents
from the use of NPPs, including the Three Mile
Island (1979), Chernobyl (1986), and
Fukushima Daiichi (2011) accidents. The RPV
acts as a barrier that keeps radioactive fuel
contained and out of the environment, and
therefore ensuring the integrity of the RPV
during normal operation of NPPs or under
accident conditions is indispensable. To this
end, investigating the displacement per atom
(DPA) rate in the RPV, which is a key
parameter describing radiation embrittlement
of the RPV, has received much attention so far
[2]-[4].
As published by the OECD/NEA stateof-the-art report in 1996 [2], the introduction of
DPA to represent the metal damaging effects
of neutrons at all neutron energy levels was
presented. Besides, the reconsideration of the
computation techniques for calculating
neutron/gamma radiation damage to RPV and
the methods used in the NEA member
countries for computing long-term cumulative
dose rates were also reported. The report
disclosed that the results of neutron/gamma
fluence and radiation doses were within 20
percent difference when compared between
calculations and measurements or calculations
with different computer codes. Another report
of Boehmer et al [3] showed the results such as
©2017 Vietnam Atomic Energy Society and Vietnam Atomic Energy Institute
NGUYEN HUU TIEP, PHAM NHU VIET HA, NGUYEN MINH TUAN
Table I. A brief information of VVER-1000/V320
the neutron/gamma spectra, several fluence
integrals, and the DPA and freely migrating
defect (FMD) rates of ex-core components of
Russian (VVER-1000) and German light water
reactors (1300 MW PWR and 900 MW BWR).
Nonetheless, the neutron fluence and DPA
ditributions at the RPV have not been shown.
Recently, the calculation of DPA in the RPV of
the Argentinian Atucha II reactor (PHWR
type) [4] was performed using the Monte Carlo
code MCNP, determining the areas at the RPV
where the neutron fluence and DPA rate are
maximum. However, application of variance
reduction techniques (VRTs) to reduce
statistical errors and computational time for
such neutron deep penetration calculation with
MCNP has not been mentioned.
Parameter
Value
Reactor type
VVER-1000
Version
V320
Nominal power, MWt
3000
Nominal electric power, MWe
1000
0
Coolant inlet temperature, C
288
Number of fuel assemblies, pcs
163
Effective core radius, mm
1580
Pressure vessel inner radius, mm
(without 7mm of cladding
thickness)
2075
Pressure vessel outer radius, mm
2267.5
Table II. Fuel assembly (FA) description
In this paper, we aim to investigate the
DPA distributions on RPV of a Russian
pressurized water reactor, the VVER1000/V320 [5], using the Monte Carlo code
MCNP5 [6], thereby identifying the maximum
radiation exposure areas in the RPV. In the
MCNP5 simulation, the weight window VRT
was applied to non-repeated structures outside
the reactor core, leading to a significant
decrease of statistical errors in the neutron
fluence and DPA calculations. As a result, the
maximum neutron fluence and DPA rate were
found at the first millimeters of the RPV areas
that are nearest to the peripheral fuel
assemblies.
Parameter
Value
FA pitch, mm
236
FA wrench size, mm
234
FA gap, mm
2
Number of fuel rods, pcs
Fuel pin pitch, mm
312
12.75
Fuel pin grid
triangular
Fuel pin
Cladding:
Material
II. CALCULATION METHODOLOGY
Zirconium alloy
(Zr+1%Nb)
Density, g/cm3
6.52
Outer diameter, mm
9.1
Wall thickness, mm
0.65
Pellet:
The VVER-1000 reactor core consists
of 163 fuel assemblies (FA). Each FA has
312 fuel rods and 18 guiding channels. The
main characteristics of VVER reactor core
and FA parameters are described in Table I
and Table II, respectively. Detailed
description of the reactor core materials can
be found in [5].
Material
UO2
3
17
Density, g/cm
10.22
Outer diameter, mm
7.55
Center
diameter, mm
2.4
hole
Height of UO2, mm
3550
Mass of UO2, g
1460
INVESTIGATION OF DPA IN THE REACTOR PRESSURE VESSEL OF VVER-1000/V320
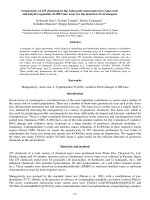
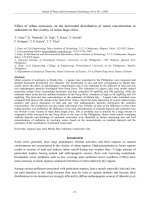
The MCNP5 input file for VVER1000/V320 reactor core modelled the fuel
assemblies as repeated structures up to the steel
baffle, while the regions outside the core from
the baffle to the RPV (see Fig. 2a) were
simulated as non-repeated structures. The full
core model in MCNP5 for VVER-1000/V320
was described in Fig. 2b.
where Q is the energy release in one
fission, Pcore the thermal power of the reactor,
the average number of neutrons emitted in
one fission, and
is the fluence obtained
by FMESH in neutron energy group i.
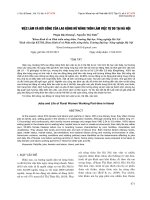
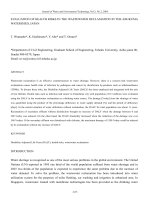
To calculate DPA (displacement per
atom), which is the number of times an atom is
displaced from the normal lattice by interaction
with neutrons, the DPA cross-section for iron
was used [8] (see Fig.1) and the following
formula was applied.
The nuclear data for this calculation
were taken from the ENDF/B-VII.1 library. To
calculate the neutron fluence on the RPV of the
VVER-1000/V320 reactor, the FMESH tally
card was utilized in the MCNP5 calculation.
The FMESH card calculates the track length
estimate of particle flux, averaged over a mesh
cell, in units of particles/cm2. This card can be
used for the calculation of flux distributions,
power peaking factor and power distributions.
The neutron fluences calculated by the MCNP5
code were plotted using the "pcolor" graphics
module of the Matlab-like open-source Scilab
[7]. The formulae for calculating the neutron
flux and DPA rate from the FMESH tally
results are described as follows.
∑̅
∫
( )
∑̅
( )
where ̅ is the DPA microscopic crosssection,
is the neutron flux in the i group
(obtained from Eq. (1)), and N the number of
neutron energy groups (N= 640 in this case).
Finally, the DPA rate can be calculated
as follows.
The neutron flux can be determined
using the following equation.
( )
where n is the number of atoms.
( )
( )
(
(
)
)
(
)
(
)
( )
Fig 1. The DPA cross-section [8]
18
NGUYEN HUU TIEP, PHAM NHU VIET HA, NGUYEN MINH TUAN
The statistical errors for the FMESH tally
results were found as high as 0.1 without
applying any VRT (with a huge number of
neutron history of 109). To reduce the statistical
errors and computational time in the MCNP5
calculation, the weight window generator,
which outputs the reciprocal of the average
score (importance) generated by particles
entering a given phase-space region and helps
correct poor track distributions [9], was applied
in this study for the regions outside the reactor
core (non-repeated structures).
The areas on the RPV inner surface
where the neutron fluence is highest were
identified at the core mid plane. Then the
average DPA rate in the RPV thickness at the
core mid plane was calculated to determine the
position at which the DPA rate reaches
maximum. The DPA spectrum was also
evaluated to figure out contributions to the
DPA rate from each neutron energy group. The
calculation results are presented in the
following Section.
Fig. 2a VVER-1000/V320 core in 600 symmetry
Fig. 2b The VVER-1000/V320 full core model in MCNP5
19
INVESTIGATION OF DPA IN THE REACTOR PRESSURE VESSEL OF VVER-1000/V320
simulation, we used both repeated structures
(reactor core) and non-repeated structures
(regions outside the reactor core). Thus, it is
possible to apply the weight window technique
for the regions outside the reactor core in this
study. First, we performed the analog
calculation to produce the average score
generated by particles entering a given phasespace region for all regions including fuel
assemblies and the regions outside the reactor
core. Second, the weight window lower bounds
of the RPV cladding were observed and the
weight window factors for the F4 tally region
(the whole RPV) were determined. Table. 3
illustrated the neutron fluence calculation
results for the whole RPV region in which
using the weight windows significantly
reduced the statistical error from 0.0682 to
0.0028.
III. CALCULATION RESULTS
To identify the maximum neutron
fluence in the RPV, the neutron fluence at the
inner surface of the RPV was calculated and
investigated depending on the azimuthal angle
( ) and the reactor core axial position ( ). The
long distance from the core center to the RPV
outer surface of 226.75 cm (the thickness of
RPV is 19.25 cm) requires application of
advanced VRTs to reduce statistical errors in
the neutron fluence calculation; otherwise,
analog calculations without any VRTs for such
a neutron deep penetration problem could lead
to unreliable results even with a huge number
of neutron history.
Specifically, the weight window
generator was not produced for repeated
structures, because the geometry splitting uses
the product of the importance at different
levels [6]. However, in our MCNP5
Table III. The F4 tally results for the whole RPV region with and without weight windows technique
(nps: total number of neutron histories, FOM: figure of merit)
No weight windows
Weight windows
nps
mean
error
FOM
nps
mean
error
FOM
1024000
1.3140E-10
0.6321
3.6E-01
1024000
1.1405E-10
0.0540
9.0E-01
2048000
1.2170E-10
0.2186
6.4E-02
2048000
1.3746E-10
0.0088
7.1E-01
3072000
1.3742E-10
0.1400
8.2E-02
3072000
1.3931E-10
0.0062
7.2E-01
4096000
1.1784E-10
0.1207
7.4E-02
4096000
1.3954E-10
0.0051
7.1E-01
5120000
1.1846E-10
0.1057
7.3E-02
5120000
1.3755E-10
0.0044
7.2E-01
6144000
1.2638E-10
0.1003
6..5E-02
6144000
1.3782 E-10
0.0039
7.2E-01
7168000
1.3375E-10
0.0881
7.0E-02
7168000
1.3810 E-10
0.0036
7.2E-01
8192000
1.2626E-10
0.0826
6.9E-02
8192000
1.3779 E-10
0.0033
7.2E-01
9216000
1.2582E-10
0.0761
7.1E-02
9216000
1.3736 E-10
0.0031
7.2E-01
10240000
1.2432E-10
0.0712
7.2E-02
10240000
1.3734 E-10
0.0029
7.2E-01
10997019
1.2432E-10
0.0682
7.3E-02
10999762
1.3713 E-10
0.0028
7.2E-01
The FMESH tally was then applied to
determine the neutron fluence and distribution
of DPA rate in the RPV using the weight
window technique. In this case, the neutron
number history of 107 was chosen and the
relative error of the FMESH tally results was
20
NGUYEN HUU TIEP, PHAM NHU VIET HA, NGUYEN MINH TUAN
found as low as less than 0.035. It is noted that
we used a fine mesh for the FMESH tally (Δr,
Δz, and Δθ = 0.5 cm, 35.3 cm, and 10
respectively) to obtain the distribution of DPA
rate in the RPV; while the case in Table III
used the F4 tally for the whole RPV region. As
the FMESH tally was used, the relative error
was as high as 0.1 without using the weight
window technique.
every 60° due to the one-sixth symmetry of the
core. Also, the neutron fluence were symmetric
with respect to the core mid-plane, mainly
caused by the use of uniform coolant and fuel
temperatures along the core axial direction in
the MCNP5 calculation.
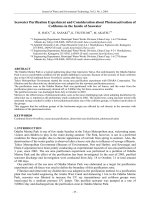
Fig. 4 displayed the DPA rate at the
RPV on the mid-plane of the core (outer radius
of the RPV = 226.75 cm). It was found that the
maxima of the DPA rate appeared at the same
azimuthal positions with the peaks of the
neutron fluence. In this case, the DPA was
linearly dependent on the neutron fluences,
because only one neutron energy group was
used for calculation of the DPA rate (see Eq.
(2)). In addition, the maximum neutron fluence
and DPA rate were identified at the first
millimeters of the RPV. The contribution of
each neutron energy group to the DPA rate will
be examined and presented below.
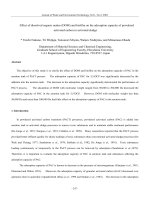
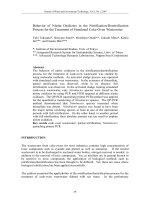
Fig. 3 showed the neutron fluence,
( ), at the inner surface of the RPV (inner
radius of the RPV = 207.5 cm). As it was
expected, the maxima of the neutron fluence
were found at the positions close to the
azimuthal angles where the distance between
the RPV and the peripheral fuel assemblies
was shortest. The peaks of the neutron fluence
were found at z = 176.5cm (core mid-plane)
and
70,
530,
670,
1130,
0
0
0
127 ,
173 ,
187 ,
2330,
2470,
2930,
3070,
3530.
It can be seen that each peak was repeated
Fig. 3. The neutron fluence at the inner surface of the RPV (1/cm2)
21
INVESTIGATION OF DPA IN THE REACTOR PRESSURE VESSEL OF VVER-1000/V320
Fig. 4. The DPA rate at the RPV on the core mid-plane (s-1)
Fig. 5. The neutron flux spectra at the barrel and RPV
22
NGUYEN HUU TIEP, PHAM NHU VIET HA, NGUYEN MINH TUAN
Fig.5 represented the neutron flux
spectra at the steel barrel (r =181 cm), the inner
surface of the RPV (r =207.5 cm), the 1/4
thickness of the RPV (r =212.31 cm), and the
outer surface of the RPV (r =226.75 cm). It can
be seen that the neutron spectrum was
hardened as neutrons penetrated from the steel
barrel into the RPV. The highest spectrum was
at the steel barrel (before the down-comer
region) and the lowest was identified at the
outer surface of RPV. It can be explained by
the presence of the down-comer region where
the neutrons were slowed down and partially
absorbed by the boric acid in the water.
Fig. 6. The DPA rate at the inner surface, the 1/4T thickness and the outer surface of the RPV
Combining the neutron flux and DPA
cross-section [9], the DPA rate distribution was
calculated following the Eqs. (2) - (3). As
shown in Fig. 6, the DPA rate in each energy
group is plotted as a function of neutron energy
at the inner surface of the RPV, 1/4 thickness
of the RPV, and the outer surface of the RPV.
The contributions of thermal neutrons to the
DPA rate at the inner surface of the RPV and
1/4 thickness of the RPV were higher than that
at the outer surface of the RPV. This difference
was reduced in the intermediate and fast
energy ranges.
Table IV. The neutron flux and DPA rate for inner surface and 1/4 thickness of the RPV
Energy
group
(MeV)
0 to 4e-7
4e-7 to 0.1
0.1 to 1
1 to 20
Total
Neutron fluence (1/cm2)
Inner surface
5.84E-10
3.23E-10
2.39E-10
1.53E-10
1.30E-09
%
44.9
24.9
18.4
11.8
100
DPA rate (s-1)
1/4Thickness
3.09E-11
1.79E-10
2.23E-10
9.10E-11
5.2403E-10
%
5.9
34.1
42.6
17.4
100
The neutron fluence and DPA rate
contributed from the four commonly used
energy
groups
(thermal,
epithermal,
Inner surface
8.36E-11
2.22E-10
1.67E-09
3.68E-09
5.656E-09
%
1.5
3.9
29.6
65.0
100
1/4Thickness
3.44E-12
1.67E-10
1.57E-09
2.03E-09
3.77E-09
%
0.1
4.4
41.6
53.9
100
intermediate and fast neutron energies) for the
inner surface and 1/4 thickness of the RPV
were presented in Table IV. As shown in this
23
INVESTIGATION OF DPA IN THE REACTOR PRESSURE VESSEL OF VVER-1000/V320
Table, significant contributions to the DPA rate
on the inner surface of the RPV were from the
fast neutrons (65.0% of the total DPA rate) and
the intermediate neutrons (29.6% of the total
DPA rate). These contributions from fast and
intermediate neutrons correspond to their
fraction of 30.2% of the total flux while the
contribution from thermal and epithermal
neutron groups (69.8% of the total flux) is
small (only 5.4% of the total DPA rate). The
same results were found at the 1/4 thickness of
the RPV. However, the contribution from the
fast neutrons to the DPA rate was decreased
about 10% while that of the intermediate
neutrons was increased about 10% as
compared with the case at the inner surface.
surface. It was found that the rate of DPA
decreased when the neutron penetrated through
the RPV. The results also showed that the main
contribution to the DPA rate came from
intermediate and fast neutron energy groups
(94.6% at the inner surface of the RPV and
95.5% at 1/4 thickness of the RPV).
In future work, several VRTs will be
applied together to further reduce the abovementioned statistical error of the FMESH tally
results. Additionally, verification calculation
by using another nuclear code is also being
planned along with using different nuclear data
libraries.
REFERENCE
IV. CONCLUSIONS
In this study, we performed the
calculation of the neutron fluence and DPA
rate on the RPV of the VVER-1000/V392 with
the Monte Carlo code MCNP5. The neutron
fluence and DPA rate at different positions in
the RPV were investigated to figure out the
position at which these quantities are
maximum. The main results were summarized
as follows:
The weight window technique was
applied to reduce statistical errors in the
MCNP5 calculations. By using this VRT, the
relative error of the FMESH tally results was
reduced from 0.1 to an acceptable value of
0.035.
The maxima of the neutron fluence and
DPA rate were found at the same positions at
the core mid-plane, which are close to the
peripheral fuel assemblies.
These maxima were identified at the
first millimeters of the RPV. The DPA rate
versus neutron energy was investigated in
difference positions of the RPV including its
inner surface, 1/4 thickness and the outer
24
1.
ODETTE, G., R., LUCAS, G., E.
Embrittlement of Nuclear Reactor Pressure
Vessels: JOM journal, No. 7, p. 18-22, 2001.
2.
OECD/NEA
State-of-the-art
Report,
"Computing Radiation Dose to Reactor
Pressure
Vessel
and
Internals,"
NEA/NSC/DOC (96)5, 1996.
3.
B. Boehmer, J. Konheiser, K. Noack, A.
Rogov, G.Borodkin, E. Polke, P. Vladimirov,
“Neutron and gamma fluence and radiation
damage parameters of ex-corecomponents of
Russian and German light water reactors”.
Proceedings of the 11th International
Symposium on Reactor Dosimetry, 18-23
August 2002 in Brussels, Belgium. World
Scientific
Publishing
Co.
ISBN
#9789812705563, 286-294, 2003.
4.
J. A.Mascitti and M. Madariaga,"Method for
the Calculation of DPA in the Reactor Pressure
Vessel of Atucha II," Science and Technology
of Nuclear Installations, Volume 2011, Article
ID 534689, 2011.
5.
G.Borodkin, B.Boehmer, K.Noack, and
N.Khrennikov. "Balakovo-3 VVER-1000 EXvessel
neutron
dosimetry
benchmark
experiment,"
Forschungszentrum
NGUYEN HUU TIEP, PHAM NHU VIET HA, NGUYEN MINH TUAN
Rossendorfe.V, Moscow - Dresden, November
2002.
6.
X-5 Monte Carlo Team, MCNP5 - A General
Monte Carlo N-Particle Transport Code Volume I, II, III, Version 5,Los Alamos
National Laboratory Report LA-UR-03-1987,
Apirl 24, 2003.
7.
S.L. Campbell, J.P. Chancelier, and R.
Nikoukhah, Modeling and Simulation in
Scilab/Scicos, Springer, 2000.
25
8.
Preliminary Assessment of the Impact on
Reactor Vessel dpa Rates Due to Installation of
a Proposed Low Enriched Uranium (LEU)
Core in the High Flux Isotope Reactor (HFIR),
prepared by Oak Ridge National Laboratory,
managed by UT-BATTELLE, LLC for the US
DEPARTMENT OF ENERGY, Charles Daily,
ORNL/SPR-2015/263, October 2015.
9.
A Sample Problem for Variance Reduction in
MCNP, Thomas Booth Los Alamos National
Lab. Report: LA-10363-MS, 1985.