Effect of extraction conditions on the antioxidant activity of Vernonia amygdalina Del. (Asteraceae)
Bạn đang xem bản rút gọn của tài liệu. Xem và tải ngay bản đầy đủ của tài liệu tại đây (1.34 MB, 10 trang )
TẠP CHÍ PHÁT TRIỂN KHOA HỌC VÀ CÔNG NGHỆ KỸ THUẬT & CÔNG NGHỆ, TẬP 1, SỐ 3, 2018
37
Effect of extraction conditions on the
antioxidant activity of Vernonia amygdalina
Del. (Asteraceae)
Dinh Chung Duong*, Ngoc Yen Nguyen Thi, Hung Lam Hoa
Abstract—In this study, the effect of
extraction conditions on the antioxidant activity
of Vernonia amygdalina Del. (Asteraceae) was
evaluated by Response surface methodology
and central composite design (RSM-CCD) to
predict the content of phenolic compounds with
maximum antioxidant activity. Total phenol
and flavonoid contents were determined by
spectrophotometry method, especially the
flavonoid content was identified by HPLC-DAD
system. The antioxidant activity was estimated
by the DPPH and the FRAP method. Results
showed that extracting time, extracting
temperature and solvent-to-material ratio had a
significant effect on phenolic content (p <
0.001). The interactions between the three
factors were also found to be significant at 0.05
level of probability. After re-estimating
predicted variables on the experiment, we
found that the polyphenol content was 137.15 ±
1.36 mg gallic acid /g dry weight (dw), the
flavonoid content was 96.78 ± 1.39 mg
quercetin/g dw, the total antioxidant activity
was 1.95 ± 0.09 mg ascorbic acid/g dw and iron
reduction activity was 5.90 ± 0.12 mg FeSO 4/g
dw at optimum conditions of 34.82 hours at
53.09 °C with solvent to material ratio is 43.64
(ml/g). The correlation coefficients were greater
than 0.995 observed between the predicted and
actual values for the response variables, which
Received: Sep 19th, 2018; Accepted: Dec 17th, 2018;
Published: Dec 30th, 2018
“This study was sponsored by The Science and Research
Development Fund of Nguyen Tat Thanh University.”
Dinh Chung Duong, Ngoc Yen Nguyen Thi is with Falculty
of Pharmacy in Nguyen Tat Thanh Univeristy, 298-300A
Nguyen Tat Thanh Street, Ward 13, District 4, Ho Chi Minh
City (e-mail: ).
Hung Lam Hoa is with Department of Physiochemical,
Faculty of Chemical Engineering, Ho Chi Minh City University
of Technology, VNU-HCM.
are evidences that the regression model can
represent the experimental data well. HPLC
showed that leaves contain at least six
flavonoids, two of which are apigenin and
luteolin. The flavonoids apigenin and luteolin
were identified in the extract from Vernonia
amygdalina with high levels of apigenin (2.72
mg/g dw), luteolin (3.76 mg/g dw).
Keywords—Vernonia
amygdalina
Del.,
extraction conditions, polyphenol, antioxidant
activity, oxidative stress.
1 INTRODUCTION
F
ree radicals play important roles and necessary
for life. It was produced continuously in all
cells as part of a normal cellular function. Free
radicals and oxidants contain both toxic and
beneficial compounds. Oxidative stress, arising as
a result of an imbalance between free radical
production and antioxidant defenses [1] but cannot
gradually be destroyed,
following their
accumulation in the body. This process is partly
reposible for the development of diseases such as
arthritis, vasculitis, lupus erythematous, adult
respiratory diseases syndrome, hypertension, heart
diseases, stroke, intestinal is chemianeurological
disorder (Alzheimer's disease, Parkinson's disease,
muscular dystrophy) [2, 3].
Antioxidants act as a radical scavenger, a
hydrogen donor, electron donor, peroxide
decomposer, singlet oxygen quencher, a enzyme
inhibitor, synergist, and metal chelating agents.
Both enzymatic and nonenzymatic antioxidants
exist in the intracellular and extracellular
environment to detoxify ROS (reactive oxygen
species) [4]. The human body has several
mechanisms to counteract oxidative stress by
producing antioxidants, such as the superoxide
dismutase, catalase, glutathione peroxidase and
glutathione reductase which are either naturally
produced or externally supplied through foods
and/or supplements such as vitamin A, C , E [5, 6],
38
SCIENCE & TECHNOLOGY DEVELOPMENT JOURNAL ENGINEERING & TECHNOLOGY, VOL 1, ISSUE 3, 2018
glutathione [7] and polyphenol antioxidants
originated from plants [8-11].
Vernonia amygdalina is a shrub that grows
predominantly in Africa and Asia. That is a plant
widely used for application in natural medicine. It
is commonly known as “bitter leaf” which is due
to its bitter taste [12]. It is characterized by a softwooded tree of 2 to 5 m with an elliptical leaf from
the genus Vernonia [2]. The phytochemical
screening of the plants studied showed that the
presence of flavonoids, saponins, alkaloids,
tannins, phenolics, terpenes, steroidal glycosides,
sesquiterpene lactones, triterpenoids [13, 14] was
represented by polysaccharides[15], luteolin,
luteolin 7-O-β-glucoside luteolin 7-O-glucuronide
[12],
vernolide,
vernolepin,
vernodalin,
hydroxyvernolide,
vernodalol,
vernomygdin,
vernomenin, 4,15-dihydrovernodalin, 1,2,11,12ʹ,3ʹ
hexahydrovernodalin,
1,2,4,15,11,13,2ʹ,3ʹ
octahydrover
nodalin,
epivernodalol,
and
vernonioside [16-19]. The pharmacological
properties of V. amygdalina have been reported to
following antidiabetic [20], antioxidant [12, 21],
antimicrobial[22], antifungal[23], antiplasmodial
[24], cathartic [25], hepatoprotective [26], and
antitumor activity [27, 28].
Vernonia amygdalina Del. is a plant widely
used for application in natural medicine. The study
of medicinal plants starts with the pre-extraction
and the extraction procedures, which is an
important step in the processing of the bioactive
constituents from plant materials. Hence, selection
of proper extraction method needs meticulous
evaluation. Traditional methods such as
maceration and soxhlet extraction are commonly
used in the laboratory research. However,
extensive extraction time, experimental numbers
with low extraction productivity and unstable
results [29]
Response surface methodology is commonly
used to reduce experimental numbers and evaluate
the interaction between the design factors for
improving materials and methods for further
application in many industries. In this study,
optimal conditions for extraction were determined
by RSM to predict the content of phenolic
compounds with maximum antioxidant activity
from V. amydalina Del. leaves.
2 MATERIALS AND METHODS
2.1 Plant Material
Leaves of V. amygdalina were collected at Cu
Chi ward, Ho Chi Minh city in November 2017
and were identified by Botanical department of
Nguyen Tat Thanh University. The leaves of the
plant were air-dried in shade and finely powdered.
2.2 Experimental design
Experimental variables of extraction process
were performed based on RSM combined with
Box-Behnken design for extraction of polyphenols
and antioxidant activity from V. amygdalina
leaves. The variables were designed of three levels
(lower, middle and higher value, being coded as
−1, 0 and +1) (Table 1) and a total of 15 runs
including 3 at central experiments were carried out
to optimize the level of chosen variables, such as
extraction temperature (X1, oC), extraction time
(X2, hour) and solvent to sample ratio (X3, g/ml)
(Table 2). The total polyphenol content (Y1), total
flavonoid content (Y2), radical scavenging activity
(DPPH) (Y3) and ferric ion reducing antioxidant
power (Y4) were expressed individually as a
function of the independent variables. The
generalized second-order polynomial model used
in the response surface analysis as follows:
3
3
2
i 1
i 1
i 1
Y 0 i X i ii X i2
3
X X
j i 1
ij
i
j
(1)
where Y is the predicted response, β0, βi, βii, and
βij are the regression coefficients for the intercept,
linearity, square, and interaction, respectively, Xi
and Xj (i=1–3, j=1–3 and i≠j) are the independent
variables.
The analysis of variance (ANOVA) using
Design Expert trial version 7.0.0 (State Ease, Inc.)
was carried out to determine maximal values of
reponses. The significance of all the terms of
polynomial equation was analyzed statistically by
computing the P-value < 0.05.
Table 1. Independence factors and corresponding levels
Independent variables
Extraction temperature (X1)
Extraction time (X2)
Solvent-to-material ratio (X3)
Unit
o
C
hour
ml/g
Values of coded
levels
-1
0
+1
45.0
52.5
60.0
16.0
32.0
48.0
20.0
40.0
60.0
2.3 Chemicals and Reagents
Folin-ciocalteu, gallic acid, quercetin, 2,2diphenyl-1-picrylhydrazyl
(DPPH),
2,4,6tripyridyl triazine (TPTZ), luteolin, apigenin,
aluminium chloride (AlCl3), and sodium carbonate
(Na2CO3) were purchased from Sigma Aldrich
(Singapore). All the chemicals were analytical
grades.
TẠP CHÍ PHÁT TRIỂN KHOA HỌC VÀ CÔNG NGHỆ KỸ THUẬT & CÔNG NGHỆ, TẬP 1, SỐ 3, 2018
39
Table 2. Box–Behnken design matrix and experimental responses
Variables
Runs
X1
(oC)
1
2
3
4
5
6
7
8
9
10
11
12
13
14
15
X2
(hour)
Polyphenol
Content
(Y1)
X3
(ml/g)
Flavonoid
content
(Y2)
Antioxidant
activity
(Y3)
Ferous reducing
activity
(Y4)
52.5
32.0
40.0
135.18
97.85
1.91
5.87
45.0
16.0
40.0
84.59
69.70
1.20
2.05
52.5
32.0
40.0
139.07
98.93
1.97
5.96
60.0
32.0
60.0
106.96
67.57
1.51
3.52
45.0
32.0
20.0
81.55
68.47
1.15
2.08
52.5
16.0
20.0
88.21
67.39
1.25
3.41
52.5
32.0
40.0
137.14
98.68
1.94
5.94
45.0
32.0
60.0
89.30
75.13
1.26
2.67
60.0
32.0
20.0
88.77
59.47
1.25
2.65
60.0
16.0
40.0
87.22
55.66
1.23
2.55
60.0
48.0
40.0
114.75
66.49
1.62
2.96
52.5
48.0
20.0
94.83
77.15
1.34
3.19
52.5
16.0
60.0
88.21
80.21
1.25
3.66
45.0
48.0
40.0
86.37
71.06
1.22
2.24
52.5
48.0
60.0
116.08
83.70
1.64
4.46
Y1 = mg gallic acid/g dw; Y2 = mg quercetin/g dw; Y3 = mg ascorbic acid/g dw; Y4 = mg FeSO4/g dw
2.4 Determination of total phenolic content
The total phenolic content of the extract was
determined by the Folin–Ciocalteu method [30].
Samples (0.5 ml) were introduced into test tubes,
mixed thoroughly with 2.5 ml of Folin–Ciocalteu
reagent for 5 min, followed by the addition of 2 ml
of 20% (w/v) sodium carbonate. The mixture was
allowed to stand for a further 90 min in the dark at
room temperature, and absorbance was measured
at 760 nm. The total phenolic content was
calculated from the calibration curve, and the
results were expressed as mg of gallic acid
equivalent per g dry weight.
CxFxV
TFC
Wx(1 - h)
Where C: sample concentration calculated from
calibration curve (mg/ml), F: dilution factor; V:
total volumn of ethanol extract (ml), W: sample
weight (g), h: sample moiture content.
2.5 Determination of total flavonoid content
The total flavonoid content of crude extract was
determined by the aluminium chloride colorimetric
method of Thaipong (2006) [31]. In brief, 1 ml of
crude extract (1 mg/ml ethanol) were mixed with
4 ml of distilled water and then 0.3 ml of 5%
NaNO2 solution; 0.3 ml of 10% AlCl3 solution was
added after 5 min of incubation, and the mixture
was allowed to stand for 2 min. Then, 2 ml of
1 mol/L NaOH solution were added, and the final
volume of the mixture was brought to 10 ml with
double-distilled water. The mixture was allowed to
stand for 15 min, and absorbance was measured at
415 nm. The total flavonoid content was calculated
from a calibration curve established by quercetine
solution 20 – 200 µg/ml, and the result was
expressed as mg rutin equivalent per g dry weight.
CxFxV
TFC
Wx(1 - h)
Where C: sample concentration calculated from
calibration curve (mg/ml), F: dilution factor; V:
total volumn of ethanol extract (ml), W: sample
weight (g), h: sample moiture content.
2.6 DPPH method of antioxidant assay
The antioxidant activity of the extract was
determined by the 1,1-diphenyl-2-picryl-hydrazyl
(DPPH) assay of Yuvaraj (2013) [32] with some
modifications. Briefly, 0.5 ml of each extract (was
diluted with ethanol to suitable concentration)
were mixed with 2,5 ml DPPH solution (0.25 µM)
and incubated in the dark at room temperature for
30 min. A blank containing 2.5 ml of DPPH and
0.5 ml methanol was prepared and treated as the
test samples. The absorbance of the mixture was
then measured at 517 nm. The ability of the
sample to scavenge DPPH radical was determined
from:
DPPH radical scavenging activity (%) = [(Abscontrol
– Abssample)/ Abscontrol]x100
Ascorbic acid with concentrations of 3 – 15
µg/ml was used as a positive control to set up
40
SCIENCE & TECHNOLOGY DEVELOPMENT JOURNAL ENGINEERING & TECHNOLOGY, VOL 1, ISSUE 3, 2018
calibration curve and the result was expressed as
mg ascorbic acid equivalent per g dry weight.
2.7 Ferric ion Reducing Antioxidant Power
(FRAP) Assay
The FRAP assay was conducted according to
the method reported by Benzie and Strain (1999)
[33]. FRAP reagent was prepared freshly by
mixing three solutions, sodium acetate buffer at
pH = 3, 6, 10 mM TPTZ solution in 40 mM
HCl solution and 20 mM ferric chloride (FeCl3)
solution in proportions of 10:1:1 (v/v/v). For the
assay, 0.5 ml of plant extracts was mixed with
2.5 ml of FRAP reagent. The samples were
vortexed for 1 min and incubated in dark for
30 min at 40°C. The absorbance of reaction
mixture was measured at 593 nm. The standard
ferrous sulfate solution (FeSO4) of 10 – 100 µg/ml
was used for calibration curve. The results of
FRAP activity expressed as ferrous equivalent per
g dry weight (mg FeSO4/g dw) were then
extrapolated from the standard curve.
2.8 High pressure liquid chromatography test
condition
The sample (10 mg crude extract) was added
100 ml of methanol: water (1: 1) solution,
ultrasonic extraction in 15 minutes (no heat) and
after that centrifuge 6000 rpm for 10 minutes, take
solution, add 100 ml of 20% acid HCl hydrolyzed
in 3 hours at 85C. Then, the aglycon flavonoids
were extracted by 20 ml of ethyl acetate (x3),
combine the extract, and rotate the solvent. The
residue is dissolved in 3 ml mobile phase. The
sample washed with column Bond Elut C18 SPE
(Agilent - USA) activated by 3ml water. Wash
diluted solution of 5 ml with mobile phase, filter
through PTFE membrane 0.45 µm for
chromatography
injection.
Condition
chromatography analysis was performed using an
Agilent Technologies 1260 infinity I, with a
photodiode array detector (PDA - G1315D) and an
automatic injector. Stationary phase was used a
Zorbax XDB reversed phase (SB-C18 150 x 4.6
mm), 5 μm particle size. The mobile phase
composed of acetonitrile and 1 % phosphoric acid
aqueous solution (68:32, v/v) at a flow rate of 0.7
ml/min. The injection volume was 50 μL and the
temperature was maintained at 40°C during the
analysis. Detection was realized at wavelength
384 nm. Two reference standards, luteolin and
apigenin [12, 34], were simultaneously used in this
experiment as markers.
2.9 Statistical Analysis
Data were expressed as mean ± SD. Statistical
significance was determined by one-way analysis
of variance followed by the Tukey test. was
considered significant.
3 RESULTS AND DISCUSSION
3.1 Effect of extraction variables on total
polyphenol content (TPC)
The experimental data showing the total
phenolic content was 81.55 – 139.07 mg gallic
acid equivalents/g dry weight. The ANOVA
showed the model F value of 182.21 with
probability (p < 0.0001) which implied that the
model was significant and there was only 0.01%
chances that this large F value could occur due to
noise. The coefficient of determination R2 was
0.9970 expressing the strong correlation between
input variables and TPC. Indeed, phenolic content
of extracts was significantly influenced (p <
0.05) by linear (X1, X2, X3), interaction parameters
(X1X2, X1X3, X2X3) and quadratic parameters (X12,
X22, X32) (Table 3). The curved surface plot
(Figure 1a-c) demonstrated the role of three
extraction variables effect positively on TPC at
medium levels of these factors. The final empirical
regression model of their relationship between
responses and the three tested variables could be
expressed by the following quadratic polynomial
equation:
Y1= 137.13 + 6.99X1 + 7.98X2 + 5.90X3 + 6.44X1X2 + 2.61X1X3
+ 5.31X2X3 - 24.54X12 - 19.35X22 - 20.94X32
(2)
3.2 Effect of extraction variables on total
flavonoid content (TFC)
The experimental data showing the total
flavonoid content was 55.66 – 98.93 mg rutin
equivalents/g dry weight. The ANOVA showed
the model F value of 369.62 with probability (p <
0.0001) which implied that the model was
significant and there was only 0.01% chances that
this large F value could occur due to noise. The
coefficient of determination R2 was 0.9985
expressing the strong correlation between input
variables and TPC. Indeed, phenolic content of
extracts was significantly influenced (p < 0.05) by
linear (X1, X2, X3), interaction parameters (X1X2,
X1X3, X2X3) and quadratic parameters (X12, X22,
X32) (Table 3). The curved surface plot (Figure 1ac) demonstrated the role of three extraction
variables effect positively on TPC at medium
levels of these factors. The final empirical
regression model of their relationship between
responses and the three tested variables could be
TẠP CHÍ PHÁT TRIỂN KHOA HỌC VÀ CÔNG NGHỆ KỸ THUẬT & CÔNG NGHỆ, TẬP 1, SỐ 3, 2018
expressed by the following quadratic polynomial
equation:
Y2= 98.49 - 4.40X1 + 3.18X2 + 4.27X3 + 2.27X1X2
+ 0.36X1X3 - 1.571X2X3 - 21.11X12 - 11.65X22 9.72X32
(3)
3.3 Effect of extraction variables on antioxidant
capacity
The antioxidant capacity of the extract was
determined by two methods: DPPH and FRAP
assay. The results of ANOVA analysis showed
that the antioxidant activity significantly affected
by the extraction temperature, extraction time, and
solvent-to-material ratio with three linear effects
41
(X1, X2, X3), three quadratic effects (X12, X22, X32),
and three interactive effects (X1X2, X1X3, X2X3).
The model P value of 0.0001 obtained for the
antioxidant capacity implied that the model is
hingly significant (Table 3). The regression
equation predicted by mathematical models for Y3,
Y4 were given below:
Y3 =1.94 + 0.097X1 + 0.11X2 + 0.084X3 +
0.093X1X2 + 0.037X1X3 + 0.075X2X3 – 0.35X12 –
0.27X22 – 0.30X32
(4)
Y4 = 5.92 + 0.33X1 + 0.15X2 + 0.37X3 +
0.055X1X2 – 0.007X1X3 + 0.26X2X3 – 2.21X12 –
1.26X22 – 0.98X32
(5)
Table 3. ANOVA analysis for model
Source
TPC content
(Y1)
F-Value
P-Value
TFC content
(Y2)
F-Value
Antioxidant
activity
(DPPH) (Y3)
P-Value
F-Value
P-Value
Ferrous reducing power
(FRAP) (Y4)
F-Value
P-Value
Model
182.21
< 0.0001
369.62
< 0.0001
175.58
< 0.0001
1501.80
< 0.0001
X1
X2
X3
X1 X2
X1 X3
106.29
0.0001
195.15
< 0.0001
138.51
75.78
45.13
7.42
30.73
< 0.0001
0.0003
0.0011
0.0416
0.0026
102.11
183.78
28.29
0.65
12.41
0.0002
< 0.0001
0.0031
0.4553
0.0169
99.41
129.43
73.35
44.74
7.35
0.0002
< 0.0001
0.0004
0.0011
0.0422
437.06
87.32
556.88
6.07
9.83
< 0.0001
0.0002
< 0.0001
0.0470
0.0258
29.41
605.44
376.55
440.85
0.950
< 0.0001
< 0.0001
< 0.0001
0.549
0.9970
0.9915
0.9686
2075.91
632.85
440.36
3.465
< 0.0001
< 0.0001
< 0.0001
0.2320
0.9985
0.9958
0.9793
0.0029
< 0.0001
< 0.0001
< 0.0001
0.6148
0.9968
0.9912
0.9699
130.48
9060.61
2948.54
1785.03
0.820
< 0.0001
< 0.0001
< 0.0001
< 0.0001
0.5901
0.9990
0.9960
0.9964
X2 X3
X12
X22
X32
Lack of Fit
R2
Adj R2
Pre R2
The effect of the variables and their interaction
on the antioxidant capacity of the V. amygdalina
leaf extracts is shown in three-demensional
response surface in Figure 1. A higher antioxidant
capacity was obtained in the extraction by
increasing extraction temperature, time and
solvents. However, the yield of antioxidant
compounds tended to reduce at elevated
temperature and elongated time because of the rate
of decomposition of these compounds. The
temperature utilized during extraction influenced
the stability of antioxidant compounds due to
chemical and enzymatic degradation; these factors
have been suggested to be the main mechanisms
underlying reduction of the polyphenol content in
the extraction. Besides, further increase of the
solvent to material ratio may dilute the extraction
solution thereby lowering the antioxidant activity.
591.25
358.40
427.18
0.750
The three-dimensional surface response in
Figure 1 evaluated the relationship between three
input variables and the contribution of each
parameter on the values of responses.
The RSM model and ANOVA analysis showed
that the values of TPC and TFC content and
antioxidant activity were affected proportionally
by three variables: extraction temperature,
extraction time, and solvent-to-material ratio. By
increasing these parameters, the results of
responses tended to decrease due to the
decomposition of phenolic compounds. The
maximum level was determined under the
following experimental conditions: a temperature
of 53.09°C, extraction time of 34.82 hours, and a
solvent-to-material ratio of 43.64 (ml/g). In order
to validate the suitability of the mathematical
model for predicting the optimal response value,
42
SCIENCE & TECHNOLOGY DEVELOPMENT JOURNAL ENGINEERING & TECHNOLOGY, VOL 1, ISSUE 3, 2018
verification experiments were carried out under the
optimal conditions. The values of TPC, TFC
content, antioxidant power (DPPH and FRAP
assay) obtained from experiment were 137.15 ±
1.36 mg gallic/g dw, 96.78 ± 1.39 mg quercetin/g
(a)
dw. 1.95 ± 0.09 mg ascorbic/g dw và 5.90 ± 0.12
mg FeSO4/g dw, respectively. Based on the results,
the experimental values of responses were found to
be quite comparable with predicted values at 95%
confidence level.
(b)
(c)
Design-Expert® Software
Design-Expert® Software
Design-Expert® Software
Total Polyphenol
139.07
Total Polyphenol
139.07
Total Polyphenol
139.07
81.55
81.55
81.55
126
112
Actual Factor
A: Nhiet do = 52.50
98
84
48.00
127
114
88
B: Thoi gian
48.75
C: Ty le DM/Dl
A: Nhiet do
24.00
C: Ty le DM/Dl
B: Thoi gian
Design-Expert® Software
Total Flavonoid
98.93
Total Flavonoid
98.93
55.66
99
55
48.00
60.00
40.00
83.5
67
60.00
56.25
32.00
Actual Factor
B: Thoi gian = 32.00
75.25
48.75
C: Ty le DM/Dl
60.00
50.00
30.00
24.00
56.25
40.00
32.00
C: Ty le DM/Dl
B: Thoi gian
52.50
30.00
(h)
Design-Expert® Software
Design-Expert® Software
Total antioxydase
1.97
Total antioxydase
1.97
Total antioxydase
1.97
1.15
1.15
1.97
1.97
Total antioxydase = 1.97
Std # 14 Run # 3
X1 = A: Nhiet do = 52.50
X2 = C: Ty le DM/Dl = 40.00
X1 = B: Thoi gian
X2 = C: Ty le DM/Dl
Total antioxydase
1.78
Actual Factor
A: Nhiet do = 52.50
1.39
1.20
1.79
Actual Factor
B: Thoi gian = 32.00
1.61
1.43
1.25
Total antioxydase
1.97
1.59
A: Nhiet do
(i)
Design-Expert® Software
1.15
48.75
20.00 45.00
20.00 16.00
(g)
Total antioxydase
58
40.00
40.00
A: Nhiet do
79
68.5
60.00
48.00
50.00
52.50
16.00 45.00
89.5
Total Flavonoid
Actual Factor
A: Nhiet do = 52.50
66
Total Flavonoid = 98.93
Std # 14 Run # 3
X1 = A: Nhiet do = 52.50
X2 = C: Ty le DM/Dl = 40.00
91.75
Total Flavonoid
Total Flavonoid
100
100
Total Flavonoid = 98.68
Std # 13 Run # 7
X1 = B: Thoi gian = 32.00
X2 = C: Ty le DM/Dl = 40.00
77
A: Nhiet do
55.66
55.66
88
48.75
(f)
Total Flavonoid
98.93
Actual Factor
C: Ty le DM/Dl = 40.00
52.50
30.00
20.00 45.00
Design-Expert® Software
Total antioxydase = 1.97
Std # 14 Run # 3
X1 = A: Nhiet do = 52.50
X2 = B: Thoi gian = 32.00
56.25
40.00
(e)
24.00
60.00
50.00
Design-Expert® Software
B: Thoi gian
81
20.00 16.00
(d)
Actual Factor
C: Ty le DM/Dl = 40.00
95.75
32.00
30.00
16.00 45.00
Total Flavonoid = 98.68
Std # 13 Run # 7
X1 = A: Nhiet do = 52.50
X2 = B: Thoi gian = 32.00
110.5
40.00
40.00
52.50
24.00
125.25
60.00
48.00
50.00
56.25
32.00
Actual Factor
B: Thoi gian = 32.00
101
60.00
60.00
40.00
Total Polyphenol = 139.07
Std # 14 Run # 3
X1 = A: Nhiet do = 52.50
X2 = C: Ty le DM/Dl = 40.00
Total Polyphenol
Total Polyphenol = 139.07
Std # 14 Run # 3
X1 = B: Thoi gian = 32.00
X2 = C: Ty le DM/Dl = 40.00
Total Polyphenol
Total Polyphenol
Actual Factor
C: Ty le DM/Dl = 40.00
140
140
140
Total Polyphenol = 139.07
Std # 14 Run # 3
X1 = A: Nhiet do = 52.50
X2 = B: Thoi gian = 32.00
1.76
1.56
1.35
1.14
60.00
48.00
60.00
60.00
40.00
B: Thoi gian
48.00
50.00
56.25
32.00
24.00
48.75
C: Ty le DM/Dl
A: Nhiet do
30.00
24.00
C: Ty le DM/Dl
B: Thoi gian
(m)
Design-Expert® Software
Frap value
5.96
Frap value
5.96
Frap value
5.96
2.05
2.05
A: Nhiet do
2.05
6.00
5.00
4.00
Actual Factor
A: Nhiet do = 52.50
3.00
Frap value
Frap value = 5.96
Std # 14 Run # 3
X1 = B: Thoi gian = 32.00
X2 = C: Ty le DM/Dl = 40.00
6.00
Frap value = 5.94
Std # 13 Run # 7
X1 = A: Nhiet do = 52.50
X2 = C: Ty le DM/Dl = 40.00
5.28
4.55
Actual Factor
B: Thoi gian = 32.00
3.83
3.10
2.00
48.00
60.00
60.00
48.00
40.00
56.25
40.00
32.00
52.50
48.75
A: Nhiet do
5.00
4.00
3.00
2.00
50.00
40.00
Frap value
6.00
Frap value
48.75
(l)
Design-Expert® Software
24.00
30.00
20.00 45.00
Design-Expert® Software
B: Thoi gian
52.50
20.00 16.00
(k)
Actual Factor
C: Ty le DM/Dl = 40.00
56.25
40.00
32.00
16.00 45.00
Frap value = 5.96
Std # 14 Run # 3
X1 = A: Nhiet do = 52.50
X2 = B: Thoi gian = 32.00
60.00
50.00
40.00
40.00
52.50
C: Ty le DM/Dl
32.00
30.00
24.00
20.00 16.00
B: Thoi gian
60.00
60.00
50.00
56.25
40.00
C: Ty le DM/Dl
52.50
30.00
48.75
A: Nhiet do
20.00 45.00
16.00 45.00
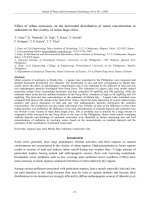
Figure 1. The three-dimensional response surface for TPC (1a-c), TFC (1d-f), antioxidant activity (1g-i) and ferrous reducing
antioxidant power (1k-l)
TẠP CHÍ PHÁT TRIỂN KHOA HỌC VÀ CÔNG NGHỆ KỸ THUẬT & CÔNG NGHỆ, TẬP 1, SỐ 3, 2018
43
Figures 2, retention time of luteolin (6.45),
apigenin (9.99) and the respective UV spectra are
shown in Figures 3. The result identified that the
contents of luteolin and apigenin were 3.76 and
2.47 (mg/g dw) respectively.
3.4 Analysis of the ethyl acetate fraction by
HPLC
The HPLC chromatographic conditions allowed
the determination of the flavonoid content in the
hydrolyzed extract from V. amygdalina leaves. In
DAD1 A, Sig=348,4 Ref=off (D:\METHOD\SV UYÊN\STANDARD_26.D)
DAD1 A, Sig=348,4 Ref=off (D:\METHOD\SV UYÊN\SAMPLE_21.D)
10
10
7.5
7.5
5
5
2.5
2.5
37.177 - Unknown
12.5
31.676 - Unknown
12.5
(b)
18.245 - Unknown
15
10.036 - Apigenin
17.5
(a)
6.487 - Luteolin
6.457 - Luteolin
15
9.997 - Apigenin
17.5
6.009- Unknown
mAU
mAU
0
0
0
10
20
30
40
min
50
0
10
20
30
40
min
50
Figure 2. HPLC chromatogram of (a) apigenin and luteolin reference standards and (b) the hydrolyzed sample of V. amygdalina.
*DAD1, 6.389 (7.4 Fl, - ) Ref= 6.303 & 7.256 of STANDARD_26.D
*DAD1, 6.443 (24.9 Fl, - ) Ref= 6.303 & 7.256 of STANDARD_26.D
*DAD1, 6.489 (33.9 Fl, - ) Ref= 6.303 & 7.256 of STANDARD_26.D
*DAD1, 6.543 (21.8 Fl, - ) Ref= 6.303 & 7.256 of STANDAD_26.D
*DAD1, 6.603 (6.1 Fl, - ) Ref= 6.303 & 7.256 of STANDARD_26.D
220
240
260
280
300
*DAD1, 9.954 (7.5 Fl, - ) Ref= 9.740 & 11.314 of STANDARD_26.D
*DAD1,10.027 (23.6 Fl, - ) Ref= 9.740 & 11.314 of STANDARD_26.D
*DAD1,10.094 (33.3 Fl, - ) Ref= 9.740 & 11.314 of STANDARD_26.D
*DAD1,10.174 (22.0 Fl, - ) Ref= 9.740 & 11.314 of STANDARD_26.D
*DAD1,10.260 (6.3 Fl, - ) Ref= 9.740 & 11.314 of STANDARD_26.D
(a)
320
340
360
380
nm
*DAD1 A, Sig=348,4 Ref=off (D:\METHOD\SV UYÊN\STANDARD_26.D)
*Similarity curve, mean level 999.968 (999.775-999.999) of DAD1, 6.440 (12.1 Fl, - ) Ref= 6.287 & 7.103 of STANDARD_26
*Threshold curve, mean level 999.991 (999.934-999.999) of DAD1, 6.440 (12.1 Fl, - ) Ref= 6.287 & 7.103 of STANDARD_26
*Similarity curve, mean level 999.968 (999.775-999.999) of DAD1, 6.440 (12.1 Fl, - ) Ref= 6.287 & 7.103 of STANDARD_26
'
'
'
'
(d)
|
|
|
|
'
Calculated
'
'
'
'
|
|
'
Calculated
--------+++++++++++-------+++++++++++++++
6.25
nm
220
240
260
280
300
320
340
360
380
*DAD1 A, Sig=348,4 Ref=off (D:\METHOD\SV UYÊN\STANDARD_26.D)
*Similarity curve, mean level 999.990 (999.855-1000.000) of DAD1, 9.953 (54.7 Fl, - ) Ref= 9.700 & 11.227 of STANDARD_26
*Threshold curve, mean level 999.994 (999.884-1000.000) of DAD1, 9.953 (54.7 Fl, - ) Ref= 9.700 & 11.227 of STANDARD_26
*Similarity curve, mean level 999.990 (999.855-1000.000) of DAD1, 9.953 (54.7 Fl, - ) Ref= 9.700 & 11.227 of STANDARD_26
(c)
|
|
(b)
6.5
++++++-------++++++++++++++++++++++++---++++++++++++++++++++++++++++++++------6.75
7
7.25
min
10
10.5
11
min
Figure 3. UV spectra of (a) apigenin, (b) luteolin, and the purity of (c) apigenin and (d) luteoli
4 CONCLUSION
Response surface methodology with central
composite design (RSM-CCD) on Desige Expert
software is a powerful mathematical technique
being widely used in research for optimizing
experimental models because of reducing the
number of experiments, proceeding time and
evaluting the relationship between the responses
and input variables as well as finding out the
optimal solutions as suggested by the software.
The experimental designs were found to be
adequate to predict the extraction process of
phenolic compounds with antioxidant activity from
V. amygdalina Del. leaves. Optimal extraction
conditions were found when the following
parameters were applied: a temperature of 53.09
°C, extraction time of 34.82 hours, and a solventto-material ratio of 43.64 (ml/g).
REFERENCES
[1]
V. Lobo, A. Patil, A. Phatak and N. Chandra, "Free
radicals, antioxidants and functional foods: Impact on
human health." Pharmacognosy reviews. vol. 4, no. 8,
pp. 118, 2010.
44
[2]
[3]
[4]
[5]
[6]
[7]
[8]
[9]
[10]
[11]
[12]
[13]
[14]
[15]
[16]
[17]
SCIENCE & TECHNOLOGY DEVELOPMENT JOURNAL ENGINEERING & TECHNOLOGY, VOL 1, ISSUE 3, 2018
Young and J. Woodside, "Antioxidants in health and
disease." Journal of clinical pathology. vol. 54, no. 3,
pp. 176-186, 2001.
L. Stefanis, R.E. Burke and L.A. Greene, "Apoptosis in
neurodegenerative disorders." Current opinion in
neurology. vol. 10, no. 4, pp. 299-305, 1997.
B. Frei, R. Stocker and B.N. Ames, "Antioxidant
defenses and lipid peroxidation in human blood plasma."
Proceedings of the National Academy of Sciences. vol.
85, no. 24, pp. 9748-9752, 1988.
Kontush, et al., "Influence of vitamin E and C
supplementation on lipoprotein oxidation in patients
with Alzheimer’s disease." Free Radical Biology and
Medicine. vol. 31, no. 3, pp. 345-354, 2001.
R.J. Sokol, "Vitamin E deficiency and neurologic
disease." Annual review of nutrition. vol. 8, no. 1, pp.
351-373, 1988.
Meister, "Glutathione-ascorbic acid antioxidant system
in animals." Journal of Biological Chemistry-Paper
Edition. vol. 269, no. 13, pp. 9397-9400, 1994.
D.F. Birt, S. Hendrich and W. Wang, "Dietary agents in
cancer prevention: flavonoids and isoflavonoids."
Pharmacology & Therapeutics. vol. 90, no. 2, pp. 157177, 2001.
W.-Y. Huang, Y.-Z. Cai and Y. Zhang, "Natural Phenolic
Compounds from Medicinal Herbs and Dietary Plants:
Potential Use for Cancer Prevention." Nutrition and
Cancer. vol. 62, no. 1, pp. 1-20, 2009.
Y. Cai, Q. Luo, M. Sun and H. Corke, "Antioxidant
activity and phenolic compounds of 112 traditional
Chinese medicinal plants associated with anticancer."
Life Sciences. vol. 74, no. 17, pp. 2157-2184, 2004.
R.A. Floyd, "Neuroinflammatory processes are important
in neurodegenerative diseases: an hypothesis to explain
the increased formation of reactive oxygen and nitrogen
species as major factors involved in neurodegenerative
disease development." Free Radical Biology and
Medicine. vol. 26, no. 9-10, pp. 1346-1355, 1999.
G.O. Igile, et al., "Flavonoids from Vernonia amygdalina
and their antioxidant activities." Journal of Agricultural
and Food Chemistry. vol. 42, no. 11, pp. 2445-2448,
1994.
O.R. Alara, N. Abdurahman, S.A. Mudalip and O.
Olalere, "Phytochemical and pharmacological properties
of Vernonia amygdalina: a review." Journal of Chemical
Engineering and Industrial Biotechnology V2. vol. 80,
no. pp. 96, 2017.
S.K. Yeap, et al., "Vernonia amygdalina, an
ethnoveterinary and ethnomedical used green vegetable
with multiple bio-activities." Journal of medicinal plants
research. vol. 4, no. 25, pp. 2787-2812, 2010.
D. Alabi, M. Onibudo and N. Amusa, "Chemicals and
nutritional composition of four botanicals with
fungitoxic properties." World J. Agric. Sci. vol. 1, no. 1,
pp. 84-88, 2005.
P. Erasto, D.S. Grierson and A.J. Afolayan, "Bioactive
sesquiterpene lactones from the leaves of Vernonia
amygdalina." Journal of Ethnopharmacology. vol. 106,
no. 1, pp. 117-120, 2006.
X. Luo, et al., "Isolation and structure determination of a
sesquiterpene lactone (vernodalinol) from Vernonia
amygdalina extracts." Pharmaceutical biology. vol. 49,
no. 5, pp. 464-470, 2011.
[18] M.M. Khalafalla, et al., "Antileukemia activity from root
cultures of Vernonia amygdalina." Journal of Medicinal
Plants Research. vol. 3, no. 8, pp. 556-562, 2009.
[19] M.A. Huffman, et al., "Further Obervations on the Use of
the Medicinal Plant, Vernonia amygdalina (Del). By a
Wild Chimpanzee, Its Possible Effect on Parasote Load,
and Its Phytochemistry." vol. no. pp. 1993.
[20] P. Akah and C. Okafor, "Blood sugar lowering effect of
Vernonia amygdalina Del, in an experimental rabbit
model." Phytotherapy Research. vol. 6, no. 3, pp. 171173, 1992.
[21] P. Erasto, D.S. Grierson and A.J. Afolayan, "Evaluation
of antioxidant activity and the fatty acid profile of the
leaves of Vernonia amygdalina growing in South
Africa." Food Chemistry. vol. 104, no. 2, pp. 636-642,
2007.
[22] D.A. Akinpelu, "Antimicrobial activity of Vernonia
amygdalina leaves." Fitoterapia. vol. 70, no. 4, pp. 432434, 1999.
[23] N. Ogbebor, A. Adekunle and D. Enobakhare, "Inhibition
of Colletotrichum gloeosporioides (Penz) Sac. causal
organism of rubber (Hevea brasiliensis Muell. Arg.) leaf
spot using plant extracts." African Journal of
Biotechnology. vol. 6, no. 3, pp. 2007.
[24] L. Tona, et al., "In vitro antiplasmodial activity of
extracts and fractions from seven medicinal plants used
in the Democratic Republic of Congo." Journal of
Ethnopharmacology. vol. 93, no. 1, pp. 27-32, 2004.
[25] S.O. Awe, J.M. Makinde and O.A. Olajide, "Cathartic
effect of the leaf extract of Vernonia amygdalina."
Fitoterapia. vol. 70, no. 2, pp. 161-165, 1999.
[26] E.M. Arhoghro, K. Ekpo, E. Anosike and G. Ibeh,
"Effect of aqueous extract of bitter leaf (Vernonia
Amygdalina Del) on carbon tetrachloride (CCl4)
induced liver damage in albino Wistar rats." European
Journal of Scientific Research. vol. 26, no. 1, pp. 122130, 2009.
[27] L.J. Gresham, J. Ross and E.B. Izevbigie, "Vernonia
amygdalina: Anticancer Activity, Authentication, and
Adulteration Detection." International Journal of
Environmental Research and Public Health. vol. 5, no.
5, pp. 342-348, 2008.
[28] O. Owoeye, et al., "Another anticancer elemanolide from
Vernonia amygdalina Del " International Journal of
Biological and Chemical Sciences. vol. 4, no. 4, pp. 226234, 2010.
[29] N. Azwanida, "A review on the extraction methods use in
medicinal plants, principle, strength and limitation.”
Med. Aromat. Plants. vol. 4, no. 3, pp. 3-8, 2015.
[30] S.A. Baba and S.A. Malik, "Determination of total
phenolic and flavonoid content, antimicrobial and
antioxidant activity of a root extract of Arisaema
jacquemontii Blume." Journal of Taibah University for
Science. vol. 9, no. 4, pp. 449-454, 2015.
[31] K. Thaipong, et al., "Comparison of ABTS, DPPH,
FRAP, and ORAC assays for estimating antioxidant
activity from guava fruit extracts." Journal of food
composition and analysis. vol. 19, no. 6-7, pp. 669-675,
2006.
[32] P. Yuvaraj, et al., "Attenuation of expression of
cytokines, oxidative stress and inflammation by
hepatoprotective phenolic acids from Thespesia
populnea Soland ex Correa stem bark." Ann. Phytomed.
vol. 2, no. pp. 47-56, 2013.
TẠP CHÍ PHÁT TRIỂN KHOA HỌC VÀ CÔNG NGHỆ KỸ THUẬT & CÔNG NGHỆ, TẬP 1, SỐ 3, 2018
[33] I.F. Benzie and J. Strain, [2] Ferric reducing/antioxidant
power assay: Direct measure of total antioxidant activity
of biological fluids and modified version for
simultaneous measurement of total antioxidant power
and ascorbic acid concentration, in Methods in
enzymology. 1999, Elsevier. p. 15-27.
[34] Y.-R. KU, et al., "Analysis of flavonoids in Vernonia
paltula by high-performance liquid chromatography."
Journal of Food and Drug Analysis. vol. 10, no. 3, pp.
2002.
Dinh Chung Duong Author was born in Phu
Rieng district, Binh Phuoc province, Vietnam in
1988. He received the B.S. degrees in analytical
chemistry from Industrial University of Ho Chi
Minh City, in 2012, and in Pharmacy from
University of Medicine and Pharmacy, Ho Chi
Minh city, in 2016.
From 2012 to 2018, he was Laboratory
Manager and Research Assistant with the Central
Laboratory, Falculty of Pharmacy, Nguyen Tat
Thanh Univeristy. He is the author of 5 articles.
His research interests include natural chemistry
field,
and
spectroscopic
and
liquid
chromatographic methods.
Ngoc Yen Nguyen Author was born in My Tho
city, Tien Giang province, Vietnam in 1988. She
received the B.S. and M.S. degrees in preparation
and pharmaceutical technology from University of
Medicine and Pharmacy, Ho Chi Minh city, in
2014.
45
From 2012 to 2014, she was Research
Assistant with Microbiological Technology
Laboratory, Falculty of Pharmacy, University of
Medicine and Pharmacy, Ho Chi Minh city. From
2014 to 2018: she was Researcher with
Microbiology and Parasitology department,
Falculty of Pharmacy, Nguyen Tat Thanh
Univeristy. She is the author of 6 articles. Her
research interests include fundamental study of
natural compound isolation and bioactivities,
antimicrobial
resistance,
and
optimization of fermentation medium and process
conditions.
Hung Lam Hoa Author was born in Ho Chi Minh
city, Vietnam in 1980. He received the B.E. and
M.E. degrees in Chemical – Food Engineering
from Ho Chi Minh City University of Technology
in 2003 and 2008.
From 2008 to 2009, he was a lecturer of
analytical chemistry in Falculty of Pharmacy,
Nguyen Tat Thanh Univeristy. From 2009 – 2018,
he was a lecturer and also researcher with
Department of Physico-chemical Engineering,
Faculty of Chemical Engineering, Hochiminh City
University of Technology. He is the author of 7
articles. His research interests include analytical
chemistry of metals, electroanalytical chemistry,
electroplating of metal and advanced oxidation
process for wastewater treatment.
46
SCIENCE & TECHNOLOGY DEVELOPMENT JOURNAL ENGINEERING & TECHNOLOGY, VOL 1, ISSUE 3, 2018
Ảnh hưởng của điều kiện chiết xuất đến
hoạt tính chống oxy hóa của cây lá đắng
(Vernonia amygdalina Del.; Asteraceae)
Dương Đình Chung1,*, Nguyễn Thị Ngọc Yến1, Lâm Hoa Hùng2
Trường Đại học Nguyễn Tất Thành
Trường Đại học Bách Khoa, ĐHQG-HCM
*Tác giả liên hệ:
1
2
Ngày nhận bản thảo: 06-11-2017; Ngày chấp nhận đăng: 17-12-2018; Ngày đăng: 30-12-2018
Tóm tắt—Trong nghiên cứu này, sự ảnh hưởng
của các điều kiện chiết lên hoạt tính kháng oxy hóa
của cây lá đắng Vernonia amygdalina Del.
(Asteraceae) được đánh giá bởi Phương pháp đáp
ứng bề mặt và thiết kế cấu trúc có tâm (RSM-CCD)
để dự đoán hàm lượng các hoạt chất phenolic đạt
hoạt tính kháng oxy hóa cực đại. Hàm lượng phenol
và flavonoid tổng cộng được xác định bằng phương
pháp quang phổ, đặc biệt hàm lượng flavonoid được
xác định bằng hệ thống HPLC-DAD. Hoạt tính
kháng oxy hóa được xác định bằng phương pháp
DPPH và FRAP. Kết quả cho thấy thời gian chiết,
nhiệt độ chiết và tỉ lệ dung môi/ nguyên liệu ảnh
hưởng có ý nghĩa trên hàm lượng phenolic (p <
0,001). Tương tác giữa 3 yếu tố trên có ý nghĩa thống
kê (p = 0,05). Tiến hành đánh giá lại mô hình trên
thực nghiệm cho thấy hàm lượng polyphenol đạt
137,15 ± 1,36 mg gallic acid /g, hàm lượng flavonoid
đạt 96,78 ± 1,39 mg quercetin/g, hoạt tính kháng oxy
hóa đạt 1,95 ± 0,09 mg ascorbic acid/g, hoạt tính khử
sắt đạt 5,90 ± 0,12 mg FeSO4/g ở điều kiện tối ưu là
thời gian chiết 34,82 giờ ở nhiệt độ 53,09°C với tỉ lệ
dung môi/ nguyên liệu 43,64 (ml/g). Hệ số tương
quan giữa giá trị dự đoán và giá trị thực cao hơn
0,995 chứng tỏ rằng mô hình hồi quy mang tính đại
diện tốt cho dữ liệu trong thực nghiệm. Kết quả
HPLC cho thấy lá mật gấu có chứa ít nhất là 6
flavonoid, hai trong số đó là apigenin và luteolin.
Flavonoid apigenin và luteolin được tìm thấy với
nồng độ cao trong lá khô: apigenin (2,72 mg/g) và
luteolin (3,76 mg/g).
Từ khóa—Vernonia amygdalina Del., điều kiện chiết, polyphenol, hoạt tính kháng oxy hóa,
stress oxy hóa.