Assessment of the impacts of climate change on groundwater resources in Ca Mau peninsula
Bạn đang xem bản rút gọn của tài liệu. Xem và tải ngay bản đầy đủ của tài liệu tại đây (1.3 MB, 10 trang )
TẠP CHÍ PHÁT TRIỂN KHOA HỌC VÀ CÔNG NGHỆCHUYÊN SAN KỸ THUẬT & CÔNG NGHỆ, TẬP 1, SỐ 1, 2018
43
Assessment of the impacts of climate change on
groundwater resources in Ca Mau peninsula
Dao Hong Hai, Nguyen Dinh Tu
Abstract— A quantitative assessment of impacts of
groundwater abstraction and climate change on
groundwater resources in Ca Mau peninsula by
using groundwater flow and transportation models is
presented. Intensive and uncontrolled groundwater
abstraction activities and climate change in research
area caused reduction of groundwater level and
saline water intrusion in aquifer system. The existing
groundwater abstraction was inventoried and the
aquifer system is characterized. Seasonally
groundwater recharge at present and in future under
different scenarios of climate change were calculated
using WetSpass software. Groundwater flow and
transportation models were set up to assess the
impacts of groundwater abstraction and climate
change on groundwater resources (the recharge
outputs calculated by WetSpass software were used
as inputs for these groundwater models). Results
show that, due to groundwater abstraction during a
period of 2000 to 2010, the groundwater level
decrease at the rate of 0.33; 0.31; 1; 0.91; 0.52m/year
for aquifers qp3, qp2-3, qp1, n22, n21 and n13,
respectively; and since 2004, the yearly change of
storage is negative meaning that groundwater
resources is under depletion. Under the different
scenarios of climate change, the groundwater level in
all aquifers decrease at the rate from minimum of
0.016 to maximum of 0.248 m/year; the yearly
change of storage of the whole Ca Mau peninsula in
2090 is negative and groundwater resources still
under depletion; last but not least, the areas having
salt groundwater in all aquifers increased with the
rate from minimum of 17.91 to maximum of 100.65
km2/year.
Index Terms— Climate change, groundwater
recharge Ca Mau peninsula, saltwater intrusion.
Received: October 13th, 2017; Accepted: April 01th, 2018;
Published: April 30th, 2018
This study is supported by HoChiMinh city University of
Technology – VNU-HCM. The number research project is No.
C2016-20-06. The authors would like to acknowledge Division
of Water Resources Planning and Investigation for the South of
Vietnam for supporting data of this project.
Dao Hong Hai - Faculty of Petroleum and Geology
Engineering, Ho Chi Minh City University of Technology,
VNU-HCM.
Nguyen Dinh Tu - Viet Nam National University-HCMC.
Email:
1.
INTRODUCTION
limate change is one of the greatest challenges
in the 21st century. The expressions of climate
change, such as temperature increasing, sea
level rise, ice-melting result negative effects to
quantity and quality of regional water resources.
While climate change impacts surface water
resources directly through changes in the major
long-term climate variables such as precipitation,
air temperature and evapotranspiration, the
relationship between the changing climate
variables and groundwater is more complex and
difficult to estimate.
There is significant evidence showing the
change of global climate. According to the
Intergovernmental Panel on Climate Change
(IPCC, 2001), global mean temperatures have
risen 0.3 – 0.6oC since the late 19th century and
the global sea levels have risen between 10 and
25cm. As a direct consequence of warmer
temperatures, the hydrologic cycle will undergo
significant impact with accompanying changes in
the rates of precipitation and evaporation. The
global temperatures will continue to rise by
between 1.4 and 5.8oC by 2100 relative to 1900
due to the emissions of greenhouse gases. As the
warming continues, it will result numerous
environmental problems.
Fresh water is such a vulnerable, valuable and
finite resource. According to United Nations
Development Program (UNDP), Asia is one of the
most vulnerable and scarce fresh water resources
areas in the world, including Vietnam. It is
predicted that will be scarcer in the future because
of climate change impacts. Those changes will
impact to the annual amount of water flow in
particular areas. Since then, it finally affects to the
groundwater recharge of such areas. Groundwater
recharge is affected by many complex parameters
and processes, which themselves are influenced by
many factors. Precipitation is affected by climatic
factors such as wind and temperature, resulting in
a very complex and dynamic distribution.
C
44
SCIENCE & TECHNOLOGY DEVELOPMENT JOURNAL ENGINEERING & TECHNOLOGY, VOL 1, ISSUE 1, 2018
Groundwater is the huge sources of water for
drinking and irrigation in the area where the
surface water resources are not able to meet the
increasing demand. This is because ground water
is unexposed and slow to respond to change in
precipitation regime and thus acts as a more
resilient buffer against the rapid changes over the
ground. Compared to surface water, groundwater
use often yields larger economic benefits per unit
volume, due to its availability at local level,
drought reliability and good quality requiring
minimal treatment [1].
The use of groundwater has particular
relevance to the availability of many potable-water
supplies because groundwater has a capacity to
balance large swings in precipitation and
associated increased demands during drought and
when surface water resources reach the limits of
sustainability. During extended droughts the
utilization of groundwater for irrigation is
expected to increase, including the intensified use
of non- renewable groundwater resources, which
may impact the sustainability of the resource.
However, global groundwater resources may be
threatened by human activities and the uncertain
consequences of climate change [2].
There are more than 2 billion people depending
on groundwater for their daily supply [3].
Furthermore, groundwater forms the biggest
proportion (97%) of the world’s fresh water
amount. By maintaining surface water systems
through flows into lakes and base flow to rivers,
groundwater performs the important role of
maintaining the biodiversity and habitats of
sensitive ecosystems [4]. The role of groundwater
is becoming even more prominent as the more
accessible surface water resources become less
reliable and increasingly exploited to support
increasing populations and development. Climate
change impacts may add to existing pressure on
groundwater resources by impeding recharge
capacities in some areas.
Climate change impacts to Vietnam are
serious, a challenge to the cause of hunger
eradication and poverty reduction, millennium
development goals, and countries sustainable
development. Most vulnerable sectors and regions
to climate change are water resources, agriculture
and food security, public Health, deltas and coastal
areas. Due to the complexity of climate change and
limitation of our knowledge in climate, both in
Vietnam and in the world, together with the
consideration of mentality, economy, uncertainty
in greenhouse gas emission, the medium scenario
is, therefore, harmonious and recommended for
climate change impacts assessment and action plan
development for Vietnam [5].
Groundwater provides valuable services to the
Ca Mau peninsula. These include the supply of
drinking water to millions and the prevention of
salt water intrusion [6]. About 7.1 million people
depend upon groundwater for drinking. Due to the
going up of population, surface water resources
will not be able to meet the demands, groundwater
extraction has increased rapidly and declining
groundwater levels now pose an immediate threat
to drinking water supplies, farming systems, and
livelihoods in the area. Furthermore, climate
change might add more pressure on groundwater
by affecting groundwater recharge rates and
changes the availability of groundwater.
Although groundwater plays an important role,
there has been quite little research conducted on
groundwater comparing to surface water resources,
especially in the climate change impact assessment
context in Vietnam. Most of the climate change
impact research concentrated on surface water [7].
It is also true in the case of Ca Mau peninsula,
where there are very few studies of climate change
impacts on groundwater. Therefore, investigating
and modeling the temporal variance of rainfall,
both of intensity and frequency, temperature and
associated
changes
in
evaporation
and
evapotranspiration, and the impacts these factors
have on groundwater recharge and resources
across different aquifer types in Ca Mau peninsula
under different climate change scenarios are
needed and urgent. The objectives of this study is
to assess the impacts of groundwater abstraction
and climate changes on groundwater resources
through the change of future climate variables such
as emperature, precipitation, evaporation and sea
levels.
2.
MATERIALS AND METHODS
2.1 Materials
2.1.1 Study location
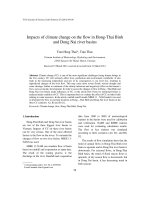
Ca Mau peninsula in Vietnam is of 16.940 km²
area, located at the Southern part of Hau river,
limited by West Sea, East Sea to the South and the
East, Cai San canal, to the Northwest, and Hau
river in the North. Ca Mau peninsula is relative
plain and low. The average elevation is from
0 – 1.0 m. In addition, there are some coastal dune
which are quite high.
TẠP CHÍ PHÁT TRIỂN KHOA HỌC VÀ CÔNG NGHỆCHUYÊN SAN KỸ THUẬT & CÔNG NGHỆ, TẬP 1, SỐ 1, 2018
Figure 1. SEQ Figure \* ARABIC. Map of Ca Mau peninsula
location
2.1.2 Climate
The climate of Ca Mau peninsula (CMP) is
equatorial monsoon climate and is devised in two
seasons: the rainy season and dry season. The
annual rainfall varies from 1,400 – 2,400 mm/year.
Rain time very unevenly distributed in the year,
more than 90% of the annual rainfall is in rainy
season from May to November, and less than 10%
of the annual rainfall is in dry season from
December – April. The open pan evaporation
ranges from 800 to 1,300 mm/year with the lowest
evaporation in October and the highest in March.
The humidity is generally high varying from 75%
during the dry season to more than 90% in the wet
season. The temperature varies between 24-25.5oC
in the coolest month January and 28-30oC in the
hottest month of May.
45
upper Jura - Creta (J3-K) formations. The extrusive
rocks consist of Devon- lower Carbon (D-C1),
Permi- lower Trias (P-T1), upper-middle Trias
(T2-3), and Paleogen (Eocen-Oligocen, E2-3)
formations. The sedimentary formations consists
of middle-upper Miocen (N12-3), upper Miocene
(N13), lower Pliocene (N21), middle Pliocene (N22),
lower Pleistocene (Q11), middle- upper Pleistocene
(Q12-3), upper Pleistocene (Q13), lower- middle
Holocene (Q21-2), middle-upper Holocene (Q22-3),
and upper Holocene (Q23) formations. Each
formations is sub-divided into units that these
dements have differen to rigins. Generally, each
formation has been divided into two parts. The
upper part is composed of a low permeable silt,
clay or silty clay. A lower rather permeable part
consists of fine to coarse sand, gravel, and pebble.
2.1.5
Hydrogeology
There are eight distinguished aquifers in CMP,
namely Holocene (qh), Upper Pleistocene (qp3),
Upper- middle Pleistocene (qp2-3), Lower
Pleistocene (qp1), Middle Pliocene (n22), Lower
Pliocene (n21), Upper Miocene (n13) and UpperMiddle Miocene (n12-3) aquifers. Generally,
lithology of each aquifer consists of fine to coarse
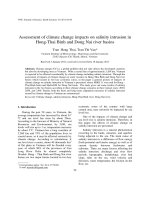
sand, gravel, and pebble. The two cross sections
(Fig.2) illustrated in Fig. 3 and Fig. 4 provide an
overview of the spatial distribution and
interconnection of aquifer system of the CMP’
subsurface. Basically, the aquifer system in CMP
has an artesian basin structure.
2.1.3 Hydrology
CMP river system consists of the natural river
systems and the manmade canal systems. The
main natural river system are Hau river system;
Cai Lon and Cai Be river system. The system of
manmade canals in CMP was developed primarily
during the past century, with the primary purpose
to develop agriculture and transportation.
2.1.4
Geology
Stratigraphy of CMP consists of intrusive,
extrusive rocks and sedimentary formations of
Devon to Quaternary age. They were formed
indifferent tectonic phases. The intrusive and
extrusive rocks act as a basement, while the
sedimentary formations are the cover layers. The
intrusive rocks consist of upper Trias (T 3) and
Figure 2. Cross-section layout
46
SCIENCE & TECHNOLOGY DEVELOPMENT JOURNAL ENGINEERING & TECHNOLOGY, VOL 1, ISSUE 1, 2018
Figure 3. Hydrogeological cross-section I-I
Annual
rainfall
and
seasonal
rainfall
- Annual rainfall increases from 2.3 to 4.4%
(until 2050) and from 5.2 to 10.2% (until
2100).
- Dry sessional rainfall decreases from 2.4 to
8.3% (until 2050) and from 5.5 to 19.3% (until
2100);
- Rainy sessional rainfall increases from 1.6 to
8.8% (until 2050) and from 3.7 to 20.2% (until
2100);
Sea level
rise
- Sea level rises from 26 to 29cm until 2050,
and from 78 to 95cm until 2100.
- Sea level at East Sea rises from 26 to 30cm
until 2050, and from 79 to 99 cm until 2100
- Sea level at West Sea rises from 28 to 32cm
until 2050, and from 85 to 105 cm until 2100.
2.2 Method
Figure 4. Hydrogeological cross-section II-II
2.1.6
Groundwater development
Recent investigation [8]shows that the amount
of groundwater abstraction in CMP is about
999,895 m3/day, of which the amount of
groundwater abstraction in qp3, qp2-3,qp1, n22, n21,
and n1352,528; 650,666; 116,244; 165,210; 3,933;
11,314m3/day, respectively. The number of
abstraction wells is more than 330,998 of which,
about 572 abstraction wells having a capacity of
greater than 200 m3/day.
2.1.7
Climate scenarios
According to MONRE (2012)[9], three
scenarios of climate changes and sea level rise for
Vietnam are summarized in the below table.
Table 1. Summary of three scenarios of climate changes and
sea level rises for Vietnam
Scenario
of
climate
Average
annual
temperat
ure
High emission, A2
- The increase in average annual temperature is
from 1.1 to 1.4℃ (until 2050) and from 2.5 to
3.3℃ (until 2100).
- In dry season: the increase in average
temperature is from 0.9 to 1.4℃ (until 2050);
and from 1.9 to 3.3℃ (until 2100).
- In rainy season: the increase in average
temperature is from 1.2 to 1.6 until 2050; and
from 2.5 to 3.8℃ until 2100.
2.1.8
General framework
The main objective of this study is to evaluate
the impacts of groundwater abstraction and climate
change on groundwater resources. These require
developing a series of model such as water & soil
balances and groundwater model. Firstly, the
scenarios of future climate change will be
generated by Simclim2013. The simulated results
of SimClim are spatial maps of temperature,
precipitation as well as sea levels rise by 2090.
Secondly, present and future climate from the
previous step together with some unchanged input
maps such as land-use, topography, soil texture,
slope and wind-speed are put in a hydrological
model called Wetspass to simulate the present and
future groundwater recharge. Finally, a calibrated
groundwater model using GMS (Groundwater
Modeling System) software will be set up to
estimate the impacts of groundwater abstraction on
groundwater resources. Then the calibrated model
was used to simulate the impacts of climate change
on groundwater resources under scenario A2. The
required inputs of this model are future recharge
from the second step and some other inputs.
Development of present and future climate
scenarios
The monthly data on evaporation, temperature,
rainfall at 14 meteorological stations during period
of 1999-2010 and the monthly data on rainfall at
87 rainfall stations (during period of 1999-2010
were used to build 22 maps of average
evaporation, 22 maps of average temperature, 22
maps of average rainfall on dry and rainy season
for each year from 1999-2010. The monthly data
on abosolute elevation of river stages during a
period of 1999-2010 at 39 hydrological stations
were used to interpolated the absolute average
elevation of river stages in rainy and dry season of
each year.
TẠP CHÍ PHÁT TRIỂN KHOA HỌC VÀ CÔNG NGHỆCHUYÊN SAN KỸ THUẬT & CÔNG NGHỆ, TẬP 1, SỐ 1, 2018
The scenario of future climate (high emission
A2) in evaporation, temperature, rainfall and sea
level generated by SimClim [7] were used to build
the projected 54 maps of average evaporation,
projected 54 maps of average temperature, 54
projected maps of average rainfall, 54 maps of
absolute average elevation of river stages at the 39
hydrological stations and 54 maps of absolute
average elevation of sea level at 30 estuary
locations in rainy and dry season of each ten years
from 2020-2090.
Estimation of groundwater recharge
WetSpass model (Water and Energy Transfer
between Soil, Plants and Atmosphere under quasiSteady State)[10] is used for the estimation of
long-term average spatial patterns of groundwater
recharge, surface runoff and evapotranspiration
employing physical and empirical relationships.
The required inputs of WetSpass model include a
combination of ArcInfo/Arcview tables (dbf files)
and grid files, which are shown as below:
ArcView/ArcInfo Grid files
Soil
Topography
Slope
Land-use (dry and rainy season)
Temperature (dry and rainy season)
Precipitation (dry and rainy season)
Pan evaporation (dry and rainy season)
Wind-speed (dry and rainy season)
Groundwater level(dry and rainy season)
Tables (dbf)
Soil parameter
Runoff Coefficient
Land-use parameter
(dry and rainy season)
In the period of 1999-2010, model for
groundwater recharge estimation is developed by
seasonally, rainy season (from June to November)
and dry season for the rest months. Maps of soil
texture, slope, land-use, topography and windspeed will not be changed during the simulated
period while the rest maps of precipitation,
temperature and evaporation will be the maps of
average evaporation, of average temperature, of
average rainfall in dry and rainy season for each
year of this period. The parameters in the three
input tables (dbf files) will be also unchanged in
order to evaluate clearly the impacts of climate
variables change on groundwater recharge.
The future groundwater recharge will be
simulated by 15 years period namely 2015s (20152030), 2030s (2030-2045), 2045s (2045-2060),
2060s (2060-2075), 2075s (2075-2090). In each
period, groundwater recharge will be estimated by
dry season and wet season respect to the scenario
A2. Required input data for the model contains
maps of land-use for two seasons, soil texture,
slope, topography and wind-speed which are also
unchanged like the period of 1999-2010. The input
maps of temperature, precipitation and evaporation
47
were the maps of average evaporation, of average
temperature, and of average rainfall for each 15
years.
Development of a simulation model
A transient groundwater flow model was
constructed to assess the impacts of groundwater
abstraction to groundwater resources in CMP. The
hydrogeological conceptual model consists of
seven aquifers separated by seven aquitards. The
aquifers and aquitards are heterogeneous and
anisotropic. The hydraulic conductivities were
divided into parameter zones. The vertical
hydraulic conductivities were estimated as onetenth of the horizontal hydraulic conductivities.
The top aquifer is unconfined and the rest aquifers
are confined aquifers. Impermeable basement of
intrusive and extrusive formations were defined in
the north and seashore lines in the west and east
were specified head boundaries. The inflow
components from the top of the aquifer included
direct recharge from precipitation, river and canal
leakage. The discharge components included
evaporation, seepage to river, canals and
abstraction.
The numerical model was constructed using the
conceptual model approach (Brigham Young
University Environmental Modelling Research
laboratory, 2000). The model consists of 14 model
layers and calibration time is 11 years from 2000
to 2010. The domain of the model has an area of
16,940km2. The model grid consists of 134 rows
and 114 columns with a uniform grid size of 1500
x 1500 m. The calibration time was divided into
seasonally stress period resulting 22 stress periods.
The model inputs included model layers elevations
and properties, boundary conditions, recharge and
discharge and initial groundwater levels. The top
elevation of the top layer is land surface elevation
defined by 7.779 points with the coordinates
andelevations.
More than 268 borehole data were analyzed to
create a scatter point file consists of top and
bottom elevations of 14 model layers. Layers of 1,
3, 5, 7, 9, 11, and 13 represented for aquitards or
impervious layers. Layers of 2, 4, 6, 8, 10, 12, and
14 represented for aquifers qh, qp3, qp2-3, qp1, n22,
n21 and n13, respectively (Fig. 5).
48
SCIENCE & TECHNOLOGY DEVELOPMENT JOURNAL ENGINEERING & TECHNOLOGY, VOL 1, ISSUE 1, 2018
Figure 5. Aquifer system in Ca Mau peninsula
Model layer properties consisting of vertically
and horizontally hydraulic conductivities, specific
storage, specific yield…were calculated from the
pumping data of 234 aquifer tests and assigned to
parameter zones. The value of the General Head
boundaries assigned for big rivers, seashore were
collected from 39 hydrological stations. The inputs
for the Specific Head boundaries assigned for the
boundaries of aquifer qp3, qp2-3, qp1, n22, n21 and
n13 are groundwater levels and were interpolated
from measured groundwater level at 94
observation wells. The areal recharge was
calculated using WetSpass model. The seasonally
groundwater abstraction from each aquifer was
gained from the investigation carried out in 2011.
The initial groundwater levels were the
average groundwater levels in 1999 at 94
observation wells in the National Monitoring
Network. The transient model was calibrated with
the
manually
adjustment
of
hydraulic
conductivities, specified head and specific storage
values.
The calculated groundwater levels were
compared with measured groundwater level in
observation wells.
Figure 6. Computed and measured groundwater level at
observation well Q40102t
There are 28 long-term groundwater level
observation wells with complete observation data
from 1999 to 2010; 2 in the first aquifer, 4 in the
second, 7 in the third, 4 in the fourth, 5 in the fifth,
5 in the sixth, and 3 in the seventh. Fig. 6 shows an
example how calculated groundwater level fitting
to the observed groundwater level.
Simulation of the impacts of climate scenarios
The calibrated transient model was used to
simulate the impacts of the climate scenario high
CO2 emission-A2. The simulation time was taken
75years from 2015 to 2090andis divided
into12stress periods of fifteen years and six
months. The calculated groundwater level at
October 2010 was used as the initial conditions.
The 2010 groundwater abstraction pattern and rate
were kept unchanged. Six groundwater models (1
groundwater flow and 1 solute transportation
models) were constructed to assess the impacts of
the climate scenario A2 on groundwater resources.
The groundwater flow model is used to evaluate
the impacts of climate change on the quantity of
groundwater resources. The indicator for
assessment the impacts of climate change on the
quantity of groundwater resources are the decrease
in groundwater levels and depletion of
groundwater storage. The solute transportation
model is used to evaluate the impacts of climate
change on the quality of groundwater resources.
The indicator for assessment the impacts of
climate change on the quality of groundwater
resources is the increase of area having the total
dissolved solid (TDS) greater than 1000 mg/l.
3.
RESULTS
Amount of groundwater recharge
The amounts of groundwater recharge during
the period of 2000-2010 calculated by WetSpass
are shown in Table 2. The amount of groundwater
recharge
varies
from
1,795,546
to
3,574,317m3/day. The amount of groundwater
recharge in the rainy season is greater than that in
the dry season from twofold to sevenfold.
The amounts of groundwater recharge during the
period of 2020-2100 under three different
scenarios of climate calculated by WetSpass are
shown in Table 3. The amount of groundwater
recharge 3,543,892m3/day for scenarios A2. In the
same year, amount of groundwater recharge in
rainy season is greater than that in dry season. In
one scenario, amount of groundwater recharge
decreases in time. The amount of groundwater
recharge decreases from low to high emission
scenarios in period of 2050 – 2100. The amount of
groundwater recharge in period of 2020-2100 is
less than that of 2010. The average reducing rates
TẠP CHÍ PHÁT TRIỂN KHOA HỌC VÀ CÔNG NGHỆCHUYÊN SAN KỸ THUẬT & CÔNG NGHỆ, TẬP 1, SỐ 1, 2018
49
of the amount of groundwater recharge is 28,050
m3/day for scenario A2. The trend of groundwater
recharge in both dry season and rainy season are
decrease.
Table 2. Amount of groundwater recharge during period of
2000 to 2010.
Groundwater recharge, m3/day
Year
In dry season
2000
2001
2002
2003
2004
2005
2006
2007
2008
2009
2010
526,121
390,766
201,959
250,905
176,158
225,511
344,141
325,899
354,552
317,688
185,004
In
rainy
season
2,203,248
1,900,306
1,617,982
2,470,744
1,619,388
2,208,206
2,087,565
3,248,418
2,888,677
2,046,693
2,492,037
For the whole
year
2,729,369
2,291,072
1,819,941
2,721,649
1,795,546
2,433,717
2,431,706
3,574,317
3,243,229
2,364,381
2,677,041
2a
2b
3a
3b
4a
4b
5a
5b
Table 3. Amount of groundwater recharge during period of
2015 to 2090
Year
2015
2030
2045
2060
2075
2090
Groundwater recharge, m3/day Scenario A2
In dry season
In rainy season
1,332,461
1,370,848
1,268,924
1,030,559
934,614
760,415
2,064,297
2,173,044
1,928,317
1,349,204
1,119,243
711,186
Impacts of groundwater
groundwater resources.
For the whole
year
3,396,758
3,543,892
3,197,242
2,379,763
2,053,857
1,471,601
abstraction
on
The indicators for assessing the impacts of
groundwater abstraction on groundwater resources
are the decrease in groundwater levels and
depletion of groundwater storage.
1a
1b
6a
6b
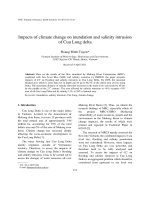
Figure 7. Maps of groundwater levels on 2000 and 2010 in sixs aquifers.
The a and b stand for year 2000 and 2010, respectively; 1, 2, 3, 4, 5, and
6 stand for aquifer qp3, qp2-3, qp1, n22, n21, and n13, respectively.
50
SCIENCE & TECHNOLOGY DEVELOPMENT JOURNAL ENGINEERING & TECHNOLOGY, VOL 1, ISSUE 1, 2018
Fig.7 shows the decrease in groundwater levels
due to groundwater abstraction in all aquifers. It is
clear that the groundwater levels decrease
dramatically in all six aquifers, several cones of
depressions were shaped in the maps of
groundwater level in the year of 2010. The rate of
groundwater level decrease at the center points of
the cones of depression are 2.80, 1.76, 1.24, 1.98,
1.42 and 2.58 m/year for qp3, qp2-3, qp1, n22, n21,
and n13, respectively.
3a
3b
4a
4b
5a
5b
Impacts of climate changes on groundwater
resources.
The indicators for assessing the impacts of
climate changes on groundwater resources are i)
the decrease in groundwater levels, ii) depletion of
groundwater storage and iii) the increase of area
having TDS greater than 1000 mg/l.
Fig.8. shows the differences in groundwater
level on 2010 and on 2100 under different climate
scenarios. It is clear that the cones of depression
are enlarged by 2090 in comparison with those of
2010 for scenario of climate A2. The absolute
values of the differences in groundwater level
between 2015 and 2090 and the rates of decrease
in groundwater levels of the scenario at the center
of the cones of depression for each aquifer are
shown in Table 4.
1a
1b
6a
6b
Figure 8. Maps of groundwater level on 2010 and 2090 under
the climate scenario A2
2a
2b
The differences between groundwater levels of
2015 and 2090 and the rates of decrease in
groundwater levels of aquifer qp3, qp2-3, n22 and n13
are increase. While these of aquifer qp1and n21 is
on the contrary.
TẠP CHÍ PHÁT TRIỂN KHOA HỌC VÀ CÔNG NGHỆCHUYÊN SAN KỸ THUẬT & CÔNG NGHỆ, TẬP 1, SỐ 1, 2018
Table 4. Decrease in groundwater level under the climate
scenario A2
Aquifer
Difference
Average rate of
between
GW decrease
in
levels in the year groundwater level,
of 2015 and 2090
m/year
qp3
10.28
0.114
qp2-3
17.42
0.194
qp1
4.77
0.053
n22
44.51
0.495
n21
1.46
0.016
n13
22.35
0.248
51
The yearly changes in storage of aquifer qh
decreases since 2075, while the yearly changes in
storage of all the rest aquifer have increase. This
means that in the future, the inflow component to
whole aquifer system will be less, and it takes a
very long time for the aquifer system to be rebalanced status. The area having the total
dissolved solid (TDS) in groundwater greater than
1000mg/l is considered to be area having.
Table 5 shows the increase and the average rate
of increase in areas having saline groundwater in
2090 in comparison with that of 2015 of all
aquifers. These areas increase in all aquifer, except
for aquifer qh.
quantified by the groundwater flow and
transportation models. Among the required inputs
for these models, groundwater recharge was
calculated by WetSpass package in which all the
climate change variables such as rainfall,
evaporation, temperature… are included. In order
to improve the accuracy of the models, data for
calibration and validation of WetSpass model to
calculate GW recharge, data of river stages, sea
level, surface water saline intrusion, flood…are
needed to collect. And groundwater abstraction in
future has not yet been included in all scenario
simulations to assess more accuracy the impacts of
both GW abstraction activities and climate change
on GW resources.
The results show that, groundwater abstraction
is of much more strong impacts on groundwater
resources than the climate changes and in the
future groundwater resources of the study area is
under depletion. Therefore, the orientation for
development of groundwater resources in future
should concentrate to reduce the groundwater
abstraction, to improve groundwater potential by
means of artificial recharge and to use more
surface water resources.
Table 5. Increase in area having saline groundwater in 2090 in
comparison with that of 2015
REFERENCES
qp3
2538
28.20
qp2-3
7174
79.71
qp1
5818
64.64
4.
n22
3188
35.43
n21
3156
35.07
n13
3429
38.10
DISCUSSION
The rate of decrease in groundwater levels in
periods of 2000-2010 (impacts by groundwater
abstraction) is greater than that of the periods
2015-2090 are 0.114m/year; 0.194m/year;
0,061 m/year; 0.495 m/year; 0.018 m/year; 0.248
m/year. It is clear that groundwater abstraction is
main reason to make groundwater elevation to
decrease dramatically, and impacts of groundwater
abstraction is much larger than that of climate
changes. The groundwater levels and the yearly
changes in storage are decreased and the yearly
changes in storage is of negative values, while the
areas having TDS values greater than 1000mg/l
increase from low emission scenarios to high
emission scenario. The reasons for that can be
explained by the decrease of groundwater recharge
in future under three scenarios of climate.
5.
CONCLUSION
Impacts of groundwater abstraction and climate
change on groundwater resources in CMP can be
[1] WWAP, "Water for People, Water for Life," 2003.
[2] Treidel, H., Martin, J.L., Jason J.G., "Climate Change
Effects on Groundwater Resources.," in Leiden,
Nertherlands: CRC Press, 2012.
[3] Kemper et al.,, "Comparision of Institutional arrangements
for river basin management in eight basins," World Bank
Research, 2005.
[4] R. E. Tharme, "A global perspective on environmental
flow assessment: emerging trends in the development and
application of environmental flow methodologies for
rivers," River Research and Applications, p. 397–441,
2003.
[5] P. N. Khoi, "Climate Change, Sea Level Rise Scenarios
for Vietnam," 2009.
[6] IUCN, "Groundwater in Mekong Delta," 2011.
[7] Thai. P.H, "Report on the study of the effect of climate
change on water resources in the Mekong Delta.,"
Scentific Institute on Meteorology, Hydrology and
Environment, 2013.
[8] DWRPIS , " Report on the results of the National
Groundwater Monitoring Network for Nam Bo Plain.,"
Division of Water Resources Planning and Investigation
for the South of Vietnam, 2010.
[9] MONRE, " Scenarios of climate changes and sea level rise
for Vietnam," 2012.
[10] Batelaan, O., De Smedt, F, "WetSpass: a flexible, GIS
based, distributed recharge methodology for regional
groundwater modelling. In HP. Gehrels (Ed.) Impact of
Human Activity on Groundwater Dynamics," IAHS press,
52
SCIENCE & TECHNOLOGY DEVELOPMENT JOURNAL ENGINEERING & TECHNOLOGY, VOL 1, ISSUE 1, 2018
pp. 11-17, 2001.
[11] IPCC, "Climate Change 2001: The Scientific Basic,"
2001.
[12] Yangxiao Zhou, Wenpeng Li, "A review of regional
groundwater flow modeling," Geoscience Frontiers 2(2),
pp. 205-214, 2011.
[13] Mary P. Anderson; WilliamW.Woesseer, "(1992) Applied
groundwater modeling.," Academic Press. Inc, 1992.
[14] Quang, N.M, "Climate Change, Sea Level Rise Scenarios
for Vietnam," Ministry of Natural Resources and
Environment, 2012.
[15] Anderson, HR, Hydrogeologic recomaissance of MD in
south Vietnam and Combodia, Water Supply Pap 1608-R.
1978.
[17] DGMS, "Research of geological structure and
classification of N-Q sediment in Mekong Delta," Division
of Geology and Minerals of South of Viet Nam, 2004.
Dao Hong Hai - Faculty of Petroleum and
Geology Engineering, Ho Chi Minh City
University of Technology, VNU-HCM.
Nguyen Dinh Tu - Vietnam National UniversityHCMC.
[16] Yangxiao Zhou , Liya Wang, Jiurong Liu, Wenpeng Li ,
Yuejun Zheng, "Options of sustainable groundwater
development in Beijing Plain, China," Physics and
Chemistry of the Earth 47-48 (2012), pp. 99-113, 2011.
Đánh giá tác động của biến đổi khí hậu đến
tài nguyên nước dưới đất bán đảo Cà Mau
Đào Hồng Hải1, Nguyễn Đình Tứ2
Trường Đại học Bách khoa, ĐHQG-HCM
Đại học Quốc gia Thành phố Hồ Chí Minh
*Tác giả liên hệ:
Ngày nhận bản thảo: 13-10-2017; Ngày chấp nhận đăng: 01-4-2018; Ngày đăng: 30-4-2018
1
2
Tóm tắt -Nghiên cứu đánh giá định lượng tác
động của hoạt động khai thác nước dưới đất và
biến đổi khí hậu đến tài nguyên nước dưới đất
khu vực bán đảo Cà Mau bằng các mô hình
dòng chảy và dịch chuyển biên mặn. Việc khai
thác nước dưới đất không được kiểm soát và
biến đổi khí hậu trong khu vực đã làm suy giảm
mực nước và diện tích phân bố mặn nhạt trong
các tầng chứa nước. lượng bổ cập trong khu
vực được tính toán theo kịch bản biến đổi khí
hậu bằng phần mềm WetSpass. Mô hình dòng
chảy nước dưới đất và dịch chuyển biên mặn
được lập để đánh giá tác động của việc khai
thác nước và biến đổi khí hậu đối với tài
nguyên nước dưới đất. Kết quả cho thấy, do sự
khai thác nước dưới đất giai đoạn 2000-2010,
mức nước ngầm giảm với tỷ lệ 0,33; 0,31; 1;
0,91; 0,52 m/năm đối với tầng chứa nước qp3,
qp2-3, qp1, n22, n21 và n13; và từ năm 2004, việc
thay đổi trữ lượng hàng năm là tiêu cực có
nghĩa là nguồn nước dưới đất đang cạn kiệt.
Theo kịch bản biến đổi khí hậu A2 mực nước
dưới đất ở tất cả các tầng nước ngầm giảm ở
mức từ 0,016 xuống tối đa là 0,248 m/năm; sự
thay đổi trữ lượng toàn bộ bán đảo Cà Mau vào
năm 2090 là tiêu cực và nguồn nước dưới đất
vẫn còn đang cạn kiệt. Diện tích phân bố nước
mặn trong các tầng chứa nước tăng lần lượt là
17,91 đến tối đa là 100,65 km2/năm.
Từ khóa - Biến đổi khí hậu, bổ cập nước dưới đất bán đảo Cà Mau,
xâm nhập mặn nước dưới đất.