Optimizing the placement of a number of D-Statcom for improving SARFIX in the distribution system
Bạn đang xem bản rút gọn của tài liệu. Xem và tải ngay bản đầy đủ của tài liệu tại đây (2.08 MB, 11 trang )
Science & Technology Development Journal – Engineering and Technology, 2(1):22- 32
Research article
Optimizing the placement of a number of D-Statcom for
improving SARFIX in the distribution system
Bach Quoc Khanh*
ABSTRACT
While the users only consider solutions for power quality improvement at a single site, utilities concern about solutions for power quality improvement for not only an individual location, but also for
the whole system. Therefore, the paper deals with an utilities' systematic solution for power quality mitigation by using simultaneously a number of custom power devices in distribution system.
In the paper, a new method is introduced for optimizing the placement of a multiple of Distribution Synchronous Compensation Devices - D-Statcoms for globally mitigating the voltage sags due
to faults in distribution systems according to the ``central improvement'' approach. D-Statcom's
placement is optimally selected in a distribution system basing on a problem of optimization where
the objective function is to minimize the system average rms voltage variation frequency index –
SARFIx of the system of interest. The effectiveness for global voltage sag mitigation in a distribution system by the presence of a number of D-Statcoms is newly modeled basing on the method of
Thevenin's superimposition in the problem of short-circuit calculation in the distribution system.
The presence of D-Statcoms is simulated as the matrix of additionally injected currents to buses
for increasing the voltage of all buses throughout the system of interest. The paper considers the
case of using a multiple of D-Statcoms with a proposed voltage compensating principle that can
be practical for large-size distribution systems. In the paper, the IEEE 33-buses distribution feeder is
used as the test system for global voltage sag simulation in the events of short-circuit in the system
and various influential parameters to the outcomes of the problem of optimization such as rms
voltage threshold and D-Statcom's limited current are considered and discussed.
Key words: Distribution System, Voltage Sag, SARFIX, Distribution Synchronous Compensation –
D-Statcom
School of Electrical Engineering, Hanoi
University of Science and Technology,
Hanoi, Vietnam
Correspondence
Bach Quoc Khanh, School of Electrical
Engineering, Hanoi University of Science
and Technology, Hanoi, Vietnam
Email: khanh.bachquoc@ hust.edu.vn
History
• Received: 23-12-2018
• Accepted: 09-4-2019
• Published: 30-5-2019
DOI :
Copyright
© VNU-HCM Press. This is an openaccess article distributed under the
terms of the Creative Commons
Attribution 4.0 International license.
INTRODUCTION
According to IEEE1159 1 , voltage sag is a phenomenon of power quality (PQ) in which the rms
(root mean square) value of the voltage magnitude
drops below 0.9 p.u. in less than 1 minute. The main
cause which is account of more than 90% voltage sag
events is the short-circuit in the power systems. Solutions for voltage sag mitigation 2,3 have generally been
classified as two approaches 4 named “distributed improvement” and “central improvement” (or systematic improvement). The first is mainly considered
for protecting a single sensitive load while the latter
is introduced for systematically improving PQ in the
distribution system that is mainly interested by utilities. Either approaches have recently used custom
power devices (CPD) 2 such as inverter-based voltage
sources like the distribution static synchronous compensator (D-Statcom) as their cost has gradually decreased.
In reality, researches using D-Statcom for voltage
sag mitigation have mainly been introduced for
“distributed improvement” approach where dynamic
modeling of D-Statcom is developed with main regard
to D-Statcom’s controller design improvement 5–8 for
mitigating PQ issues at a specific load site. The introduction of researches for “central improvement” 4,9–14
that normally deal with the problem of optimizing DStatcom’s location and size are rather limited because
of following difficulties:
i. To find steady-state or short-time modeling of DStatcom for systematic mitigation of PQ issues;
ii. To optimize the use of D-Statcom.
Some researches just deal with voltage quality in
steady-state operation and loss reduction 9–11 . Ali
(2015) deals with the mitigation of various PQ issues including voltage sag using D-Statcom using the
multi-objective optimization approach, but such an
optimization can rarely get the best performance for
voltage sag mitigation only 12 . Zhang (2010) deals directly with voltage sag mitigation, but the modeling of
D-Statcom for short-circuit calculation is still needed
to improve 13 . Khanh (2018) introduced a good modeling of a CPD, but it is the case for dynamic voltage
Cite this article : Khanh B Q. Optimizing the placement of a number of D-Statcom for improving
SARFIX in the distribution system. Sci. Tech. Dev. J. – Engineering and Technology; 2(1):22-32.
22
Science & Technology Development Journal – Engineering and Technology, 2(1):22-32
restorer (DVR) and the optimization of DVR application is just based on voltage sag event index 14 . Khanh
(2019) also considers the performance of only one DStatcom 15 .
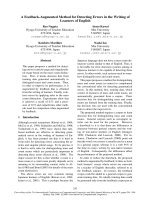
This paper newly extends the method of estimating
the effectiveness of global voltage sag mitigation 15
by the presence of a number of D-Statcoms in the
short-circuit of a distribution system. This method
optimizes the placement of D-Statcoms basing on
minimizing a well-known system voltage sag index –
SARFIX that consider all possible short-circuit events
in a system of interest. In solving the problem of optimization, the modeling of a multiple of D-Statcoms
simultaneously compensating system voltage sag in
short-circuit events is introduced and discussed. The
research uses the IEEE 33-bus distribution system as
the test system. Short-circuit calculation for the test
system as well as the modeling and solution of the
problem of optimization are all programmed in Matlab.
For this purpose, the paper is structured as the following parts: section Method introduces the new method
for modeling of a number of D-Statcoms for system
voltage sag mitigation in the problem of short-circuit
calculation in distribution system with its presence.
Section Problem definition introduces the problem of
optimization. The results are analysed and discussed
in section Result analysis and discussion.
Figure 1: Modeling D-Statcom for voltage sag
mitigation.
So, we have
U˙ L − U˙ sag
I˙DS =
Zth
(2)
where Zth : Thevenin impedance of the system seen
from the D-Statcom (equals ZS in parallel with ZL ).
The typical V-I characteristic of a STATCOM is depicted in Figure 2 showing that the STATCOM’s current can be within the range for a stable output voltage.
If the STATCOM is connected to the location experiencing a deep sag, it can not boost the voltage up to
1p.u. for a given IDSmax . So, we assume that IDS just
takes IDSmax . As the result, the compensated voltage
∆UL is
△U˙ L = I˙DS.max × Zth = U˙ L − U˙ sag < 1 − U˙ sag
METHOD OF MODELING
D-STATCOM WITH LIMITED
CURRENT FOR SHORT-CIRCUIT
CALCULATION IN DISTRIBUTION
SYSTEM
D-Statcom’s basic modeling for voltage sag
mitigation
D-Statcom is a shunt connected FACTS device. The
basic steady-state description of a D-Statcom is popularly given as a current source 3 injecting in a bus
needed for voltage compensation. For mitigating voltage sag due to fault, the load voltage can be seen as
the superposition of the system voltage and the voltage change due to the injected current by D-Statcom
(Figure 1).
In the simplest network (Figure 1a) with one load
(Load impedance: ZL ) fed by one source (Source voltage: US , Source impedance: ZS ), when voltage sag occurs, the load voltage can be boosted to Usag + ∆UL
as D-Statcom injects the current IDS :
U˙ L = U˙ sag + △U˙ L = U˙ sag + I˙DS .Zth
23
(1)
Figure 2: V-I characteristic of a STATCOM
Modeling of a multiple of D-Statcoms for
system voltage sag mitigation
Generality
For modeling the effectiveness of a multiple of DStatcoms for system voltage sag mitigation, Khanh
(2018) introduced the application of the superposition principle according to the Thevenin theorem for
(3)
Science & Technology Development Journal – Engineering and Technology, 2(1):22-32
the problem of short-circuit calculation in distribution system 14 . It’s assumed that the initial state of the
test system is the short-circuit without the presence of
D-Statcoms. However, as the result of the presence of
D-Statcoms, the bus voltage equation should be modified in compliance with Thevenin theorem 16 as follows:
)
([ ]
[U] = [Zbus ] × I 0 + [△I]
[ 0]
= [Zbus ] × I + [Zbus ] × [△I]
[ ]
(4)
= U 0 + [△U]
Where
[Zbus ]: System bus impedance matrix calculated from
the bus admittance matrix: [Zbus ]= [Ybus ]−1 . If the
short-circuit is assumed to have fault impedance, we
can add the fault impedance to [Zbus ].
[U0 ]: Initial bus voltage matrix (Voltage sag during
power system short-circuit)
[I0 ]: Initial injected bus current matrix (Short-circuit
current).
˙
Usag.1
..
.
[ 0]
˙
U = Usag·k
(5)
..
.
U˙ sag.n
˙
If1
.
..
[ 0]
I = I˙f k
..
.
I˙f n
[△U] = [Zbus ] × [△I]
(6)
Figure 3: Test system short-circuit modeling using [Zbus ] with presence of m D-Statcoms (m
Assume that M is the set of m buses to connect to DStatcom (Figure 3), so the column matrix of bus injected current [△I]in ( 8) has m non-zero elements
and n-m zero elements. From (8), for the bus k, k∈M,
we have
(7)
(9)
If the IDS.k large enough, we assume the initial condition of voltage compensation is similar to the research
by Khanh (2018) 14 as follows:
△U˙ k = U˙ k − U˙ sag.k = 1 − U˙ sag.k
˙
∆I1
∆U˙ 1
.
.
..
..
˙
or ∆Uk = [Zbus ] × ∆I˙k (8)
..
..
.
.
∆I˙n
∆U˙ n
DUi : Bus i voltage improvement (i=1÷n) after adding
the custom power devices in the system.
DIi : Additional injected current to the bus i (i=1÷n)
after adding the custom power devices like D -Statcom
in the system.
However, Khanh (2018) proposed the condition of
voltage compensation regardless of the D-Statcom’s
current limitation 14 . For globally improving the voltage sag caused by short-circuit (using SARFIX index),
we have to deal with all possible fault positions and it’s
Placing m D-Statcoms in the test system
△U˙ k = Zkk × I˙DS.k + ∑ j∈M, j̸=k Z jk × I˙DS. j
likely that the fault position is close to the D-Statcom’s
location that requires a big current from it to boost
voltage the the required value. This paper proposes
another method that bases on a limited current from
D-Statcom as follows.
(10)
Replace (10) to (9 ) we have m equations to calculate
m variables I˙DS.k of m D-Statcoms. Solve this system
∗
of m equations, we get m required values of IDS.k
However, as above said, there’re definitely buses that
need large IDS to boost the bus voltage to 1p.u. that
is beyond D-Statcom’s current limit. Therefore, for a
given Statcom’s current limit IDSmax
∗ is smaller than a given I
- If IDS.k
DSmax , we use the
∗ to calculate the voltage upgrade of n-m
value IDS.k
buses without connecting to D-Statcoms (IDS.k =
∗ ).
IDS.k
∗
- If the given IDSmax is smaller than IDS.k
we use the
given value IDSmax as the current the D-Statcom injects in bus k (IDS.k = IDSmax ) to calculate the voltage upgrade of n-m buses without connecting to DStatcoms and system voltage as (11).
△U˙ i = ∑ni=1 Zik × I˙DS.k
(11)
24
Science & Technology Development Journal – Engineering and Technology, 2(1):22-32
And finally, the system bus voltages after placeing DStatcom are calculated as follows:
U˙ i = △U˙ i + U˙ i0 = △U˙ i + U˙ sag.i
(12)
For better understanding about the above proposed
modeling of the D-Statcom’s voltage compensation in
the short-circuit of distribution system, we consider
the cases of using two D-Statcoms as follows.
Placing two D-Statcoms in the test system
Figure 4: Test system short-circuit modeling using [Zbus ] with presence of two D-Statcoms.
In the case of using two D-Statcoms (Figure 4) assumed to connect to bus j and k (such as k>j), the matrix of additional injected bus current only has two elements at bus j and bus k that do not equal zero ( ∆I j =
IDS. j and ∆I j = IDS.k ̸= 0). Other elements equal zero
(△Ii = 0for ∀ i ̸= j,k). Therefore, (8) can be rewritten
as follows:
{
△U˙ j = Z j j × I˙DS. j + Z jk × I˙DS.k
(13)
△U˙ k = Zk j × I˙DS. j + Zkk × I˙DS.k
If the injected currents to bus j and bus k are large
enough to boost U j and Uk from U j = Usag. j and Uk =
Usag.k to desired value, say U j = Uk = 1p.u, we have:
{
△U˙ j = 1 − U˙ sag. j
(14)
△U˙ k = 1 − U˙ sag.k
Replace (14) to (13) and solve this system of two equations, we get the required injected current to bus k and
j as follows:
(
)
(
)
Zk j × 1 − U˙ sag. j − Z j j × 1 − U˙ sag.k
∗
(
)
=
I˙DS.k = IDS.k
Z × Z jk − Z j j × Zkk
( kj
)
(
)
(15)
Z jk × 1 − U˙ sag.k − Zkk × 1 − U˙ sag. j
∗
(
)
I˙DS. j = IDS.
=
j
Zk j × Z jk − Z j j × Zkk
and other bus voltages are calculated as (11)Equation (11).
∗
∗
For a given IDSmax , If IDS.
j > IDSmax or IDS.k > IDSmax
we use the given IDS. j = IDSmax or IDS.k = IDSmax to
calculate other bus i ( ∀ i ̸= j,k) voltages as follows
△U˙ i = Zi j × I˙DS. j + Zik × I˙DS.k
(16)
Finally, the voltages at other buses after placing two DStatcoms at buses j and k are calculated as (12)Equation (12).
25
PROBLEM DEFINITION
Objective function and constraints
In this paper, D-Statcom’s performance for global
voltage sag mitigation is estimated basing on the problem of optimizing the location of a number of DStatcoms in the test system where the objective function is to minimize the system index – SARFIX 17 .
f = SARFI X =
∑N
i=1 ni.X
⇒ Min
N
(17)
where
X is a given rms voltage threshold
ni.X : The number of voltage sags lower than X% of
the load i in the test system.
N: The number of loads in the system.
SARFIX calculation is described as the block-diagram
in Figure 5 for a given fault performance (fault rate
distribution) of a given system and a given threshold
X.
In this problem of optimization, the main variable is
the scenario of positions (buses) where D-Statcoms
are connected. We can see each main variable as a
string of m bus numbers with D-Statcom connection
out of the set of n buses of the test system. Therefore, the total scenarios of D-Statcom placement to be
tested is the m-combination of set N (n=33):
Tm = Cnm =
33!
m! × (33 − m)!
(18)
If we consider the placement of 2 D-Statcom in the test
system, we have m=2 and the total scenarios for plac33!
2 =
ing these two D-Statcoms is T2 = C33
=
2!×(33−2)!
528
Each candidate scenario to be tested is a pair of buses
number j and k out from 33 buses where the two DStatcoms are connected (e.g. 1,2 ; 1,3;…).
The problem of optimization has no constraint, but an
important parameter is be given is the limited current
of D-Statcom. The modeling about how D-Statcom
with a limited current compensates system voltage
sag is introduced in Section Method of modeling dstatcom with limited current for short-circuit calculation in distribution system.
Problem solving
In such a problem of optimization, the objective function which is SARFIX is always achieved for given preset parameters (X%, number of D-Statcoms m and DStatcom’s limited current). So, we use the method of
direct search to test th e whole set of all scenarios of DStatcom positions Tm . Figure 6 is the block-diagram
for solving this problem.
Science & Technology Development Journal – Engineering and Technology, 2(1):22-32
Figure 5: SARFIX calculation.
Each scenario in Tm is determined by counting a combination of m buses connected with D-Statcom out of
n buses of the test system. For a certain scenario k, we
firstly calculate the IDS of D-Statcom for verifying the
D-Statcom’s limited current. The revised IDS is then
used for calculate bus voltage matrix with the presence of D-Statcoms and finally SARFIX is calculated.
Preset parameters can be seen as input data. “postop”
is the intermediate variable that updates the optimal
scenario of D-Statcom position corresponding to the
minimum SARFIX . The starting solution of objective
function (Min SARFIX) is assumed to equals B (e.g.
B=33) which is big value for initiating the search process. The scenarios for parameters of fault events are
also considered.
Short-circuit calculation
To calculate the SARFIX , all possible fault positions in
the test system need to be considered. However, with
only regard to the introduction of the new method,
only three-phase short-circuits are taken into account.
Other short-circuit types can also be considered similarly in the model if detailed calculation is needed.
The paper uses the method of bus impedance matrix
for three-phase short-circuit calculations. The resulting bus voltage sags with and without the presence of
D-Statcom can be calculated for different cases of preset parameters as discuss ed in Section Result analysis
26
Science & Technology Development Journal – Engineering and Technology, 2(1):22-32
Figure 6: Block diagram of the problem of optimization.
and Discussion.
RESULT ANALYSIS AND DISCUSSION
IEEE 33-Bus Distribution System
In the paper, the IEEE 33-bus distribution feeder (Figure 7) is used as the test system because it just features a balanced three-phase distribution system, with
three-phase loads and three-phase lines. Following
parameters are assumed: Base power is 100MVA, base
voltage is 11kV, System voltage is 1pu and system
27
impedance is 0.1pu.
Preset parameters
The research considers the following preset parameters:
- For calculating SARFIX , the paper uses uniform
fault distribution 18 and fault rate = 1 time per unit
period of time at fault position (each bus) for system
component failure.
Science & Technology Development Journal – Engineering and Technology, 2(1):22-32
Figure 7: IEEE 33-bus distribution feeder as the
test system.
- For rms voltage threshold X, following values are
considered: X = 90, 80, 70, 50% of Un .
- For D-Statcom’s limited current, following values are
considered: IDSmax = 0.05, 0.1, 0.2p.u.
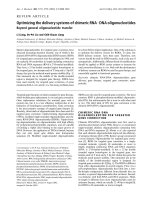
Result Analysis
The proposed method of modeling the system voltage sag mitigation for the case of using a multiple of
D-Statcoms in Section Modeling of a multiple of DStatcoms for system voltage sag mitigation can be illustrated for the case of using two D-Statcom. We
know that the number of D-Statcoms should be suitable with the system size so that its voltage compensation is economically effective. For such a size of 33bus test system, two D-Statcoms can be used.
For the case of two D-Statcoms placed in the test system, solving the optimization problem, followings are
step-by-step analysis of the results. We start to consider the case with X=80% and IDSmax =0.1p.u. The
voltage sag frequency at all system buses are plotted
for the case without and with two D-Statcoms in the
Figure 8.
Figure 8: Sag frequency for X=80% at system
buses without and with two D-Statcoms, IDSmax =
0.1p.u.
The two D-Statcoms are optimally located at bus
14 and bus 32 and the resulting minimum value of
SARFIX equals 8.7879.
In fact, the optimal placement of two D-Statcoms at
buses 14 and 32 is searched from T2 =528 scenarios.
The SARFIX for X=80% and IDSmax =0.1p.u. is calculated for 528 scenarios as plotted in Figure 9.
A scenario is a point with its ordinates equal to DStatcom’s locations. Also, because we don’t consider
the permutation for the pair of D-Statcom’s location
(e.g. 1-2 is the same as 2-1), we only consider points
on the triangle from the main diagonal of the matrix of scenarios of placement of 2 D-Statcoms. The
points in the other triangle of the above said matrix are not considered and thus its objective function
is given a high value (e.g. SARFI=33) for searching
the minimum of SARFI. However, for better graphical description of SARFIX as the function of two DStatcoms placement, in the Figure 9, the positions that
are not considered are assigned the SARFIX to equal
zero.
Solving the problem of optimization for other preset
parameters, the results are presented as the followings:
• Regarding the relation between SARFIX and the scenarios of 2 D-Statcom placement, Figure 10 and Figure 11 are presented to have a closer look on the influences of X% to SARFI and IDSmax to SARFI.
• Regarding the effectiveness on sag frequency of all
system buses, the results by all preset parameters are
described in Figure 12 for X = 80%, IDSmax = 0.05, 0.1,
0.2, 0.3p.u. and Fig. 1 3 for X = 50, 70, 90% and IDsmax
= 0.1p.u.
Figures 9 and 10 and Figure 11 imply the optimal
placement in the area of buses of 10-15 and buses of
25-32. Figure 12 shows an obvious influence of X as
X is higher, the SARFI is greater, but for X=50%, with
two D-Statcoms, the SARFI is very low (about 1.5).
We know that for distribution system, the sag duration is defined mainly protection device tripping time
and its typical time is 0.1s or greater. With regard to
the voltage ride-through curves 16 , X should be 50%
or greater. For the size of distribution system like the
33-bus, using two D-Statcoms is good enough for mitigating almost voltage sags in the system. That’s why
the paper takes the scenarios of two D-Statcom placement for modeling a multiple of D-Statcom mitigating
system voltage sag for the 33-bus distribution system.
Figure 13 also show how the maximum injected current from D-Statcom can improve voltage sag and
SARFI. Increases in IDSmax result in big SARFI reduction. For IDSmax = 0.2 and 0.3pu, the SARFI is very
small and for some buses it equals zero. That proves
for effectiveness of system voltage sag by 2 D-Statcoms
for the size of the test system. Remarked results are
summarized in the Table 1. For X=50, the SARFI
does not improve for IDSmax increasing from 0.2pu to
0.3pu. That also prove again that two D-Statcoms can
well mitigate voltage sag for such a size of the test system.
28
Science & Technology Development Journal – Engineering and Technology, 2(1):22-32
Figure 9: SARFIX for X=80% and IDSmax = 0.1p.u. as the function of all scenarios of 2 D-Statcom placement.
Figure 10: SARFIX for X=50% and IDSmax = 0.1p.u. as the function of all scenarios of 2 D-Statcom placement.
Figure 11: SARFIX for X=80% and IDSmax = 0.3p.u. as the function of all scenarios of 2 D-Statcom placement.
Figure 12: Sag frequency for X=80% at system buses without and with of two D-Statcoms (at optimal placement), for cases of IDSmax = 0.05, 0.1, 0.2, 0.3p.u.
29
Science & Technology Development Journal – Engineering and Technology, 2(1):22-32
Figure 13: Sag frequency at system buses for X=50,70,90% without or with 2 D-Statcoms, IDSmax = 0.1p.u.
(at optimal placement).
Table 1: Results for using 2 D-Statcom
IDSmax (pu)
0.05
0.1
0.2
0.3
minSARFIX
7.8485
2.6667
1.5758
1.5758
DS1 Bus
17
13
13
13
DS2 Bus
29
32
28
28
minSARFIX
12.7273
5.8182
3.3939
3.0303
DS1 Bus
18
13
9
14
DS2 Bus
33
33
28
27
minSARFIX
16.0606
8.7879
5.0909
4.9091
DS1 Bus
14
14
10
13
DS2 Bus
33
32
30
28
minSARFIX
20.1818
14.2727
7.2727
7.1212
DS1 Bus
10
15
10
10
DS2 Bus
18
33
29
28
X = 50%
X = 70%
X = 80%
X = 90%
30
Science & Technology Development Journal – Engineering and Technology, 2(1):22-32
CONCLUSION
This paper introduces a new method for global voltage
sag mitigation by a multiple of D-Statcoms in distribution system where the effectiveness of global voltage sag mitigation by a multiple of D-Statcoms for
the case of limited maximum current is modeled using Thevenin’s superposition theorem in short-circuit
calculation of power system. The paper illustrates the
method for the case of using two D-Statcom. The results show a better performance of two D-Statcom in
comparison with the case of one D-Statcom 15 . It’s
practical to take the method for a large enough distribution network where a number of D-Statcom can
be used.
For the purpose of introducing the method, some assumptions are accompanied like the type of shortcircuit and the fault rate distribution. For real application, the method can easily include the real fault rate
distribution as well as all types of short-circuit.
ABBREVIATIONS
IEEE: Institute of Electrical and Electronics Engineers
SARFI: System Average Rms variation Frequency
Index
PQ: Power Quality
CPD: Custom Power Device
STATCOM: Static Synchronous Compensator
D-Statcom: Distribution Static Synchronous Compensator
DVR: Dynamic Voltage Restorer
FACTS: Flexible Alternating Current Transmission
System
COMPETING INTERESTS
The author declares he has no conflicts of interest.
AUTHORS’ CONTRIBUTIONS
The author has done all the research work of the article
as a sole author.
REFERENCES
1. IEEE Std. 1159-1995, IEEE Recommended Practice for Monitoring Power Quality. 1995;p. 15–18.
31
2. Ghosh A, Ledwich G. Power quality enhancement using custom power devices. London: Kluwer Academic Publishers;
2002.
3. Math HJ, Bollen. John Wiley& Sons, Inc; 2000.
4. Farhoodnea M, Mohamed A, Shareef H, Zayanderoodi H. A
Comprehensive Review of Optimization Techniques Applied
for Placement and Sizing of Custom Power Devices in Distribution Networks; 2012. PRZEGLD ELEKTROTECHNICZNY R. 88
NR. 11a.
5. Babaei E, Nazarloo A, Hosseini SH. Application of flexible control methods for D-STATCOM in mitigating voltage sags and
swells. Presented at IEEE IPEC 2010 conference. Singapore;
2010.
6. Hamoud F, Doumbia ML, Chriti A; 2017. Available: https://iee
explore.ieee.org/abstract/document/7935917.
7. Jyotishi P, Deeparamchandani P. Mitigate Voltage Sag/Swell
Condition and Power Quality Improvement in Distribution
Line Using D-STATCOM. Journal of Engineering Research and
Applications. 2013;3:667–674.
8. Tanti DK, Verma MK, Singh B, Mehrotra ON. An ANN Based Approach for Optimal Placement of D-STATCOM for Voltage Sag
Mitigation. Int’l Journal of Engineering Science and Technology (IJEST). 2011;3(2):827–835.
9. Yuvaraj T, Devabalaji KR, Ravi K. Optimal placement and sizing of DSTATCOM using Harmony Search algorithm. In: ScienceDirect, Int’l Conf. on Alternative Energy in Developing
Countries and Emerging Economies. Elsevier; 2015. Presented
at.
10. Taher SA, Afsari SA. Optimal location and sizing of DSTATCOM
in distribution systems by immune algorithm. International
Journal of Electrical Power & Energy Systems. 2014;60(3):34–
44. ScienceDirect.
11. Thangaraj Y. Multi-objective simultaneous placement of DG
and DSTATCOM using novel lightning search algorithm. Journal of Applied Research and Technology. 2017;15(5).
12. Ali MA, Fozdar M, Niazi K, Phadke AR. Optimal Placement
of Static Compensators for Global Voltage Sag Mitigation
and Power System Performance Improvement. Research
Journal of Applied Sciences, Engineering and Technology.
2015;10(5):484–494.
13. Zhang Y, Milanovic JV. Global Voltage Sag Mitigation With
FACTS-Based Devices. IEEE Transaction on Power Delivery.
2010;25(4):2842–2850.
14. Khanh BQ, Minh NV. Using the Nortons Equivalent Circuit of
DVR in Optimizing the Location of DVR for Voltage Sag Mitigation in Distribution System. GMSARN International Journal.
2018;12(3):139–144.
15. Khanh BQ. Preparation A Novel Method for the Improvement
of SARFIX of Distribution System Using One D-STATCOM Considering Its Limited Current. GMSARN International Journal.
2019;13(1):52–57.
16. Grainger JJ, Stevenson WD. Power System Analysis. McGrawHill, Inc; 1994.
17. 1564-2014 IEEE Guide for Voltage Sag Indices.
18. Khanh BQ, Won DJ, Moon SI. Fault Distribution Modeling Using Stochastic Bivariate Models For Prediction of Voltage Sag
in Distribution Systems. IEEE Transaction on Power Delivery.
2008;23(1):347–354.
Tạp chí Phát triển Khoa học và Công nghệ – Kĩ thuật và Công nghệ, 2(1):22- 32
Bài Nghiên cứu
Tối ưu hóa vị trí nhiều thiết bị D-Statcom nhằm cải thiện chỉ tiêu
SARFIX trong lưới phân phối
Bạch Quốc Khánh*
TÓM TẮT
Trong khi người sử dụng thường xem xét các giải pháp cải thiện chất lượng điện năng cho một vị
trí cụ thể thì phía cấp điện lại quan tâm đến các giải pháp cải thiện chất lượng điện năng không chỉ
cho một vị trí cụ thể mà còn cho cả hệ thống điện. Do đó bài báo này liên quan đến một giải pháp
cải thiện chất lượng điện năng mang tính hệ thống của phía cấp điện bằng cách sử dụng đồng
thời một số thiết bị điều hòa công suất (CPD) trong lưới phân phối. Trong bài báo, một phương
pháp mới được giới thiệu nhằm tối ưu hóa vị trí đặt của nhiều thiết bị bù đồng bộ tĩnh D-Statcom
nhằm cải thiện tổng thể sụt giảm điện áp ngắn hạn trong lưới phân phối điện theo cách tiếp cận
tập trung. Vị trí đặt của D-Statcom sẽ được lựa chọn tối ưu không trong lưới phân phối dựa trên
bài toán tối ưu trong đó hàm mục tiêu là tối thiểu hóa chỉ tiêu tần suất sụt giảm điện áp ngắn hạn
trung bình SARFIX của lưới điện đang xét. Hiệu quả của nhiều D-Statcom cải thiện tổng thể sụt
giảm điện áp ngắn hạn được mô phỏng mới dựa trên phương pháp xếp chồng Thevenin trong
bài toán tính ngắn mạch trong lưới phân phối. Sự xuất hiện của nhiều thiết bị D-Statcom được mô
phỏng như là ma trận các nguồn dòng được bơm vào các nút trên lưới làm tăng điện áp trên tất
cả các nút trên toàn lưới điện đang xét. Bài toán xét trường hợp sử dụng nhiều D-Statcom với một
nguyên tắc bù điện áp thực tế cho các lưới phân phối có kích cỡ lớn. Bài báo sử dụng lưới phân
phối mẫu 33 nút của IEEE để mô phỏng tính toán sụt giảm điện áp ngắn hạn khi có ngắn mạch
trong lưới phân phối và xem xét các tham số ảnh hưởng đến các kết quả của bài toán tối ưu.
Từ khoá: Lưới phân phối điện, Sụt giảm điện áp ngắn hạn, SARFIX, thiết bị bù đồng bộ tĩnh trong
lưới phân phối D-Statcom
Bộ môn Hệ thống điện, Viện Điện,
Trường Đại học Bách khoa Hà Nội, Hà
Nội, Việt Nam
Liên hệ
Bạch Quốc Khánh, Bộ môn Hệ thống điện,
Viện Điện, Trường Đại học Bách khoa Hà Nội,
Hà Nội, Việt Nam
Email:
Lịch sử
• Ngày nhận: 23-12-2018
• Ngày chấp nhận: 09-4-2019
• Ngày đăng: 30-5-2019
DOI :
Bản quyền
© ĐHQG Tp.HCM. Đây là bài báo công bố
mở được phát hành theo các điều khoản của
the Creative Commons Attribution 4.0
International license.
Trích dẫn bài báo này: Khánh B Q. Tối ưu hóa vị trí nhiều thiết bị D-Statcom nhằm cải thiện chỉ tiêu
SARFIX trong lưới phân phối. Sci. Tech. Dev. J. - Eng. Tech.; 2(1):22-32.
32