Statistical analysis of the effective factors on the 28 days compressive strength and setting time of the concrete
Bạn đang xem bản rút gọn của tài liệu. Xem và tải ngay bản đầy đủ của tài liệu tại đây (1.21 MB, 11 trang )
�������������������������������������������������������������������������������������������������������������������������������������������������������������������������������������������������������������������������������������������������������������������������������������������������������������������������������������������������������������������������������������������������������������������������������������������������������������������������������������������������������������������������������������������������������������������������������������������������������������������������������������������������������������������������������������������������������������������������������������������������������������������������������������������������������������������������������������������������������������������������������������������������������������������������������������������������������������������������������������������������������������������������������������������������������������������������������������������������������������������������������������������������������������������������������������������������������������������������������������������������������������������������������������������������������������������������������������������������������������������������������������������������������������������������������������������������������������������������������������������������������������������������������������������������������������������������������������������������������������������������������������������������������������������������������������������������������������������������������������������������������������������������������������������������������������������������������������������������������������������������������������������������������������������������������������������������������������������������������������������������������������������������������������������������������������������������������������������������������������������������������������������������������������������������������������������������������������������������������������������������������������������������������������������������������������������������������������������������������������������������������������������������������������������������������������������������������������������������������������������������������������������������������������������������������������������������������������������������������������������������������������������������������������������������������������������������������������������������������������������������������������������������������������������������������������������������������������������������������������������������������������������������������������������������������������������������������������������������������������������������������������������������������������������������������������������������������������������������������������������������������������������������������������������������������������������������������������������������������������������������������������������������������������������������������������������������������������������������������������������������������������������������������������������������������������������������������������������������������������������������������������������������������������������������������������������������������������������������������������������������������������������������������������������������������������������������������������������������������������������������������������������������������������������������������������������������������������������������������������������������������������������������������������������������������������������������������������������������������������������������������������������������������������������������������������������������������������������������������������������������������������������������������������������������������������������������������������������������������������������������������������������������������������������������������������������������������������������������������������������������������������������������������������������������������������������������������������������������������������������������������������������������������������������������������������������������������������������������������������������������������������������������������������������������������������������������������������������������������������������������������������������������������������������������������������������������������������������������������������������������������������������������������������������������������������������������������������������������������������������������������������������������������������������������������������������������������������������������������������������������������������������������������������������������������������������������������������������������������������������������������������������������������������������������������������������������������������������������������������������������������������������������������������������������������������������������������������������������������������������������������������������������������������������������������������������������������������������������������������������������������������������������������������������������������������������������������������������������������������������������������������������������������������������������������������������������������������������������������������������������������������������������������������������������������������������������������������������������������������������������������������������������������������������������������������������������������������������������������������������������������������������������������������������������������������������������������������������������������������������������������������������������������������������������������������������������������������������������������������������������������������������������������������������������������������������������������������������������������������������������������������������������������������������������������������������������������������������������������������������������������������������������������������������������������������������������������������������������������������������������������������������������������������������������������������������������������������������������������������������������������������������������������������������������������������������������������������������������������������������������������������������������������������������������������������������������������������������������������������������������������������������������������������������������������������������������������������������������������������������������������������������������������������������������������������������������������������������������������������������������������������������������������������������������������������������������������������������������������������������������������������������������������������������������������������������������������������������������������������������������������������������������������������������������������������������������������������������������������������������������������������������������������������������������������������������������������������������������������������������������������������������������������������������������������������������������������������������������������������������������������������������������������������������������������������������������������������������������������������������������������������������������������������������������������������������������������������������������������������������������������������������������������������������������������������������������������������������������������������������������������������������������������������������������������������������������������������������������������������������������������������������������������������������������������������������������������������������������������������������������������������������������������������������������������������������������������������������������������������������������������������������������������������������������������������������������������������������������������������������������������������������������������������������������������������������������������������������������������������������������������������������������������������������������������������������������������������������������������������������������������������������������������������������������������������������������������������������������������������������������������������������������������������������������������������������������������������������������������������������������������������������������������������������������������������������������������������������������������������������������������������������������������������������������������������������������������������������������������������������������������������������������������������������������������������������������������������������������������������������������������������������������������������������������������������������������������������������������������������������������������������������������������������������������������������������������������������������������������������������������������������������������������������������������������������������������������������������������������������������������������������������������������������������������������������������������������������������������������������������������������������������������������������������������������������������������������������������������������������������������������������������������������������������������������������������������������������������������������������������������������������������������������������������������������������������������������������������������������������������������������������������������������������������������������������������������������������������������������������������������������������������������������������������������������������������������������������������������������������������������������������������������������������������������������������������������������������������������������������������������������������������������������������������������������������������������������������������������������������������������������������������������������������������������������������������������������������������������������������������������������������������������������������������������������������������������������������������������������������������������������������������������������������������������������������������������������������������������������������������������������������������������������������������������������������������������������������������������������������������������������������������������������������������������������������������������������������������������������������������������������������������������������������������������������������������������������������������������������������������������������������������������������������������������������������������������������������������������������������������������������������������������������������������������������������������������������������������������������������������������������������������������������������������������������������������������������������������������������������������������������������������������������������������������������������������������������������������������������������������������������������������������������������������������������������������������������������������������������������������������������������������������������������������������������������������������������������������������������������������������������������������������������������������������������������������������������������������������������������������������������������������������������������������������������������������������������������������������������������������������������������������������������������������������������������������������������������������������������������������������������������������������������������������������������������������������������������������������������������������������������������������������������������������������������������������������������������������������������������������������������������������������������������������������������������������������������������������������������������������������������������������������������������������������������������������������������������������������������������������������������������������������������������������������������������������������������������������������������������������������������������������������������������������������������������������������������������������������������������������������������������������������������������������������������������������������������������������������������������������������������������������������������������������������������������������������������������������������������������������������������������������������������������������������������������������������������������������������������������������������������������������������������������������������������������������������������������������������������������������������������������������������������������������������������������������������������������������������������������������������������������������������������������������������������������������������������������������������������������������������������������������������������������������������������������������������������������������������������������������������������������������������������������������������������������������������������������������������������������������������������������������������������������������������������������������������������������������������������������������������������������������������������������������������������������������������������������������������������������������������������������������������������������������������������������������������������������������������������������������������������������������������������������������������������������������������������������������������������������������������������������������������������������������������������������������������������������������������������������������������������������������������������������������������������������������������������������������������������������������������������������������������������������������������������������������������������������������������������������������������������������������������������������������������������������������������������������������������������������������������������������������������������������������������������������������������������������������������������������������������������������������������������������������������������������������������������������������������������������������������������������������������������������������������������������������������������������������������������������������������������������������������������������������������������������������������������������������������������������������������������������������������������������������������������������������������������������������������������������������������������������������������������������������������������������������������������������������������������������������������������������������������������������������������������������������������������������������������������������������������������������������������������������������������������������������������������������������������������������������������������������������������������������������������������������������������������������������������������������������������������������������������������������������������������������������������������������������������������������������������������������������������������������������������������������������������������������������������������������������������������������������������������������������������������������������������������������������������������������������������������������������������������������������������������������������������������������������������������������������������������������������������������������������������������������������������������������������������������������������������������������������������������������������������������������������������������������������������������������������������������������������������������������������������������������������������������������������������������������������������������������������������������������������������������������������������������������������������������������������������������������������������������������������������������������������������������������������������������������������������������������������������������������������������������������������������������������������������������������������������������������������������������������������������������������������������������������������������������������������������������������������������������������������������������������������������������������������������������������������������������������������������������������������������������������������������������������������������������������������������������������������������������������������������������������������������������������������������������������������������������������������������������������������������������������������������������������������������������������������������������������������������������������������������������������������������������������������������������������������������������������������������������������������������������������������������������������������������������������������������������������������������������������������������������������������������������������������������������������������������������������������������������������������������������������������������������������������������������������������������������������������������������������������������������������������������������������������������������������������������������������������������������������������������������������������������������������������������������������������������������������������������������������������������������������������������������������������������������������������������������������������������������������������������������������������������������������������������������������������������������������������������������������������������������������������������������������������������������������������������������������������������������������������������������������������������������������������������������������������������������������������������������������������������������������������������������������������������������������������������������������������������������������������������������������������������������������������������������������������������������������������������������������������������������������������������������������������������������������������������������������������������������������������������������������������������������������������������������������������������������������������������������������������������������������������������������������������������������������������������������������������������������������������������������������������������������������������������������������������������������������������������������������������������������������������������������������������������������������������������������������������������������������������������������������������������������������������������������������������������������������������������������������������������������������������������������������������������������������������������������������������������������������������������������������������������������������������������������������������������������������������������������������������������������������������������������� CCS by the
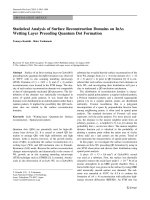
predictive equations for each experiment.
704
B. Abolpour et al.
Fig. 5 The calculated Error of the predicted IST by the
predictive equations for each experiment.
Variation in Fe2O3 causes to vary CCS as a curve with a
minimum at zero level when other factors are stabilized at
low level and have a descending nonlinear curve when other
factors are stabilized at high level. Increasing of Fe2O3
decreases IST linearly in both cases, i.e. other factors are stabilized in their high or low level. This variation has been shown
in Fig. 12.
Increasing of CaO causes a nonlinear decrease in the CCS
when other factors are in their low level. The CCS varies as
a curve with a maximum at level 0.6 of the CaO, when other
factors are in their high level. Increasing of CaO causes a negligible linear increase in the IST in both cases when other factors are in their high or low level. This behavior of the concrete
has been shown in Fig. 13.
Fig. 14 shows that increasing of SO3 causes an increase or
decrease in the CCS linearly when other factors are in their
high or low level, respectively. This increment has a more complex effect on the IST. Increasing of this factor causes a nonlinear decrease in the IST when other factors are in their
high level. This Figure shows that variation in the SO3 value
has no important effect on the IST when other factors are in
their low level.
As can be observed from Fig. 15 variation in Blaine has no
significant effect on the CCS and IST when the concrete composition is stabilized at their low level. When composition of
Fig. 6
The effects of SiO2 on the CCS and IST when other factors are in their low or high level.
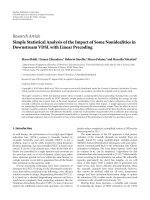
Fig. 7
The effects of Al2O3 on the CCS and IST when other factors are in their low or high level.
Statistical analysis of the effective factors on the main properties of the concrete
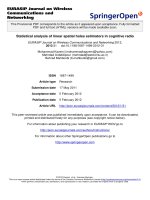
Fig. 8
Fig. 9
Fig. 10
The effects of Na2O on the CCS and IST when other factors are in their low or high level.
The effects of Cl on the CCS and IST when other factors are in their low or high level.
The effects of MgO on the CCS and IST when other factors are in their low or high level.
705
706
B. Abolpour et al.
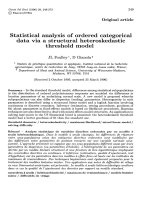
Fig. 11
Fig. 12
Fig. 13
The effects of K2O on the CCS and IST when other factors are in their low or high level.
The effects of Fe2O3 on the CCS and IST when other factors are in their low or high level.
The effect of CaO on the CCS and IST when other factors are in their low or high level.
Statistical analysis of the effective factors on the main properties of the concrete
Fig. 14
Fig. 15
Table 3
xSiO2
xCaO
xMgO
xNa2 O
xK2 O
xSO3
xCl
xBlaine
The effects of Blaine on the CCS and IST when other factors are in their low or high level.
Level of other fixed factors
xSiO2
xFe2 O3
The effects of SO3 on the CCS and IST when other factors are in their low or high level.
The effect of factors on the CCS and IST.
Considered factor
xAl2 O3
707
+
À
+
À
+
À
+
À
+
À
+
À
+
À
+
À
+
À
xAl2 O3
xFe2 O3
xCaO
xMgO
xNa2 O
xK2 O
xSO3
xCl
xBlaine
+
À
+
À
+
À
+
À
+
À
+
À
+
À
+
À
+
À
+
À
+
À
+
À
+
À
+
À
+
À
+
À
+
À
+
À
+
À
+
À
+
À
+
À
+
À
+
À
+
À
+
À
+
À
+
À
+
À
+
À
+
À
+
À
+
À
+
À
+
À
+
À
+
À
+
À
+
À
+
À
+
À
+
À
+
À
+
À
+
À
+
À
+
À
+
À
+
À
+
À
+
À
+
À
+
À
+
À
+
À
+
À
+
À
+
À
+
À
+
À
+
À
+
À
+
À
+
À
+
À
+
À
+
À
+
À
+
À
+
À
+
À
+
À
+
À
+
À
+
À
+
À
+
À
+
À
+
À
+
À
+
À
Effect on the CCS
Effect on the IST
Decrease
Decrease
Increase
Decrease
Decrease
Complex
Complex
Decrease
Decrease
Decrease
Increase
Decrease
Increase
Increase
Increase
Decrease
Increase
Decrease
Increase
Complex
Complex
Complex
Decrease
Decrease
Decrease
Decrease
Increase
Increase
Complex
Complex
Decrease
Decrease
Decrease
Decrease
Decrease
Complex
Decrease
Decrease
Complex
Complex
708
the concrete is stabilized at high level, increasing of Blaine will
increase CCS by an ascending curve and changes IST through
a curve with a maximum at about level 0.2.
The setting and hardening of cement are the result of chemical reactions between cement and water (i.e. hydration). The
hydration reactions starts directly after adding water to cement
and in the first 30 min a part of C3A and sulfate carrier is dissolved and results more strength in concrete. This very fast
process produces heat during the initial period of hydration.
C3A phase sets quickly with evolution of heat and enhances
strength of the silicates. Coarse cements with low specific surface area usually take longer times to set due to the sluggish
hydration kinetics. On the other hand, high content of C3A
speeds up the reactions resulting in relatively short setting
times. Increasing the amount of C3A causes a significant
increase in the CCS and also decreases the IST as Eqs. (11)
and (12).
Conclusions
In this study, the effects of various factors on the concrete
compressive strength and also initial setting time have been
investigated. The effective factors are weight percent of the
SiO2, Al2O3, Fe2O3, Na2O, K2O, CaO, MgO, Cl, SO3 of the
raw materials and the Blaine of cement particles. Interactions
of these factors with probability of a 97.5% confidence have
been obtained using analysis of variance. Then the equations
have been obtained through regression to predict the concrete
compressive strength and initial setting time as function of the
mentioned factors. The mean of the calculated absolute Error
for predicted values of CCS and IST was 1.92% and 4.3%,
respectively for regression equations. Attention to the
coefficients of these regression equations shows that the
quadruplet combinations of xSiO2 Á xMgO Á xSO3 Á xBlaine and
xSiO2 Á xSO3 Á xK2 O Á xBlaine have the most positive and negative
effect on the CCS, respectively. Also the quadruplet combinations of xSiO2 Á xMgO Á xNa2 O Á xK2 O and xSiO2 Á xNa2 O Á x2K2 O have
the most positive (increasing) and negative (reducing) effect
on the IST of concrete, respectively. Also, simple and applicable formulas have been developed using the genetic algorithm
to predict these parameters. The accuracy of these predictive
equations is completely acceptable. They have a less than
6% absolute mean error. Finally the effect of each factor has
been investigated when other factors are in their low or high
level and summary of the results has been presented in Table 3.
Conflict of interest
The authors have declared no conflict of interest.
Compliance with Ethics Requirements
This article does not contain any studies with human or animal
subjects.
References
[1] Lee CC. Fuzzy logic in control system: fuzzy logic controller
Part I and Part II. IEEE Trans Syst Man Cyber 1995;20:404–18.
B. Abolpour et al.
[2] Tanyildizi H, Qoskun A. Fuzzy logic model for prediction of
compressive strength of lightweight concrete made with scoria
aggregate and fly ash. International Earthquake Symposium
Kocaeli; 2007.
[3] Uyunoglu T, Unal O. A new approach to determination of
compressive strength of fly ash concrete using fuzzy logic. J Sci
Ind Res 2006;65:894–9.
[4] Nataraja MC, Jayaram MA, Ravikumar CN. A fuzzy – neuro
model for normal concrete mix design. Eng Lett 2006;13(2):98.
[5] Tesfamariam S, Najjaran H. Adaptive network-fuzzy
inferencing to estimate concrete strength using mix design. J
Mater Civil Eng 2007;19(7):550–60.
[6] Bilgehan M. A comparative study for the concrete compressive
strength estimation using neural network and neurofuzzy
modeling approaches. Nondestruct Test Eval 2011;26(1):35–55.
[7] Yang SS, Xu J, Yao GZ. Concrete strength evaluation based on
fuzzy neural networks. IEEE Xplore 2005;6:3344–7.
[8] Abolpour B, Mohebbi A. Estimation of 28-days age concrete
compressive strength by an adaptive cuckoo-fuzzy logic model.
Res Chem Intermed DOI: />[9] Abolpour B, Abolpour Be, Abolpour R, Bakhshi H. Estimation
of concrete compressive strength by the fuzzy logic. Res Chem
Intermed 2013;39(2):707–19.
[10] Bakhtiyari S, Allahverdi A, Rais-Ghasemi M, Ramezanianpour
AA, Parhizkar T, Zarrabi BA. Mix design, compressive strength
and resistance to elevated temperature (500 °C) of selfcompacting concretes containing limestone and quartz fillers.
Int J Civil Eng 2011;9(3):215–22.
[11] Mehdizadeh MB, Dilmaghani S. Experimental relationship
between compressive strength of Portland cement with its
phases and finesses. J Eng Faculty 2003;15(1):35–45.
[12] Barry TI, Glasser FP. Calculation of Portland cement clinkering
reactions. Adv Cem Res 2000;12(1):19–28.
[13] Rajesh DVSP, Narender Reddy A, Venkata Tilak U,
Raghavendra M. Performance of alkali activated slag with
various alkali activators. Int J Innovative Res Sci Eng Technol
2013;2(2):378–86.
[14] Selman MM, Ali AM. The effect of alkalis on the properties of
portland cement. Anbar J Eng Sci 2012:25–38.
[15] Kamalloo A, Ganjkhanlou Y, Aboutalebi SH, Nouranian H.
Modeling of compressive strength of metakaolin based
geopolymers by the use of artificial neural network. Int J Eng
Trans A: Basics 2010;23(2):145–52.
[16] Zheng L, Xuehua C, Mingshu T. Hydration and setting time of
MgO-type expansive cement. Cem Concr Res 1992;22:1–5.
[17] Yazici S, Arel HS. Effects of fly ash fineness on the mechanical
properties of concrete. Sadhana 2012;37(3):389–403.
[18] Johansen VC, Taylor PC, Tennis PD. Effect of cement
characteristics on concrete properties, EB226, 2nd ed. Portland
Cement Association, USA, 2006. p. 1–48.
[19] Tepecik A, Altin Z, Erturan S. Modelling compressive strength
of standard CEM-I 42.5 cement produced in Turkey with
stepwise regression method. J Chem Soc Pak 2009;31(2):214–20.
[20] Hooton RD, Boyd AJ, Bhadkamkar D. Effect of cement finesse
and C3S content on the properties of concrete: a literature
review. PCA R&D Series 2005;2871:2–11.
[21] Bentz DP. Blending different fineness cements to engineer the
properties of cement-based materials. Mag Concr Res
2010;62(5):327–38.
[22] Hwang K, Noguchi T, Tomosawa F. Prediction model of
compressive strength development of fly-ash concrete. Cem
Concr Res 2004;34:2269–76.
[23] Montgomery DC. Design and analysis of experiments. 5th
ed. New York: Wiley; 2001.
[24] American Society for Testing and Materials. Standard test
method for quantitative determination of phases in Portland
Statistical analysis of the effective factors on the main properties of the concrete
cement clinker by microscopical point-count procedure 1,
ASTM 2001; Philadelphia, USA, C 1356–96.
[25] Taylor HFW. Modification of the Bogue calculation. Adv Cem
Res 1989;2:73–7.
709
[26] Moore C. Chemical control of portland cement clinker. Ceram
Bull 1982;61(4):511–5.
[27] Whitley D. A genetic algorithm tutorial. Stat Comput
1994;4(2):65–85.