Dehydration and rehydration processes of cement paste exposed to high temperature environments
Bạn đang xem bản rút gọn của tài liệu. Xem và tải ngay bản đầy đủ của tài liệu tại đây (644.63 KB, 11 trang )
See discussions, stats, and author profiles for this publication at: />
Dehydration and Rehydration Processes of Cement Paste Exposed to High
Temperature Environments
Article in Journal of Materials Science · May 2004
DOI: 10.1023/B:JMSC.0000025827.65956.18
CITATIONS
READS
179
427
2 authors:
Cruz Alonso
Lorenzo Fernandez
Spanish National Research Council
University of Valencia
185 PUBLICATIONS 6,245 CITATIONS
36 PUBLICATIONS 770 CITATIONS
SEE PROFILE
Some of the authors of this publication are also working on these related projects:
Study of durability for concrete in Marine Atmosphere View project
mesoporous materials View project
All content following this page was uploaded by Lorenzo Fernandez on 24 May 2018.
The user has requested enhancement of the downloaded file.
SEE PROFILE
J O U R N A L O F M A T E R I A L S S C I E N C E 3 9 (2 0 0 4 ) 3015 – 3024
Dehydration and rehydration processes of cement
paste exposed to high temperature environments
C. ALONSO, L. FERNANDEZ
Institute of Construction Science “Eduardo Torroja” (C.S.I.C.), Serrano Galvache No 4,
28033 Madrid, Spain
E-mail:
Microstructural changes of an OPC cement paste after being exposed at various elevated
temperatures and further rehydration have been evaluated using 29 Si MAS-NMR.
Thermogravimetry and XRD are also employed to complement the information. NMR
studies of cement paste exposed to high temperatures demonstrate a progressive
transformation of C-S-H gel that leads at 450◦ C, to a modified C-S-H gel. For temperatures
above 200◦ C to a progressive formation of a new nesosilicate. At 750◦ C, the transformation
of C-S-H is complete into the nesosilicate form with a C2 S stoichiometry close to larnite, but
less crystalline. Also is observed an increase of portlandite that takes place up to
temperatures of 200◦ C. A progressive increase of calcite formation up to 450◦ C is noticed.
The ettringite disappearance below 100◦ C is confirmed and the portlandite and calcite are
converted to lime at 750◦ C. The initial anhydrous phases as larnite and brownmillerite
remain unaltered during heating. Rehydration of the heated samples (450 and 750◦ C)
shows recrystallization of calcite, portlandite and ettringite, and the C-S-H reformation from
the new nesosilicate. The larnite and brownmillerite remain unaltered during rehydration.
The developing of damaged due to the formation of microcracking is detected and
improved because of rehydration phenomena. C 2004 Kluwer Academic Publishers
1. Introduction
Fire is a risk for concrete structures because concrete is
not stable at high temperatures and chemical/physical
transformations in aggregates and paste are developed,
which finally results in alteration of mechanical properties [1]. The main chemical process responsible for the
internal damage of concrete is the alteration of hydrates
[2]. A sequence of events takes place during heating,
being the release of water vapor the main consequence,
coming from vaporization of moisture, and transformation of C-S-H, dehydration of calcium hydroxide
[3] and ettringite, this last occurring below 100◦ C
[4–9].
Lack of knowledge has been published on the transformations of C-S-H occurring during heating [10–13].
Recently, Shaw et al. [10, 11] used synchrotron radiation (SR) to deal with the dehydration mechanism during heating of various natural C-S-H minerals with crystalline structure: tobermorite and xonotlite transforms
into wollastonite, while hillebrandite evolves to larnite
on cement pastes. Castellote et al. [12, 13], employed
in-situ neutron diffraction experiments (ND) during
heating up to 620◦ C, and confirmed that the ettringite
losses its crystalline form around 80◦ C, the crystalline
phases of C-S-H, as tobermorite, transforms around
400◦ C. Also noticed that portlandite is destroyed during heating after 510◦ C, and partially recovered during
cooling within different crystalline phase.
0022–2461
C
2004 Kluwer Academic Publishers
But most microstructural studies on the stability at
high temperatures of cement paste [3, 14–17] are performed after cooling (i.e., at room temperature). Besides, in the case of dehydration process as consequence of heating studies are focused on porosity or
compositional changes using XRD, SEM, ND or TG
[3, 12, 14–17], but there is a lack of studies on the
evolution of C-S-H, using 29 Si MAS-NMR [18], although most of C-S-H in paste is amorphous, or poorly
ordered [19], and represent about 60% of the cement
paste.
When fired concrete is exposed after cooling to moist
air, rehydration processes take place in cement paste,
that together with the changes in volume, and mass
may lead to an additional increase in porosity and to
the formation of additional cracking to that occurring
during heating [20].
This paper includes results obtained from a cured
cement paste submitted to various elevated temperatures. The aim is to identify the microstructural changes
concerning mineral transformations as a function of
temperatures (100, 200, 450 and 750◦ C) using mainly
29
Si MAS-NMR and supporting with information from
X-ray Diffraction and Thermogravimetric analyses,
also employed to complete the full compositional microstructure picture, in order to increase the understanding of process of cement paste degradation at high
temperatures.
3015
T A B L E I Chemical composition of the cement
Chemical analysis (%)
L.O.I
IR
SiO2
Al2 O3
Fe2 O3
CaO
MgO
SO3
Na2 O
K2 O
CaO (free)
Cement
3.59
0.58
19.60
4.43
4.27
62.61
0.95
3.29
0.11
0.28
1.92
The effect of humidity on dehydrated cement paste
is later considered and the microstructure changes in
solid phases are addressed.
2. Experimental section
2.1. Sample preparation
Cement paste specimens were prepared by mixing
Ordinary Portland Cement (OPC) with distilled water, using a w/c = 0.4. A cement type 42.5MR-SR
was employed for the testing program, whose chemical
composition is given, in Table I. The cement has low
C3 A (<1%) and low alkaline content (0.42 Na2 O eq.).
The fluid paste was introduced in cylindrical plastic
tubes of 23 mm in φ and 30 mm in height. The samples
were sealed and cured for 70 days at room temperature
(20 ± 2◦ C) inside the tubes, so no additional water gain
was allowed during hydration.
2.2. Heating procedure
After this curing period, the specimens were submitted
to the selected heating regime up to reach a maximum of
four temperatures (Tc ): 100, 200, 450 and 750◦ C. One
sample was kept sealed without heating, as reference,
up to the characterization analysis was performed.
The heating process was pursued in several steps that
are summarized in Fig. 1:
1. Each specimen was placed into the furnace and
was heated at a heating rate of 1◦ C/min, starting from
room temperature (20 ± 2◦ C).
2. When the desired temperature (Tc ) was reached
(200, 450 or 750◦ C), the samples were kept 2 h into the
furnace at Tc in order to homogenize the temperature in
the specimen and allow the respective transformation
to occur.
3. After this time, the heating was stopped and the
specimens were maintained in the furnace for slow
cooling down up to room temperature.
The weight loss of each heated sample was registered
by weighing each sample before and after heating (Table II).
The heating regime for the specimen at 100◦ C
was different. This specimen was introduced into the
furnace directly at 100◦ C and maintained inside till
Figure 1 The heating process applied to the cement paste for Tc = 200,
450 and 750◦ C.
reaching a constant weight loss. Then, heating was
stopped and the specimen was kept into the furnace
with slow cooling down to room temperature.
Once the cooling process finalized, the specimens
were covered with a plastic film and kept into a desiccator to avoid contact with the atmosphere and further
up take of humidity or carbonation, before characterization test.
Rehydration process was also studied in the specimens heated at (Tc = 450 and 750◦ C) by placing them
into a saturated chamber (100% R.H) at room temperature for 3 12 months.
2.3. Characterization techniques
• X-ray Diffraction (XRD) was used to identify
the crystalline phases. XRD data were recorded
using a Phillips PW1820, powder diffractometer
with Cu Kα radiation. The goniometer speed was
0.020◦ /s. Software from Phillips has been used
to the characterization of the mineralogical crystalline phases.
• A Netzsch simultaneous analyzer, model STA 409
was used to obtain thermogravimetric (TG) and differential thermogravimetric analysis (DTA) curves
of the specimens. The heating ratio was 4◦ K/min
in a nitrogen atmosphere flowing at 100 cm3 /min.
The analyzed mass per specimen was about 50 mg.
• 29 Si MAS NMR spectra were recorded at the 29 Si
resonance of 59.572 MHz using a Varian VXR
T A B L E I I Weight loss of samples after each high temperature experiment
Constant weight loss
Heating process (by using the cycle from Fig. 1)
Samples
Tc = 100◦ C
Tc = 200◦ C
Tc = 100◦ C
Tc = 200◦ C
Tc = 450◦ C
Tc = 750◦ C
Weight loss of samples (%)
19.1
13.2
22.2
15.3
24.4
32.0
3016
300 S spectrometer, with a spinning speed of 4 kHz
in a double bearing 7 mm ZrO2 rotor. Spectra were
accumulated using Bloch decay pulse sequences of
/2 and high power 1 H decoupling with a 60 kHz
radio frequency field. A recycle time of 59 s was
used. The number of scans was 1000. Tetramethylsilane (T.M.S, Si(CH3 )4 ) was used as reference. The spectra were simulated using a modified
version of the Winfit program [21].
3. Results
3.1. Weight losses of heated specimens
As commented before, the transformations induced by
heating in the cement paste goes to a weight loss from
the evaporation of free water and that of hydrated products occurring at specific temperatures. Table II includes the values obtained from the specimens heated at
each temperature. An increase in the amount of weight
loss at each temperature is noticed except between 100
and 200◦ C. The specimen at 100◦ C showed higher
weight loss at 100◦ C than at 200◦ C. The test was made
by duplicate and results of weight losses were (19.1
and 22.2%). The reason was associated to evolution of
hydration of partially hydrated cement phases, mainly
C3 S. The weight loss at 200◦ C until reaching a constant
weight (13.2%), was similar to that obtained following
the regime of heating (1◦ C/min increase, 2 h heating
and temperature decrease) (15.3%).
3.2. X-ray diffraction studies
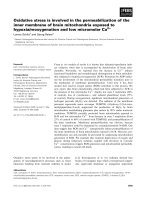
The diffractogram from the five analyzed specimens are shown in Fig. 2, where the main peaks
have been identified. Typical reflections associ-
Figure 2 X-ray diffractograms of the reference specimen (initial cement paste), and the heated specimens at various temperatures (Tc ). Key
to phases: C2 S (•); Portlandite ( ); Calcite ( ); Brownmillerite ( );
Ettringite ( ); Ca1.5 SiO3.5 · xH2 O ( ); lime ( ).
Figure 3 X-ray diffractograms of the reference specimen (initial cement
paste), the heated and afterwards rehydrated specimens (Tc = 450 and
750◦ C). Key to phases: C2 S (•); Portlandite ( ); Calcite ( ); Brownmillerite ( ); Ettringite ( ); Ca1.5 SiO3.5 · xH2 O ( ); lime ( ).
ated to larnite (C2 S), portlandite (Ca(OH)2 ), brownmillerite (Ca4 Al2 Fe2 O10 ), calcite (CaCO3 ), ettringite (Ca6 (Al(OH)6 )2 (SO4 )3 (H2 O)26 ), and Ca1.5 SiO 3.5 ·
xH2 O were found in reference sample. After heating,
some reflections disappear, shown in Fig. 2, as those
corresponding to ettringite, which were identified in
the initial specimen but not in the samples heated at
T > 100◦ C, and Ca1.5 SiO3.5 · xH2 O after 450◦ C. A
progressive reduction of the intensity of the peak related to portlandite is noticed by increasing the temperature above 450◦ C and is not present at 750◦ C. The
presence of calcite is detected and even increases in
intensity up to Tc = 450◦ C. At the highest temperature tested (750◦ C), the reflection peaks of calcite practically disappear. Lime is also well identified in the
specimen heated at 750◦ C, the origin is explained from
portlandite and calcite transformation. The brownmillerite is present in all specimens heated and the same
for larnite.
The XRD diffractograms corresponding to the rehydrated specimens (Tc = 450 and 750◦ C) are presented
in Fig. 3. Both specimens contain the reflections of larnite, portlandite, brownmillerite, calcite, ettringite and
Ca1.5 SiO3.5 · xH2 O similar to that of reference, indicating that the initial crystalline composition of hydrated
forms are recovered.
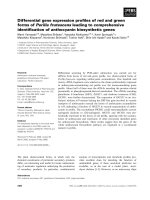
3.3. Thermal analyses
The thermogravimetry analyses are presented in Fig. 4
and the weight losses associated to the various ranges
of temperature are given in Table III.
The thermogravimetric test are interpreted as
follows:
3017
Figure 4 Thermogravimetric analysis (TG and DTA) of the reference
specimen (initial cement paste) and the heated specimens at various
temperatures (Tc ).
• The free water, still present in the samples, is removed up to about 100◦ C.
• From 100–250◦ C, takes place the loss of water
mainly from the C-S-H. Most of the bound water
is lost up to 250◦ C.
• A further important weight loss occurs with the
transformation of portlandite at 450◦ C.
• Finally, a weak endothermic peak at 650◦ C is attributed to the decomposition of calcite.
The sample heated at 750◦ C show a complete transformation of the portlandite and calcite. In this sample,
the weight losses are very low in the whole range of
temperatures from the TG tests, indicating that during
heating a complete chemical transformation of the cement paste has occurred.
The weight losses related to the rehydrated specimens, previously heated at 450 and 750◦ C, are
Figure 5 Thermogravimetric analysis (TG and DTA) of the reference
specimen (initial cement paste), and the heated and afterwards rehydrated
specimens (Tc = 450 and 750◦ C).
presented in Fig. 5 and Table III. The TG and DTA
figures are similar to the reference specimen: new formation of portlandite, the presence of calcite, and bound
and free water are clearly observed.
One relevant feature is the endothermic peak at about
100◦ C in the reference sample that disappears after
heating, but it recovers again after rehydration. The
peak has been associated with the transformation of
ettringite [5–9].
3.4. 29 Si MAS NMR studies
The interpretation of 29 Si MAS-NMR spectra give the
silicate tetrahedra designated as Q n , where Q represents the silicon tetrahedron bonded to four oxygen
atoms and n is the connectivity, i.e., the number of
other Q units attached to the SiO4 tetrahedron under
study. Thus, Q 0 denotes the monomeric orthosilicate
(nesosilicate) and typical of anhydrous
anion SiO4−
4
T A B L E I I I Thermogravimetric data
Weight loss (%)
Temperature range (◦ C)
Samples
100–250
bound H2 O
250–400
400–475
Ca(OH)2
475–600
650–750
calcite
Reference
Tc = 100◦ C
Tc = 200◦ C
Tc = 450◦ C
Tc = 750◦ C
6.7
1.6
1.3
0.4
0.4
1.8
2.3
2.1
<0.1
<0.1
4.6
5.6
5.2
2.53
<0.1
0.5
1.1
0.7
1.1
<0.1
1.7
2.2
1.9
2.3
<0.1
Tc = 450◦ C and afterwards rehydrated
Tc = 750◦ C and afterwards rehydrated
6.1
6.6
2.0
2.5
4.0
4.4
1.0
1.0
2.6
2.6
3018
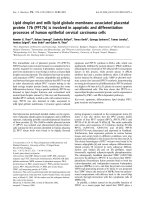
Figure 6 29 Si MAS NMR spectra of the reference specimen (initial cement paste) and the heated specimens at various temperatures (Tc ). The
isotropic chemical shifts are referenced to the T.M.S (Si(CH3 )4 ). The
thick solid line represents the experimental spectrum. The other solid
lines are the gaussian components of the silicate tetrahedra Q n and the
deconvolutions.
silicate of cement (C3 S and C2 S), Q 1 represents an end
group of a chain of C-S-H, Q 2 a middle group, Q 3 a
chain branching site and Q 4 a three-dimensionally fully
cross-linked group. The isotropic chemical shift (δ iso )
of the 29 Si nuclei allows obtaining information concerning the organization of tetrahedral links [22, 23].
The spectra of the different specimens are given in
Fig. 6 and the results of the deconvolution by Gaussian
lines representing the isotropic chemical shift characteristic for each Q n , δ iso , the percentage (%) and full
width at half height (FHWH) are included in Table IV.
T A B L E I V Simulation results of
(ppm)
29 Si
The interpretations of the spectra are based on the bibliography of the C-S-H gels [24–27].
The 29 Si MAS-NMR spectrum of the reference sample shows the characteristic peaks of cement paste in an
OPC or the C-S-H gel [24–27] with the resonance of Q 0
(−71.7 ppm), Q 1 (−79.7 ppm) and Q 2 (−85.5 ppm).
The Q 0 resonance represents the remaining anhydrous
cement that mainly corresponds to C2 S also identified
by XRD as larnite.
The heated specimens of the cement paste in comparison with the reference sample show evolution of
the spectra. After heating at 100◦ C besides the free water of the pores decreases, the structure of C-S-H gel is
altered. From Tc = 100◦ C up to 200◦ C, it appears that
the C-S-H gel progressively decomposes (Fig. 6). The
evolution of the spectra up to Tc = 200◦ C is characterized by low decrease of the intensities of Q 1 and Q 2
tetrahedra but compensated by the formation of a new
anhydrous nesosilicate phase, type Q 0 , that appears at
lower δ iso = −68.7 ppm, shifted 3.2 ppm from initial
Q0.
The sample heated at 450◦ C, shows that the Q 2 tetrahedra disappear, but a new Q 1 resonance is identified.
This sample presents two types of Q 1 tetrahedra, one
typical of C-S-H gel (δ iso = −78.8 ppm) and other at
−74.2 ppm (6 ppm shifted from Q 1 typical). Clearly
the spectrum of this specimen differs from the initial,
but some C-S-H gel still remains with shorter length
chains in the form of Q 1 . The resonances that correspond to the new nesosilicate increase in size (δ iso =
−68.7 ppm) and the initial anhydrous appears at δ iso =
−71.6 ppm.
The heated specimen at 750◦ C shows a total transformation of the initial C-S-H gel (Q 1 and Q 2 structure). However an asymmetric peak with a shoulder is
better noticed in Fig. 7. This indicates that an overlapping of two peaks is possible, one corresponding to Q 0
(δ iso = −72.0 ppm), the initial anhydrous cement, C2 S,
and a new nesosilicate phase (δ iso = −71.0 ppm).
Although literature indicates [12, 28] the formation
of larnite during heating as result of dehydration of
C-S-H, 29 Si NMR tests enable to deduce that the anhydrous new nesosilicate formed is different in the
morphology than initial anhydrous residue with less
crystalline structure.
MAS NMR spectra. The given data are the isotropic chemical shifts (ppm), integration (%) and FWHH
Nesosilicate
New resonance
Anhydrous cement
Q0
Q0
Range of C-S-H gel
New Q 1
Q1
Q2
Samples
δ iso
%
FWHH
δ iso
%
FWHH
δ iso
%
FWHH
δ iso
%
FWHH
δ iso
%
FWHH
Reference
Tc = 100◦ C
Tc = 200◦ C
Tc = 450◦ C
Tc = 750◦ C
Tc = 750◦ C and
afterwards rehydrated
–
–
−68.7
−68.7
−71.0
–
–
–
<5
20
75
–
–
–
3.90
3.80
3.73
–
−71.7
−71.6
−71.9
−71.6
−72.0
−71.1
10
25
25
20
25
10
3.01
3.90
3.50
3.30
3.83
3.01
–
–
–
−74.2
–
–
–
–
–
40
–
–
–
–
–
5.40
–
–
−79.7
−79.6
−79.1
−78.8
–
−79.7
55
45
45
20
–
50
3.80
7.29
6.46
6.51
–
4.81
−85.5
−84.8
−83.8
–
–
−85.5
35
30
30
–
–
40
4.00
6.45
6.50
–
–
4.78
3019
Figure 7 Details of the deconvolution of the 29 Si MAS NMR spectra of the heated specimen at 750◦ C. The new nesosilicate and the anhydrous Q 0
are depicted. Also are showed the asymmetric peak of the resonance and, the shoulder (right), the full widths at half height (FWHH) and the isotropic
chemical shifts (δ iso )(left).
In all specimens, including initial, heated and rehydrated, the anhydrous phase Q 0 is always present with
only a soft increase after heating.
4. Discussion
Handoo et al. [3] followed the transformation occurring within a gradient of temperature between the core
and the surface of the concrete, here, this gradient has
been assumed by heating the samples at different temperatures until reaching the transformations in equilibrium at each temperature. The sequence of transformations in the solid phases of a cement paste are
followed.
Figure 8 29 Si MAS NMR spectra of the reference specimen (initial cement paste), the heated specimen at 750◦ C and this one afterwards the
rehydration into wetting atmosphere during 3 12 months. The isotropic
chemical shifts are referenced to the T.M.S. (Si(CH3 )4 ). The thick
solid line represents the experimental spectrum. The other solid lines
are the gaussian components of the silicate tetrahedra Q n and the
deconvolutions.
The FWHH of Q 1 and Q 2 increase with the heating
treatment, indicating more disordered structure of the
amorphous C-S-H, given in Table IV.
Concerning the rehydrated specimen previously
heated at 750◦ C given in Fig. 8, the anhydrous phase Q 0
remains in similar proportion than at the initial. The new
nesosilicate phase is again transformed into C-S-H gel
by hydration. The anhydrous cement remains in similar
proportion to that in reference sample.
3020
4.1. Microstructure transformations
of the C-S-H at elevated temperatures
Several authors have studied chemical transformations
of cement paste exposed to high temperatures, and
present results agree with their previous found from
XRD, ND and TG [3, 12, 14–17].
The evolution of the crystalline phases observed with
XRD show that some reflections disappear as consequence of high temperatures such as Ca1.5 SiO3.5 ·xH2 O
(after heating at 450◦ C) and ettringite (by heating above
100◦ C), this last also confirmed by neutron diffraction
[12] and others [5–7]. Anhydrous phases as larnite and
brownmillerite seem to be stable respect to temperature, as also indicated by [12, 29]. Increasing the heat
above 450◦ C, the cement paste shows that portlandite
and calcite decompose into lime [3, 12, 14–17].
But in present work by heating from 20◦ C up to
200◦ C an increase of portlandite around 1% has been
detected due to the progress of hydration of residual anhydrous components. This hypothesis is sustained by
the parallel increase in weight loss in the region of Tc
up to 250◦ C (Table III) coming from C-S-H, indicating
higher content of C-S-H gel.
As consequence of heating the C-S-H gel looses
water molecules and OH− groups from the interlayer
space. Cong et al. [18] showed by studying several synthetic C-S-H gels heated up to 200◦ C that the peak
intensities of Q 1 and Q 2 change, and also shows an
increase of FWHH of the 29 Si MAS NMR signals
attributed to a more disordered structure of samples.
The deconvolution of the spectra of C-S-H gels of the
heated cement paste up to 200◦ in present work shows
also the evolution of Q 1 and Q 2 and the increase of
FWHH.
Besides, in ordinary Portland cement pastes the
C-S-H gel is characterized by the CaO/SiO2 ratio, that
ranges between 1.5 to 2.0 [30]. Grutzek [31] points out
for C-S-H gels that a correlation exists between Q 1 /Q 2
and CaO/SiO2 . In present study, the Q 1 /Q 2 ratios of
initial cement paste and those of the specimens heated
at 100 and 200◦ C, are approx. ≈1.5, calculated from
Table IV. Using the correlation of Grutzek the
CaO/SiO2 ratio of heated cement pastes is practically
not modified and preserves their stoichiometry up to
200◦ C.
By increasing the temperature at 450◦ C the NMR
spectrum confirms the progressive transformation of
C-S-H gel. But this C-S-H gel follows a structural modification that differs from a C-S-H gel spectrum of a
hydrated cement paste. The C-S-H gel spectrum after
450◦ C, is similar to that of early stages of hydration of
a C3 S, mainly composed of Q 1 , since Q 2 resonance appears only after about 10 h of hydration [25]. However,
in heated C-S-H gel of cement paste apparently two
types of Q 1 tetrahedra are observed, which suggest that
the Si bonding around each Q 1 tetrahedra vary, while
Q 2 resonance is not detected.
The two Q 1 resonances are shifted of 5 ppm respect
to Q 1 and Q 2 resonance of the initial C-S-H gel in
the reference sample (Table IV). The Q 1 resonance at
−78.8 ppm more likely corresponds to a similar surrounding than others Q 1 tetrahedra in C-S-H gels. To
attribute the new Q 1 resonance (−74.2 ppm), several
hypotheses would be considered:
• If aluminum is introduced in the C-S-H chain:
the substitution SiOSi → SiOAl brings about a
deshielding of ca. 5 ppm for the central silicon atom [22]. However, the new Q 1 resonance
(−74.2 ppm) can not be explained by a silicium
tetrahedra bonded to an aluminum tetrahedra, one
reason is that approximately 93% of aluminum is
in the aluminum phases of the cement paste, in
the form of brownmillerite (Ca4 Al2 Fe2 O10 ) and
ettringite (Ca6 (Al(OH)6 )2 (SO4 )3 (H2 O)26 ), calculated from Table I. In case that a small portion of
aluminum would incorporate into the C-S-H chain,
the amount must be too low to give a so large NMR
signal of the 29 Si NMR seen in Fig. 6.
• Other possibility for the new Q 1 resonance attribution can be obtained from Cong [18], who
considers water molecules bonded to Ca2+ , so
that, the loss of water in the interlayer space by
heating favors the formation of Ca O Si bonds,
which causes some changes of bond angles and
distances in Si tetrahedra. The presence of two different Q 1 tetrahedra in C-S-H gel has only been
described by Klur [32] who pointed out the appearance of a new Q 1 peak in a C-S-H gel hav-
ing a CaO/SiO2 ratio >1.0, located at −76 ppm
and assigned as Q 1p (Si O Ca O H groups). As
the isotropic chemical shift observed in the sample
heated at 450◦ C is close to that of Q 1p tetrahedra,
the new Q 1 resonance could be attributed to this
form.
The final stage of dehydration of the C-S-H gel, pointed
out from present work, is the formation of a new nesosilicate, Q 0 instead of forming the anhydrous cement
structure of C2 S, this last only increase in small proportion. The identification of the dehydrated morphology
of the C-S-H represents enlightenment that allows to
complement that of the crystalline formation of C2 S
as larnite addressed until now [12, 28]. Moreover, the
identification of the new nesosilicate with the 29 Si NMR
spectrum coincides with a discontinuity and change of
slope in the d-spacing of larnite (Fig. 6e given in Ref.
[12]), probably indicating that the formation of more
C2 S is not as that of larnite. The range of the isotropic
chemical shifts of the new nesosilicate, obtained from
the deconvolution of the heated specimens, is narrow
and corresponds to a similar structure (Table IV) but
with less crystalline formation. FWHH of the new Q 0
resonance is larger than initial Q 0 .
The NMR chemical shifts depend primarily on
atomic nearest neighbor and next-nearest neighbor
structure; then, nuclei of atoms in similar local structure resonate at similar chemical shifts. Consequently,
the resonance of the new nesosilicate may be attributed
to a structure close to belite (C2 S) [22] or alite [33, 34].
Although, some authors [12, 28, 35] postulated at high
temperatures the formation of β-C2 S from C-S-H. In order to resolve the final attribution of the new nesosilicate
phase a chemical balance of the solid phases could help.
4.1.1. Determination of the CaO/SiO2
ratio of dehydrated C-S-H
(new nesosilicate)
The chemical balance of CaO and SiO2 for the specimen heated at 750◦ C would allow to determine the
CaO/SiO2 ratio of the new nesosilicate.
The amount of [SiO2 ] is calculated from Tables I and
IV; SiO2 is in: C2 S and in the new nesosilicate (Fig. 6).
The amount of [CaO], may be calculated from
(Tables I, III and IV); CaO is: in C2 S, in CaO (lime), in
dehydrated ettringite, and in brownmillerite.
In order to estimate [CaO] corresponding to lime in
the sample at 750◦ C, it can be assumed that this one
comes mainly from the transformation of calcite and
portlandite, easily calculated from TG test. Calcite and
portlandite vary during heating, the greater amounts
have been considered from Table III. Ettringite and
C-S-H dehydration contribute to CaO but in less proportion, because ettringite does not decompose, only
dehydrates and maintains the short-range order in its
structure [5, 8]. As the amount of CaO from C-S-H is
assumed low. The calculated CaO/SiO2 ratio obtained
for the new nesosilicate resonance is 1.78. So that, it
can be accepted that the new nesosilicate corresponds
to a structure close to C2 S.
3021
4.2. Changes in solid phases during
dehydration and rehydration processes
of cement paste due to heating
4.2.1. Dehydration processes
of cement paste
Cement paste is a complex multiphase material leading
to a composite constituted of solid phases, pores and
water. The chemical transformations occurring in solid
phases of cement paste after heating are the interest
of present work. It is assumed a heating cement paste
showing a gradient temperature profile moving from
a heated and unsealed face that penetrates inside the
bulk to a sealed interior not affected by temperature.
In Fig. 9, the dehydration processes of solid cement
paste phases are schematically described taking into
account results from present study and literature data
[1–3, 10–12, 18].
The degree of transformation of solid phases in cement paste is considered in function of temperature and
the chemical equilibrium is assumed to be reached at
each temperature. The following processes could take
place, from the external heated surface, at 750◦ C to the
interior not affected by temperature:
5. The region from 200◦ C up to 100◦ C, the C-S-H is
present and follows slight dehydration. The New Nesosilicate is not formed. Portlandite coexists with some
calcite (from carbonation during heating), anhydrous
cement phases (larnite and brownmillerite) and dehydrated ettringite.
6. Inside the unaffected zone by heating, that is below 100◦ C, C-S-H, portlandite, ettringite and anhydrous phases are the solid components coexisting. In
this range of temperature free water is also present and
progression of hydration of unhydrated cement phases
is possible, what may justify the increase of C-S-H and
portlandite at this range of temperature. This could be
explained if sealed conditions inside the concrete are
possible, similar to those of an autoclave steam curing [19]. The reason is that the vapor formed in heater
zones, coming from dehydration of solid phases penetrates inside the bulk of the concrete moving to cooler
zones, where condenses due to gas pressure and temperature decrease. This water might participate in further
hydration of anhydrous cement.
The weight loss is another parameter also included in
Fig. 9. There is an increase progress of weight loss in a
heating cement paste, as a consequence of transformation of solid phases. Three critical temperatures with
higher weight losses are differentiated:
1. From the external face, and between 750 to 650◦ C,
the solid phases contain mainly: dehydrated C-S-H
(New Nesosilicate), CaO, Anhydrous phases (Larnite),
and Dehydrated Ettringite [5, 8].
2. Regions exposed at 650◦ C up to 600◦ C, the same
solid phases than above are found plus calcite, this last
formed during heating from reaction of CO2 gas existing in pores.
3. In regions exposed to temperatures below 600◦ C
up to 450◦ C, modified C-S-H coexists with decreasing proportions of the dehydrated C-S-H (new nesosilicate). CaO in decreasing proportions with temperatures is also formed. Besides anhydrous phases
(larnite and brownmillerite) and dehydrated ettringite
are present.
4. In cement paste exposed at 450◦ C up to 200◦ C,
Portlandite coexists with contents of partially dehydrated C-S-H and contents of modified C-S-H and dehydrated C-S-H (new nesosilicate). Calcite, anhydrous
phases and dehydrated ettringite are present.
Below 100◦ C two situations are possible: (a) in unsealed condition, loss, of capillary water that is released
outside the material, and (b) in sealed conditions, as
commented above condensations would take place with
increasing moisture content inside the pores.
However for a full-integrated picture of dehydration
process of cement paste implies to take into account
the transformations in pore microstructure, and correlate with mechanical strength decay and cracks formation. After that, it will be possible to deal into a more
complex degradation model of concrete exposed to fire
Figure 9 Picture of dehydration processes of cement paste exposed to
high temperature environments.
Figure 10 Picture of rehydration of dehydrated cement paste phases
after exposure to high temperature environments.
3022
1. Around 650◦ C, from the decomposition of calcite
and generation of CO2 .
2. H2 O from dehydration of portlandite above
450◦ C.
3. Above 100◦ C from the dehydration of C-S-H.
Figure 11 Esteroscopic microscopy of the heated and afterwards rehydrated specimens (Tc = 450◦ C down and 750◦ C up).
conditions. In this paper the microstructural changes
concerning solid phases of cement paste are addressed,
but the correlation in other microstructure properties
are needed.
4.2.2. Rehydration processes in dehydrated
solid phases of cement paste
The heated cement paste is not stable in the wet atmosphere and rehydration processes take place, Fig. 10
summarizes the evolution of the different phases. The
first is that the rehydration process goes to similar compounds to those initially coming, concerning C-S-H and
portlandite. The C-S-H is formed as a consequence of
rehydration of the new nesosilicate. Larnite remains
unchanged. The CaO would participate in C-S-H rehydration process but it mainly reacts to the formation
of portlandite. Ettringite is rehydrated. Calcite formed
by carbonation during dehydration processes coexists
with rehydrated solid phases.
A progressive damage is developed with coarser
cracking due to rehydration, as noticed in Fig. 11
that has to be addressed together with addition of
microstructural evolution.
5. Conclusions
1. In this paper, a 29 Si MAS-NMR spectroscopy,
complemented by XRD, and TG analysis, show the full
picture of compositional changes occurring in cement
paste due to high temperature action. Results confirm
the loss of free and hydration water, the transformation of portlandite and calcite into lime, and dehydration of ettringite. The initial crystalline C2 S and brownmillerite remain not transformed independently of the
temperature.
3023
But in particular it has been concluded that:
• The heating process induces a continuous dehydration of C-S-H gel with the increasing of temperature. The maximum transformation is at 450◦ C
where the C-S-H chains are only formed by Q 1
tetrahedra, silicate dimers, “modified C-S-H”. Two
Q 1 resonances are observed by NMR.
• Below 200◦ C, possible evolution of hydration of
anhydrous is pointed out.
• Above Tc = 200◦ C a new phase formation from
C-S-H is noticed, dehydrated C-S-H identified as
a “new nesosilicate”, with CaO/SiO2 ≈ 2, assimilated to a structure of C2 S but with less crystalline
structure.
• At 750◦ C, the C-S-H gel has completely disappeared and is mainly replaced by the new nesosilicate phase.
2. The rehydration of a heated cement paste shows
that the process is reversible and new formation of a
C-S-H gel from the new nesosilicate is confirmed with a
CaO/SiO2 ratio close to the initial C-S-H gel and recovering its initial stoichiometry. Also crystalline phases,
which were transformed to lime at 750◦ C, are newly
formed such as portlandite and calcite from carbonation. Ettringite is rehydrated and anhydrous cement
remains practically unaltered.
Acknowledgement
The authors thank the “Minister`ıo de Ciencia y Tecnolog´ıa” and the C.I.C.Y.T of Spain for the funds provided. We also thank to the Department of N.M.R
spectroscopy from the “Universidad Complutense de
Madrid” for the testing facilities.
References
1. J . P I A S T A , Z .
S A W I C Z and L . R U D Z I N S K I , Mater. Struct.
17 (1984) 291.
2. W . M . L I N , T . D . L I N and L . J . P O W E R S C O U C H E , ACI
Mater. J. 93 (1996) 199.
3. S . K . H A N D O O , S . A G A R W A L and S . K . A G A R W A L ,
Cem. Concr. Res. 32 (2002) 1009.
4. S . K . D E B , M . H . M A N G H N A N I , K . R O S S , R . A .
L I V I N G S T O N and P . J . M . M O N T E I R O , Phys. Chem. Minerals 30 (2003) 31.
5. Y . S H I M A D A and J . F . Y O U N G , Adv. Cem. Res. 13 (2001) 77.
6. N . N . S K O B L I N S K A Y A and K . G . K R A S I L N I K O V , Cem.
Concr. Res. 5 (1975) 381.
7. Idem., ibid. 5 (1975) 419.
8. K . K I R A , Y . M A K I N O and Y . M U R A T A , Gypsum Lime 170
(1981) 7.
9. C . K . P A R K , B . K . K I M , S . Y . H O N G , G . Y . S H I N
and H . K . O H , in Proceedings of Int. Congr. Chem. Cem., 10th,
1997, edited by H. Justnes (Amarkai AB, Goeteborg, Swed., 1997)
Vol. 4, p. 4iv068.
3024
View publication stats
10. S .
S H A W , C . M . B . H E N D E R S O N and B . U .
K O M A N S C H E K , Chem. Geol. 167 (2000) 141.
11. S . S H A W , S . M . C L A R K and C . M . B . H E N D E R S O N ,
ibid. 167 (2000) 129.
12. M . C A S T E L L O T E , X . T U R R I L L A S , C . A L O N S O , C .
A N D R A D E and J . C A M P O , Accepted Cem. Concr. Res.
13. M . C A S T E L L O T E , X . T U R R I L L A S , C . A L O N S O , C .
A N D R A D E , I . L L O R E N T E and J . C A M P O , in Proceedings
of Reunion de usuarios de s´ıncroton, San sebast´ıan (Spain), edited
by U.F.M. (Donostia International Physics Center, 2002).
14. M . H E I K A L , Cem. Concr. Res. 30 (2000) 1835.
15. M . S . M O R S Y , A . F . G A L A L and S . A . A B O - E L - E N E I N ,
ibid. 28 (1998) 1157.
16. Y . X U , Y . L . W O N G , C . S . P O O N and M . A N S O N , ibid.
31 (2000) 1065.
17. C . A L O N S O , C . A N D R A D E , E . M E N E N D E Z and E .
G A Y O , Hormig´on y acero 221 (2001) 97.
18. X . C O N G and R . J . K I R K P A T R I C K , Cem. Concr. Res. 25
(1995) 1237.
19. H . F . W . T A Y L O R , “Cement Chemistry” (Academic Press,
London, UK, 1990).
20. S . N . G H O S H , S . L . S A R K A R and S . H A R S H , in “Mineral Admixtures in Cement and Concrete,” edited by S. Rehsi (ABI
Books, New Delhi, 1993) p. 158.
21. D . M A S S I O T , H . T H I E L E and A . G E R M A N U S , Bruker
Report 140 (1994) 43.
22. G . E N G E L H A R D T and D . M I C H E L , in “High-Resolution
Solid-State NMR of Silicates and Zeolites” (John Wiley & Sons,
Chichester, 1987).
¨ GI, E. LIPPMAA, A. SAMOSON, G.
23. M . M A
E N G E L H A R D T and A . R . G R I M M E R , J. Phys. Chem. 88
(1984) 1518.
24. N . J . C L A Y D E N , C . M . D O B S O N , G . W . G R O V E S and
S . A . R O D G E R , in Proceedings of Congr. Int. Quim. Cimento,
8th, edited by (Geral 8o CIQC, Rio de Janeiro Brazil., 1986) Vol. 3,
p. 51.
25. C . M . D O B S O N , D . G . C . G O B E R D H A N , J . D . F .
R A M S A Y and S . A . R O D G E R , J. Mater. Sci. 23 (1988) 4108.
26. M . G R U T Z E C K , A . B E N E S I and B . F A N N I N G , J. Amer.
Ceram. Soc. 72 (1989) 665.
27. R . R A S S E M , H . Z A N N I - T H E V E N E A U , I . S C H N E I D and
M . R E G O U R D , J. Chim. Phys. Phys.-Chim. Biol. 86 (1989) 1253.
28. Z . P . B A Z A N T and M . F . K A P L A N , in “Concrete at High Temperature: Material Properties and Mathematical Models” (Longman
Group Limited, Burnt Mill, Harlow (Essex), England, 1996).
29. P . B E R A S T E G U I , S . G . E R I K S S O N and S . H U L L , Mater.
Res. Bull. 34 (1999) 303.
30. S . M I N D E S S and J . Y O U N G , “Concrete” (Prentice-Hall,
Englewood Cliffs, NJ, 1981).
31. M . G R U T Z E C K , J . L A R O S A - T H O M P S O N and S . K W A N ,
in Proceedings of Int. Congr. Chem. Cem., 10th, 1997, edited by H.
Justnes (Amarkai AB, Goeteborg, Swed, 1997) Vol. 2, p. 2ii067.
32. I . K L U R , Etude par RMN de la structure des silicates de calcium
hydrat´es, Universit´e Paris 6 (Thesis) (1996).
33. R . J . K I R K P A T R I C K and X . D . C O N G , in “An Introduction to
27Al and 29Si NMR Spectroscopy of the Cements and Concretes,”
edited by P. Colombet and A. R. Grimmer (Gordon and Breach
Science Publishers, 1994) p. 55.
34. J . H J O R T H , J . S K I B S T E D and H . J . J A K O B S E N , Cem.
Concr. Res. 18 (1988) 789.
35. R . Y U A N and Z . W A N G , Wuhan Gongye Daxue Xuebao 10
(1988) 7.
Received 15 July
and accepted 30 December 2003