Accounting undergraduate Honors theses: Path to higher education
Bạn đang xem bản rút gọn của tài liệu. Xem và tải ngay bản đầy đủ của tài liệu tại đây (1.87 MB, 32 trang )
University of Arkansas, Fayetteville
ScholarWorks@UARK
Accounting Undergraduate Honors Theses
Accounting
5-2016
Path to Higher Education
Rebecca L. Francis
Follow this and additional works at: />Part of the Accounting Commons, and the Social Statistics Commons
Recommended Citation
Francis, Rebecca L., "Path to Higher Education" (2016). Accounting Undergraduate Honors Theses. 22.
/>
This Thesis is brought to you for free and open access by the Accounting at ScholarWorks@UARK. It has been accepted for inclusion in Accounting
Undergraduate Honors Theses by an authorized administrator of ScholarWorks@UARK. For more information, please contact ,
Path to Higher Education
Introduction
Students graduating this May from universities in South Africa will be the first class that has
grown up in the new South Africa. Since the fall of the apartheid regime in 1994, government policy on
education has been reformed across the entire country and has seen tremendous results. For instance,
grades 1 through 12 in public schools are now free for all students, whereas they had not been before.
However, the hurdles that must be overcome by black students in South Africa are still unbelievably high,
and the standards for education in poor areas are unbelievably low.
This study focuses on a small, impoverished area in Cape Town, which is located on the Western
Cape of South Africa. Those who are familiar with Nelson Mandela and his role in the anti-apartheid
movement might recall that off the coast of Cape Town is where he spent 27 years in the Robben Island
political prison. Cape Town’s cultural history is rich and violent. The effects of apartheid are felt on a
daily basis, especially within the townships, where our research was conducted. A “township” is an
informal living community in which the inhabitants live in crudely constructed shacks; in the United
States it would be called a shantytown. 13.5 percent of the Cape Town population live in the townships;
94 percent of that population is black (City of Cape Town, 2011).
Because these areas are culturally quite separate from the metropolitan city of Cape Town, we
focused our study on the township of Philippi. Philippi was formed in 1974 at the height of apartheid
when many black South Africans were forced to flee from the city to escape political conflict. According
to a study conducted in 2014, the Philippi population is approximately 191,025 people, with 94.1 percent
of that population being black (Anderson et al. 2009). The official language is Xhosa, one of South
Africa’s “click” languages. In 2001 it was reported that the annual average income for a resident of
Philippi was 16,718 South African Rand, which translates to about $3,024 (City of Cape Town, 2011).
1
Path to Higher Education
The public schools in Philippi have been rebuilt by the government and are nice facilities,
especially when compared to the surrounding area. Students are required to wear uniforms, different
colors for different schools; but other than that there is little order when school is in session. Many times
class does not start on time, there are no bells, and the walls reverberate every loud noise, creating a
chaotic environment for learning. According to JM Smith of The DG Murray Trust, “There is also a
strong tendency towards early drop-out from the educational system” (Smith, 2011, p. 7). Problems in the
Philippi school system are prevalent with the simple quality of education hindered by the years of
apartheid.
The South African Education and Environment Project (SAEP) was formed in 1994 following the
end of the apartheid era. The organization was formed to allow supplemental education of both academics
as well as the beautiful environment in Cape Town, to flow into the emerging school system. Beginning
as a small, US-based non-profit, the organization has flourished over the last 20 years, now occupying
two floors of an office building in Cape Town with a full-time staff of over 50 people. As it grew
alongside the new South Africa, it morphed and reformed to meet the needs of the city and continually
pursue its mission:
Prepare and motivate children and youth from under-resourced communities to thrive, through
education, life skills and psycho-social support (SAEP, 2016).
Today SAEP operates with a holistic structure, providing programs for students from pre-school through
college. They also provide psycho-social programs for parents in Philippi.
One of the most important divisions within SAEP is the Impact Centre. Started in 2013, the
Centre employs 5 men and women whose function is to provide support to all of the other programs. They
develop website content, work with teachers on program development, provide career counseling, and
most importantly, conduct research. This project’s research team was brought in to meet the needs of the
middle school and high school programs at SAEP: The Hope Scholars and ADT Teach (named after ADT
2
Path to Higher Education
Company, who fully funds the program), respectively. The Hope Scholars Program (grades 8 and 9)
strives to help students “identify and close educational gaps in key subjects so that they can excel in later
grades” (SAEP). ADT Teach (grades 10-12) is “an information and communications technology (ICT)
computer literacy programme” (SAEP, 2016). Both programs are headed by a small group of teachers that
struggle to keep up with the amount of students enrolled each year.
Students experience extreme obstacles when attempting to further their studies. It is because of
these obstacles to higher education that SAEP began to offer career counseling to their students. By the
spring of 2015, this counseling had been provided to students in both programs for multiple years, yet no
one had collected any data or followed up to track the effect of the counseling. As a result, the
development of SAEP students after graduation was widely unknown by SAEP staff, making it difficult
to understand how to improve the programs. Thus, this study focuses on understanding the career
aspirations of teenage SAEP students living in the impoverished township of Philippi. This was the first
of hopefully many surveys on student’s goals for the future, creating a baseline for future study. The
ultimate goal was to provide SAEP program teachers with substantial data on their students’ career goals,
thereby allowing them to better plan career-focused curriculums. In short, a path to higher education.
Literature review
In the Path to Higher Education research project, the research team sought to understand students’
career and education aspirations, what influenced those choices, and what, if any, access students had to
quality advice and information. The process of the literature review took place over the course of two
months prior to arrival in Cape Town. At a foundational level, the team relied on secondary sources to
inform understanding of the school system in Cape Town townships. Growing up in the New South Africa
especially helped explain the challenges Philippi students face: their home lives, their secondary school
and classroom experiences, and how they view their education (Bray, 2010). Though this book was about
other townships in Cape Town, much of the book’s conclusions applied to Philippi as well. SAEP’s
Philippi profile applied to the Philippi context (Anderson, 2009).
3
Path to Higher Education
Shaping the Future of South Africa’s Youth: Rethinking Post-School Education and Skills
Training provided an in-depth look at how South Africa’s higher education system (qualifications,
application process, etc.) works. The “complexity of the qualifications system” for tertiary institutions
contributes to students and parents’ confusion over “where best to invest their very scarce resources in
post-school education or training in order to access the labour market” (Perold, 2012, p. 187). As
resources are slim, students and their parents are obligated to make decisions about tertiary education
without much help. Additionally, the complexity of these decisions is not aided by clear guidance or
information. Skills for Inclusive Growth indicated that little is known about why people choose particular
courses of study and reinforced the assumption that students made such decisions “based on hearsay, on
incorrect information, and on pressure in the family or from peers” (DBSA, 2010, p.35). Connecting
Young South Africans to Opportunity outlined the current research on students’ “lack of information,
guidance, and job search capability” (Smith, 2011, p. 34).
This lack of or misinformation manifested in a variety of places. Skills for Inclusive Growth also
suggested that students “arrive at institutions, wanting to do a particular course of study but do not have
the school subjects required. They dropout because they do not have information on what courses require
and are unable to decide for themselves what course of study to pursue” (DBSA, 2010 p. 36).
Additionally, Connecting Young South Africans to Opportunity outlined the hurdles facing youths’ efforts
to achieve employment, including a lack of education, foundational skills, and high rates of high school
drop-out (Smith, 2011). This paper asserted that, though a matric pass is the first step to gainful
employment, it is not a ticket to higher education. The assumption was that most students believed this to
be true.
Finally, the literature provided useful insight into what influences students’ decisions. Mark
Watson et al found that more than 80 percent of surveyed students in grades 5 and 6 aspired to high status
occupations (Watson et al., 2010). In From School to Higher Education: Factors Affecting the Choices of
Grade 12 Learners, Michael Cosser and Jacquers Du Toit found 14 separate factors influencing students,
4
Path to Higher Education
with enhancing employability, interest in a field of study and if it leads to higher income as the top three
(2002).
The creation of the research tool was influenced by many sources. Thompson et al discusses the
factors that contribute to career decision self-efficacy in young people in the article The Relation of Social
Status to the Career Decision-Making Process. The ultimate conclusion of this study was that, while
highly predictive of career decision self-efficacy, social status is not the only factor at play. Rather,
perceived social status is more important for young people (Thompson 299). In that sense, the survey
prompts were that of a qualitative nature, intended to pull out students’ thoughts on their own social
status, as well as to understand cultural norms with respect to higher education. Additionally, Mark
Watson’s Occupational Aspirations of Low Socioeconomic Black South African Children was highly
enlightening, due to its uncanny resemblance to this project. Within the small scope of this study, the
team was able to use Watson’s research findings to enhance the survey questions, specifically in
developing hypotheses. He found and provided a list of most popular jobs among students (Watson et al.,
2010). These jobs were corroborated by a target group of recently graduated Philippi students enrolled in
SAEP’s Bridging Year program. Watson et al also found that “the majority of the children aspired to
occupations of a higher status level than they are likely to achieve if one considers South African labor
statistics” (Watson et al., 2010, p. 728). This finding is reflected in our list of hypotheses:
H1: The students lack clear guidance or knowledge about tertiary education.
H2: The students maintain false expectations for their career goals.
H3: The students’ career goals are motivated by a desire for high status and respectability.
H4: The students have lofty goals for their future careers.
The students enrolled in SAEP programs, as well as all other students in the townships, are
severely debilitated by the South African school system. Although progress has been made in the last 21
years, the system is far from perfect; and the students in the townships must work harder to be successful.
5
Path to Higher Education
The JM Smith in Connecting Youth South Africans to Opportunity cites multiple reasons for the lack of
opportunity for students, including lack of entrepreneurship, lack of work-related capabilities, and early
school drop-out (Smith 6-8). In addition to these things, it seems that the most important factor is the lack
of available higher education. In an article entitled Pathways Through the Education and Training
System: Do We Need a New Model? the author Cosser discusses research conducted by the Human
Sciences Research Council (HSRC) on this matter by suggesting that “colleges have been closed down
and for a variety of reasons… universities loom disproportionately large in the post-school learner
imagination” (Cosser, 2011, p. 71). The lack of availability, as well as poor advertising, have led students
in poor areas to imagine that university is their only option, when in fact, community colleges and
technical school are sometimes even more reliable options (Cosser, 2011).
Methodology
With these resources in hand, the process of creating a proper research tool began. Due to the
severe time constraints on the project, it was decided that a survey should be administered to as many
students as possible. The final participant demographics are displayed are displayed in Table 1. The
survey started as a two-page document, featuring an extensive Likert-scale questionnaire and other
qualitative prompts (Exhibits 1 and 2). Over a period of four weeks, this survey changed drastically with
help from SAEP staff members, as there were many issues to address.
The most time-sensitive issue was when to administer the survey. Upon arrival into the country,
the students were entering their system’s equivalent of finals season. For three weeks, all students were
busy “writing exams” and so were not available for survey-taking. It was determined that the most
convenient time for ADT Teach students was directly following exams, during SAEP’s week-long
holiday program. The Hope Scholars would take it the following week. That timeline left roughly four
weeks to revise and pilot the survey.
Table 1: Participant Demographics
6
Path to Higher Education
Male
Female
TOTAL
39
Grade 9
15
24
(22%)
56
Grade 10
18
38
(31%)
58
Grade 11
23
35
(32%)
27
Grade 12
7
20
(15%)
63
117
180 participants
TOTAL
(34%)
(66%)
(100%)
The survey questions themselves were developed by extensive discussion between the Impact
Centre staff and the research team. As previously mentioned, the research tool needed extensive revising
from the original document. The hope was to obtain narrative responses from the students for a more
complete set of information; however, after consulting SAEP staff and local Xhosa speakers, it was
determined that the survey needed to be more broken up, with short responses required for each prompt,
in order to facilitate understanding.
Throughout the process of making revisions, the language barrier presented the most
complications. The high school ADT Teach students were more than capable of completing the survey in
English; however, the middle school aged Hope Scholars were not as experienced in their second
language. The team consulted an SAEP staff member who had knowledge of translating English to
Xhosa, and it was advised that the team revise the Hope Scholar survey to more remedial English, so that
it could be better understood. The translation process from English to Xhosa is extensive, as the two
languages are not similar in structure. The rewording of the Hope Scholars survey allowed for more
efficient analysis, as well as providing practice in English for the younger students.
The final issue that needed to be addressed was the vocabulary used in the survey. After many
revisions, the surveys were presented to a native Philippi Xhosa speaker, who informed the team that the
word choice was skewed toward American English, rather than South African English. For this reason,
some parts of the survey were rephrased to be more easily understood, especially within the Hope
7
Path to Higher Education
Scholars survey (see Exhibit 2). The survey was also piloted to a small group of students in the days prior
to administration in order to make final adjustments based on phrases they found difficult to interpret.
Minor phrasing changes were made, and the students in the ADT Teach program that volunteered to pilot
the survey were excluded from the final results. The administration of the survey was over a period of two
weeks. Both ADT Teach students and Hope Scholars took the surveys during SAEP program time, so that
at least 3 adults were available for help. It was necessary to clarify the more complex prompts prior to the
students beginning the survey. A perfectly controlled environment could not be obtained, but overall the
environment for administration was a typical classroom setting, with no more than 20 students
participating at one time. Survey results were collected, coded into Microsoft Excel, and analyzed using
Excel’s pivot table function.
Results
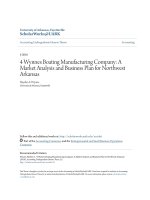
Students were asked to indicate what job they wanted. 60 percent of all participants listed a job
that is considered high profile (doctor, chartered accountant, and engineer). 36 percent listed a mid-profile
job (e.g., journalist, manager, and teacher). 1 percent listed a low-profile job (e.g., personal assistant, and
security guard). The number of students who wanted a high profile job had a negative relationship to the
student’s grade: 69 percent of ninth graders listed a high profile job, while only 44 percent of twelfth
graders did. In contrast, the number of mid-profile jobs had a positive relationship to grade: 28 percent of
ninth graders indicated a mid-profile job, while 56 percent of twelfth graders did. See Graph 1.
Students were asked which factors they found most important when choosing a job. 62 percent
(88 students) marked enjoyment/skill as the most important factor in their choice. When split up by grade,
this number decreased as grade increased. There was no significant difference between males and
females. 17 percent (24 students) marked that the job is high paying as most important. 11 percent marked
that people respect people who do that work, and 9 percent marked the job’s accessibility. Concerning
respectability, 34 percent listed respect of the job as the least important factor to their decision. This
number was decidedly higher for respondents in the twelfth grade: 59 percent listed respect as least
8
Path to Higher Education
important to their decision. However, in another survey question, 91 percent of students stated that it was
important that people respect what they do in their future career.
Graph 1: Percentage of job profiles of students’ aspirations by grade
Percntage
80%
60%
40%
High profile
20%
Mid-profile
0%
9
10
11
12
Grade
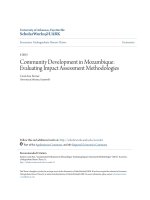
Students were asked which jobs they believed were respected within the community, as well as
which jobs they would consider. The list of jobs on the survey was pulled from Watson’s Occupational
Aspirations of Low Socioeconomic Black South African Children (2010, p. 727). Graph 2 shows student
responses about the listed jobs. Graph 3 shows the percentages of students who said they thought a job
was respected and that they would consider that job, as well as the opposite pairing; it is intended to show
the positive relationship between respect and consideration by the students.
Many survey questions were geared toward learning about students’ personal spheres. 56 percent
of students did not know anyone who had the job to which they aspired. The majority of relationships
were casual or non-acquaintances, e.g. a family member’s employer, someone met through a career fair,
or a person seen on TV. The ADT Teach students were also asked if they had ever spoken to the person
they knew. Of these students, only 39 percent had spoken to the person they knew about their job.
9
Path to Higher Education
Graph 2: Students’ perception of respected jobs v. jobs students would consider
Graph 3: Jobs students respect and would consider v.
jobs students do not respect and would not consider
Expectations
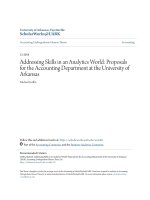
Students also had high expectations for their classmates in the ADT Teach program. 86 percent
responded that the students in ADT Teach were most likely to study at a university after they left high
school. In contrast, only 44 percent of respondents thought students in their school as a whole would
study at a university (see Charts 1 and 2).
10
Path to Higher Education
Chart 1: What students believe their ADT Teach classmates will do after high school
Take a gap year
Work
blank
Study at college
Study at
university
Chart 2: Students’ responses to what they believe their schoolmates will do after high school
Be unemployed
Blank
Study at college
Work
Take a gap year
Study at
university
High School Subjects and University Requirements
ADT Teach students were asked to indicate what subject or major they would need to study to get
the job they wanted. 46 percent (65 students) did not know or gave a vague answer (e.g., “university” or
“I plan to study whatever that goes with my career”). 31 of these students were in the 10th grade, 29 were
in the 11th grade, and 15 were in the 12th grade.
11
Path to Higher Education
The entire sample was asked if they believed their high school courses would allow them to
pursue their career, and were then prompted to circle the courses they were currently taking (or planning
to take if a Hope Scholar). 69 percent said they believed their high school courses would meet the
minimum requirements for their intended area of study at college or university. However, only 57 percent
of those who believed this actually had subjects that matched an intended area of study. 26 percent said
they do not know if their high school courses will meet minimum requirements – 19 in the 10th grade, 15
in the 11th grade, and 3 in the 12th grade. See Graph 4 in the appendix. 54 percent of students listed an
actual area of study, as opposed to the vague “university” answers. Of those, 92 percent also were taking
subjects that would qualify them for their intended area of study. 79 percent of respondents said that
passing matric guarantees their acceptance at a university. While passing matric certainly qualifies them
to apply, there is no guarantee of acceptance; and students did not seem to realize this. Students were then
asked which factor they believed was most important in choosing the right course of study. These results
were widely varied, with the majority of students (26 percent) believing that learning which subjects
would most help them in their area, as well as understanding the minimum requirements, were most
important (see Graph 5 for all responses).
Graph 5: Students’ responses about which factor was most important for choosing the right course of
study
12
Path to Higher Education
Influences and Advice
Students gained information from many sources, but two sources were chosen as most trusted:
Teachers and the Internet, 34 percent and 30 percent, respectively. Chart 3 displays the total responses of
sources most trusted by the students. 69 percent of ADT Teach students listed parents as a source of
information, but only 38 percent of students stated that the opinions and desires of their parents affect
their education and job decisions. 37 percent said their parents’ opinions had no factor and 25 percent
were neutral. Graph 6 in the appendix displays the breakdown of all career information resources listed by
students.
Chart 3: Students’ responses to most trusted source of information
Other
Parents
Siblings
SAEP tutor
Other
relatives
Teachers
Internet
Friends
Applying to University
The majority of students intended to move on to higher education. 98 percent said they planned to
continue their education after high school, and 88 percent strongly agreed that attending university or
college was important to them. Students also had an idea of which universities or colleges they would
apply to. 57 percent agreed or strongly agreed with such a statement; 16 percent disagreed and 28 percent
were neutral. However, they had many questions about applying to university, with 91 percent saying
they wished they knew more about the process of applying to university or college. Students were asked
13
Path to Higher Education
to write out which aspects of the application process they wished they knew more about. The results were
varied, but common themes were expressed by the majority of students. The summary of these responses
is represented in Table 2.
Table 2: What students wished they knew more about
The application process
Financing education
How to apply
How to get bursaries (financial aid)
How to apply online
Financial aid options
Fees, deadlines, marks requirements, pass rates
Cost of tuition
Where to apply & necessary documents
Students’ questions grew more specific the older they were:
Grade 10
1.
2.
3.
4.
How and when to apply
What marks they needed and “how to be accepted”
How much everything costs
What university life is like
Grade 11
1.
2.
3.
4.
What documents are needed when applying
Requirements for being accepted
Application and tuition fees
How to get a bursary (government financial aid)
Grade 12
1.
2.
3.
4.
5.
Requirements for being accepted
How to apply online
How to get financial aid
Course fees and details
What happens if they are not accepted?
When asked if they were worried about how they would be able to pay for college or university,
76 percent agreed with that statement. Even so, students intended to apply to universities, and usually
prestigious ones. 74 percent of ADT Teach students said they would rather attend a university than a
14
Path to Higher Education
college, and only 9 percent said that people would respect them if they went to a college. When ADT
Teach students were asked to mark the two places they were most likely to apply to, 74 percent of the
respondents chose at least one high profile university: University of Cape Town (UCT) or Stellenbosch
University. 84 percent chose only universities for both of their responses, and did not indicate a
community college or technical school option. Graph 7 displays the results of post-school options chosen.
When ADT Teach students were asked to indicate the most important factor in being accepted to that
institution, 61 percent responded that understanding the minimum requirements was the most important.
See Graph 8 for the breakdown of responses.
Students intedning to apply
Graph 7: Students’ responses about where they intended to apply
100
90
80
70
60
50
40
30
20
10
0
University of Stellenbosch University of
Cape
North Link College of
Cape Town University
Western
Peninsula
College
Cape Town
Cape
University of
Technology
|
University
|
College
False Bay
College
Other
|
Graph 8: Students’ Responses to which factor is most important for being accepted to a university or
college
75%
60%
45%
30%
15%
0%
Learning which
subjects will help
me in my area of
study
Understanding
minmum
requirements
Improving my
English skills
Getting financial
aid
15
Attending open Speaking to people
Asking my
days
who have studied teachers questions
Path to Higher Education
Discussion
It is important to note that the students in both the Hope Scholars and ADT Teach programs are
not a random sample of all students in Philippi schools. Though these students are not necessarily selected
based on their grades, it is possible that students who apply to these programs are potentially more
motivated than the average Philippi student. However, as the goal of this study was to develop a baseline
for SAEP staff about the knowledge of their students, the results confirmed many worries.
The students had high expectations of themselves. The majority of participants wanted to pursue
a high-profile career: jobs that require high levels of schooling, are high paying, and generate respect,
such as a doctor or a chartered accountant. The pressing issue became whether students are qualified to
pursue these jobs, either because of their marks or because of the high school courses they have chosen.
Though SAEP did not want students to be discouraged from their goals, there was a risk of setting them
up for disappointment if they made plans for a career that they simply will not be qualified to do.
Additionally, most students planned to apply to high-profile universities, as opposed to colleges and
technical schools. These lofty goals were often coupled with a lack of real knowledge or understanding of
what it will take to get there. The majority of students did not personally know anyone who has the job
they want, they lacked concrete career or education advice, and they indicated that they have many
unanswered questions about applying to universities and colleges.
Which Jobs Students Wanted and Why
The information displayed in Graph 1 shows a negative relationship between grade in school and
the profile of jobs students aspire to. This relationship indicates that as students move into higher grades,
their expectations get lower, whether from change in taste or perhaps a more realistic outlook. One of the
hypotheses of the study was that students would be more motivated by the respect of their job aspiration,
leading them to highly competitive fields. The results showed that most students did want a high profile
job. However, the majority of students’ career aspirations were motivated not by respect, but by what they
16
Path to Higher Education
enjoy or are skilled in, despite having no experience in the more popular, professional fields such as
medicine, law, and accounting. Graphs 2 and 3 also revealed that students would not necessarily consider
a job just because it was highly respected. For high, mid, and low profile jobs, students marked whether
they thought people respected the job and whether they would consider the job. Though the percentages
of respect marks varied widely, the percentages of considerations stayed in the mid to low range. For
future studies, Graph 2 also provided a solid baseline for what students consider to be high, mid, and low
profile jobs.
Lack of Information
Very few students saw people in their personal spheres acquire the jobs they wanted. And even if
they did, the majority of those had never spoken to that person about how they had done it. Though
students can certainly be successful in their goals without knowing someone in their intended profession,
this lack of familiarity could indicate a lack of real knowledge about what the job entails and what it will
require to procure it.
The results showed that students feel less pressure from their friends or parents than
hypothesized, citing teachers and the internet as their most trusted sources of information. However, the
results also indicated that students often made plans either with misinformation or a lack of information,
so it is possible that students felt more pressure than they admitted. While students indicated that their
parents were sources of information about post-school options, very few students said that their parents’
wishes were important to their decision-making, instead relying on advice from others. Students also did
not have meaningful advice readily at hand. When asked to write the most useful career advice they had
received, the great majority of the students wrote what could be considered obscure, trivial advice, e.g.
“to work hard” or “to do what you love.” Very few students wrote concrete advice that would make the
process of applying to university or choosing a job easier. Of course, students are self-selecting what
advice they think is most useful; but the vast number of students who wrote trivial advice indicates that
they lack clear guidance.
17
Path to Higher Education
Making plans for the future
The results clearly showed that students are not making the vital connection between their subject
choice and career goals. Instead, they operate under common misconceptions, such as erroneously
believing that passing matric (the final exam to complete high school) would ensure acceptance at
university. Unfortunately, because of the restrictive nature of the South African school system, students
must choose their high school subjects carefully. They must choose either a medical/science tract or a
business tract; and those courses dictate which major they are able to choose in university or college. If a
student takes the business tract in high school, it is nearly impossible to be accepted to a scientific college
program. Nearly half of the ADT Teach students did not know what they needed to study in order to get
the job they wanted, so because they did not consider their course of study when choosing their high
school subjects, their efforts could be severely hindered later on.
Despite these results, many students were confident that their high school subjects would enable
them to get the degree and the job they wanted. However, those students who had a plan were likely to be
taking the correct high school subjects. These students also provided legitimate advice from their trusted
sources and had the correct course of study listed to get the job they wanted. As far as applying to
schools, the results confirmed SAEP staff’s fears that the students were generally not planning to apply to
any affordable options, choosing instead the most expensive: UCT and Stellenbosch. Additionally, the
questions that students listed, especially grade 12, were worrying, as they did not seem to be
knowledgeable about many crucial to do items, such as applying for financial aid. And although many
students acknowledged that understanding minimum requirements for acceptance is very important, they
were not aware what the requirements are. Overall there was an unmistakable lack of important
information.
18
Path to Higher Education
Moving Forward
These results were presented to the SAEP program directors and staff at the end of the project.
While the overall state of the students’ career plans was disappointing, the staff was thrilled to know that
students did not seem to feel daunted by the obstacles in their way. The value of the project was that it
provided the staff a concrete baseline for creating new approaches to career counseling. They will also be
able to use these surveys in the future to track progress over time. As that was the goal of the project, it
was a success.
Unfortunately, on a larger scale, what remains to be solved is the general state of educational
reform in Cape Town. The system still fails to cater to the needs of those who come from lower
socioeconomic places. While the reform has resulted in new buildings, equipment, and playgrounds in the
townships, the real problem is the quality of education. Teachers are not incentivized to go above the call
of duty, and students are rarely rewarded for hard work and diligence. Instead, they must make these
career decisions earlier than they arguably should have to. Should this study be conducted again in the
future, there should be more information collected about students’ perceptions of their role in society and
whether they feel that they can be successful in this system. The goal of SAEP’s career counseling is to
provide students with realistic information about how to get where they want to go, while also making
sure they are aiming high and staying encouraged. It is a fine line between dreaming and the awareness of
reality. The South African Education and Environment Project is working hard to make sure their students
walk as close to that line as possible. It was a pleasure to aid them in that initiative.
19
Path to Higher Education
Bibliography
Adlard, G. (2009). An Introduction to Philippi. Unpublished Draft 1 4.11.08.
Anderson, V, Sepideh A, and Anya van Wyk. (2009). Philippi Community Profile: Final Report. SAEP.
/>Babson, A. (2014) Developing Possibilities for South African Youth: Beyond Limited Educational Choices?
Annals of the American Academy of Political and Social Science 652, no. 1 p. 149–65.
doi:10.1177/0002716213514342.
Bowles, A., Fisher, R., McPhail, R., Rosenstreich, D., and Dobson, A, (2014). Staying the Distance: Students’
Perceptions of Enablers of Transition to Higher Education. Higher Education Research & Development
33, no. 2 p. 212–25. doi:10.1080/07294360.2013.832157.
Bray, R. (2010). Growing up in the New South Africa Childhood and Adolescence in Post-Apartheid Cape
Town. Cape Town: HSRC press.
City of Cape Town. (2012). 2011 census
Cosser, M., and Du Toit, J. (2002) From School to Higher Education?: Factors Affecting the Choices of Grade
12 Learners. Research Monograph / Research Programme on Human Resources Development. Cape
Town: HSRC.
Cosser, M. (2010) The Skills Cline: Higher Education and the Supply-Demand Complex in South Africa.
Higher Education 59, no. 1 p. 43–53. doi:10.1007/s10734-009-9231-z.
Council on Higher Education, South Africa (2013). VitalStats: Public Higher Education, 2011. Pretoria:
Council on Higher Education.
Diamond, A,. Jones, S., Roberts, J., and Vorley, T. (2012) Behavioural Approaches to Understanding Student
Choice. York: Higher Education Academy.
Florian, K. (2015). SAEP history. Retrieved 3/30, 2016, from />Perold, H., Cloete, N., Papier, J., (2012) Centre for Higher Education Transformation, and University of Cape
Town, eds. Shaping the Future of South Africa’s Youth: Rethinking Post-School Education and Skills
Training. Somerset West, South Africa: African Minds.
Rankin, N. A., and Robert, G. (2011) “Youth Unemployment, Firm Size and Reservation Wages in South
Africa.” South African Journal of Economics 79, no. 2 p. 128–45. doi:10.1111/j.1813-6982.2011.01272.x.
Development Planning Division, DBSA (2010). Skills for Inclusive Growth: Towards a Long-Term Strategy
for Higher Education and Training. />0long-term%20strategy%20for%20higher%20education%20and%20training.pdf.
SAEP. (2016). About. Retrieved 3/30, 2016, from www.saep.org
Smith, J.M. (2011) Connecting Young South Africans to Opportunity Literature Review and Strategy. Cape
Town: DG Murray Trust. />
20
Path to Higher Education
Spaull, N., and Kotze, J. (2015) Starting behind and Staying behind in South Africa: The Case of
Insurmountable Learning Deficits in Mathematics. International Journal of Educational Development,
no. 41 p. 13–24.
Thompson, M. N., and Mezydlo Subich, L. (2006) The Relation of Social Status to the Career DecisionMaking Process. Journal of Vocational Behavior 69, no. 2 p. 289–301. doi:10.1016/j.jvb.2006.04.008.
Yu, D. (2013) Youth Unemployment in South Africa Revisited. Development Southern Africa 30, no. 4–05 p.
545–63. doi:10.1080/0376835X.2013.830964.
Watson, M., McMahon, M., Foxcroft, C., and Els, C. (2010) Occupational Aspirations of Low Socioeconomic
Black South African Children. Journal of Career Development 37, no. 4 p. 717–34.
21
Path to Higher Education
Appendix
Number of Students
Graph 4: Students who indicated they did not know what course to study
9
10
11
12
Grade
Graph 6: Students’ resources for career information
22
Path to Higher Education
Exhibit 1: ADT Teach final survey
23