Oxidation characteristics of porous-nickel prepared by powder metallurgy and cast-nickel at 1273 K in air for total oxidation time of 100 h
Bạn đang xem bản rút gọn của tài liệu. Xem và tải ngay bản đầy đủ của tài liệu tại đây (6.07 MB, 13 trang )
Journal of Advanced Research 8 (2017) 717–729
Contents lists available at ScienceDirect
Journal of Advanced Research
journal homepage: www.elsevier.com/locate/jare
Original Article
Oxidation characteristics of porous-nickel prepared by powder
metallurgy and cast-nickel at 1273 K in air for total oxidation time of
100 h
Lamiaa Z. Mohamed a,⇑, Wafaa A. Ghanem b, Omayma A. El Kady c, Mohamed M. Lotfy a, Hafiz A. Ahmed a,
Fawzi A. Elrefaie a
a
Mining, Petroleum and Metallurgical Engineering Department, Faculty of Engineering, Cairo University, Egypt
Corrosion and Surface Protection, Central Metallurgical Research and Development Institute (CMRDI), Helwan, Egypt
c
Powder Technology Division, Central Metallurgical Research and Development Institute (CMRDI), Helwan, Egypt
b
g r a p h i c a l a b s t r a c t
a r t i c l e
i n f o
Article history:
Received 21 May 2017
Revised 15 August 2017
Accepted 17 August 2017
Available online 19 August 2017
Keywords:
High temperature oxidation
Porous nickel
Cast nickel
Duplex macrostructure
Inward migration
Linear kinetics
a b s t r a c t
The oxidation behavior of two types of inhomogeneous nickel was investigated in air at 1273 K for a total
oxidation time of 100 h. The two types were porous sintered-nickel and microstructurally inhomogeneous cast-nickel. The porous-nickel samples were fabricated by compacting Ni powder followed by sintering in vacuum at 1473 K for 2 h. The oxidation kinetics of the samples was determined gravimetrically.
The topography and the cross-section microstructure of each oxidized sample were observed using optical and scanning electron microscopy. X-ray diffractometry and X-ray energy dispersive analysis were
used to determine the nature of the formed oxide phases. The kinetic results revealed that the porousnickel samples had higher trend for irreproducibility. The average oxidation rate for porous- and castnickel samples was initially rapid, and then decreased gradually to become linear. Linear rate constants
were 5.5 Â 10À8 g/cm2 s and 3.4 Â 10À8 g/cm2 s for the porous- and cast-nickel samples, respectively.
Initially a single-porous non-adherent NiO layer was noticed on the porous- and cast-nickel samples.
After a longer time of oxidation, a non-adherent duplex NiO scale was formed. The two layers of the
duplex scales were different in color. NiO particles were observed in most of the pores of the porousnickel samples. Finally, the linear oxidation kinetics and the formation of porous non-adherent duplex
oxide scales on the inhomogeneous nickel substrates demonstrated that the addition of new layers of
Peer review under responsibility of Cairo University.
⇑ Corresponding author.
E-mail address: (L.Z. Mohamed).
/>2090-1232/Ó 2017 Production and hosting by Elsevier B.V. on behalf of Cairo University.
This is an open access article under the CC BY-NC-ND license ( />
718
L.Z. Mohamed et al. / Journal of Advanced Research 8 (2017) 717–729
NiO occurred at the scale/metal interface due to the thermodynamically possible reaction between Ni and
the molecular oxygen migrating inwardly.
Ó 2017 Production and hosting by Elsevier B.V. on behalf of Cairo University. This is an open access article
under the CC BY-NC-ND license ( />
Introduction
Nickel is known to form only one oxide which exhibits a small
range of non-stoichiometry, Ni1Àx O, this oxide behaves as a p-type
semiconductor [1–3]. The oxidation status formed on Ni surfaces is
studied by low energy bombardment using X-ray photoemission
spectroscopy and secondary ion emission spectroscopy. The dominant nickel oxidation state is Ni2+ while some Ni3+ are present
[4]. The oxidation of homogenous pure nickel substrates over the
temperature range 700–1100 °C yields an adherent protective
layer of nickel oxide [5,6]. In situ study for the oxidation behavior
of nickel particles is carried out using environmental transmission
electron microscope with 3.2 mbar of O2 between ambient temperature and 600 °C [7]. The kinetics of the oxide scale growth on the
surface of non-porous homogenous nickel substrate and the scale
characteristics are extensively studied [6,8–10]. Regardless of
these extensive studies, discrepancies and important questions
concerning nickel oxidation behavior are still to be answered [6].
At temperature over 1000 °C, the oxidation rate for homogenous
nickel substrates is parabolic [5,6,11,12]. Thermogravimetric studies show that the oxidation process of sintered nickel green compacts in air at temperatures between 300 and 450 °C follows also
a quadratic dependence on time [13]. For temperature ranging from
700 to 900 °C the oxidation rate is initially rapid. The rate then gradually decreases to become parabolic or continuously decreases
[6,14]. The scale growth on homogenous nickel samples oxidized
at temperatures over 1000 °C is controlled by cationic lattice diffusion; whereas, the short circuits diffusion of cations controls the
scale growth at temperatures ranging from 700 to 900 °C [6].
When the temperature ranges from 900 to 1000 °C, the parabolic rate constants become widely distributed [15]. Several reasons were proposed for this phenomenon: metal purity [1],
surface preparation [16], heat treatment [17] and the crystallographic orientation of nickel grains [18] modify the scale-growth
rate dramatically [15]. A theoretical framework is devolved to provide an understanding of selected set of experimental finding of
the oxidation process by single oxidant, this framework can be
used as a predicted basis for oxidation rates under different conditions [19].
Under practical conditions, the protective oxide scales are
exposed to internal stresses which cause loss of adherence, and
consequently, duplex oxide scales are developed [5]. High temperature oxidation of inhomogeneous nickel might lead to formation
of microfissures, transgranular crack propagation, porous oxide
scales and cavity formation. Therefore, the oxide scales grow linearly by inward migration of molecular oxygen [6]. There are three
main routes for the formation of microfissures and inward growth
of NiO by migration of molecular oxygen: dissociation of the scale
into pores and metal/oxide interface, stress-induced fissuring in
the oxide scale and opening of microfissures as a consequence of
differences in the rate of deformation across the growing oxide
due to the inhomogeneity of the metal substrate [6].
Linear formation of NiO duplex scales is associated with inward
migration of molecular oxygen [1,8,20–22]. The inner layer at the
metal/scale interface is noticed to be consisting of small equiaxed
grains overgrown by larger columnar grains in the external part;
this type of scales is formed at temperature below 1000 °C [8].
Most of the nickel-based alloys might have inhomogeneous
structure, and since limited systematic studies on the oxidation
behavior of inhomogeneous nickel and nickel-based alloys were
carried out, the characteristics of the oxidation behavior of essential structural metals and alloys should be given a priority to determine the oxidation resistance of these materials at hightemperature. The inhomogeneity might arise from the presence
of pores at the metal surface or from microstructural heterogeneity. Therefore, the main aim of this work is to carry out a comparative orderly study on the high temperature oxidation behavior of
porous-nickel prepared by conventional powder metallurgy and
cast-nickel with microstructural inhomogeneity in air at 1273 K
under atmospheric pressure for a total oxidation time of 100 h.
Experimental
The porous nickel test-samples used in this investigation were
fabricated from nearly spherical particles of nickel powder with
an average particle size of about 85 mm. Nickel green samples
were compacted under 420 MPa and the green samples were then
sintered in a vacuum furnace (10À3 torr) at 1473 K for 2 h. Testspecimens were produced as pellets with 18.5–19 mm in diameter and 3.5–3.7 mm in thickness. The obtained samples had an
average apparent density of 7.58 g/cm3, and in turn, the average
porosity of test-samples was about 14.8%. The average density
value for the inhomogeneous cast-nickel samples was measured
and found to be 8.6 g/cm3. Thus, its average porosity was estimated to be 3.4%.
The composition of nickel powder and cast-nickel as given by
the suppliers and as obtained by wet chemical analysis are listed
in Table 1. The composition obtained by wet chemical analysis verified to a great extent the chemical composition given by the suppliers. The data in Table 1 indicates that the total impurity level in
the nickel powder is about 0.1% and that of the cast-nickel ranges
from 0.1 to 0.2%.
For microstructural examination of test-samples, a pellet of
each type of test-samples was mounted and ground successively
with silicon carbide abrasive papers with grit size ranging from
100 to 800, and then polished with 0.3 mm alumina paste. The samples were then etched in an aqueous solution consisting of 15 cm3
nitric acid (70 wt% HNO3+30 wt% H2O) and 90 cm3 acetic acid
(99.5 wt% CH3COOH) [23]. The microstructure of the etched pellets
was observed by optical microscopy using ‘‘Olympus BX41M-LED
microscope” and scanning electron microscopy (SEM) utilizing
‘‘FEI Company, Quanta 250 FEG, made in Netherlands”.
The oxidation kinetics was measured for three porous-nickel
samples (1, 2, and 3) and three cast-nickel samples (4, 5, and 6).
The measurements were performed for each sample individually
to examine the reproducibility of the process. The oxidation kinetics of each sample was carried out in air at 1273 K for a total oxidation time of 100 h. The weight gain per unit area as a function of
time for each sample was observed during the oxidation test using
the gravimetric method; a microbalance with an accuracy of 10À4 g
was used in this investigation.
Visual and photographic examinations were conducted to view
the macrostructure of the formed oxide scales. Microstructure
observations were carried out by using optical microscopy, and
scanning electron microscopy (SEM) which was also employed to
view the topography of the formed oxide scales. Diffraction patterns of each of the surfaces of the oxidized six samples were
obtained using X-ray diffractometry (XRD) using ‘‘X’Pert PRO PAN
719
L.Z. Mohamed et al. / Journal of Advanced Research 8 (2017) 717–729
Table 1
The chemical analysis of nickel powder and cast-nickel samples.
Elements, %
Composition
Nickel powder
C
S
Fe
Cu
Zn
As
Pb
Co
Ni
a
b
C
Cast nickel
Given by the suppliera
Obtained by wet chemical analysisc
Given by the supplierb
Obtained by wet chemical analysisc
0.08
0.001
0.01
–
–
–
–
–
Bal.
0.07
N.D.
0.015
–
–
–
–
–
99.9
<0.0035
0.019–0.025
–
<0.0008
<0.002
<0.0015
<0.0003
<0.065
Bal.
0.1
N.D.
–
0.0001
N.D.
N.D.
0.0002
0.0003
99.83
Analysis given by the supplier (Dop. company).
Analysis given by the supplier (Vale company of valeTM electrolytic nickel s-rounds).
results of the wet chemical analysis in the laboratories of the ‘‘Egyptian Mineral Resources Authority (EMRA)”.
(e)
(a)
(c)
Optical image of
Optical image of
Optical image of the periphery
porous-nickel
the core of cast-nickel
of cast-nickel
(b)
(d)
(f)
SEM image of porous-
SEM image of the core of
SEM image of periphery of
nickel
cast-nickel
cast-nickel
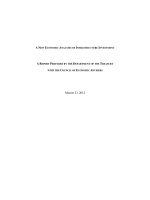
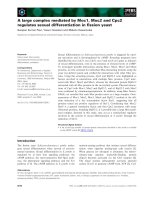
Fig. 1. Optical and SEM images of porous-nickel (a and b), cast-nickel core (c and d), and cast-nickel periphery (e and f) of test-samples.
analytical diffractmeter (made in Netherlands, 2007), with Cu Ka
radiation-k = 0.15406 nm, 45 kV and 40 mA”. X-ray energy dispersive analysis (EDAX) using ‘‘FEI Company, Quanta 250 FEG analyzer
(Netherlands)” was employed for spot EDAX elemental (O and Ni)
analysis and also for having oxygen and nickel profiles along the
cross-section of oxidized samples.
For the microstructure examination of the cross-section of the
oxidized pellets, each sample was vertically mounted in a mould,
and then ground successively with silicon carbide abrasive papers
with grit size ranging from 80 to 800 until almost one half of the
sample was removed, and then the cross-section was polished with
0.3 mm alumina paste.
720
L.Z. Mohamed et al. / Journal of Advanced Research 8 (2017) 717–729
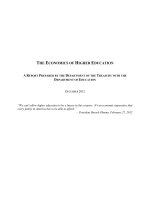
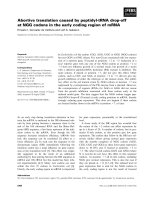
Fig. 2. The dependence of the weight gain of three test-samples of porous-nickel and three test-samples of cast-nickel on time 2(I), their average weight gain 2(II), and
average oxidation rate 2(III) oxidized in air at 1273 K for 100 h.
Results and discussion
Microstructure of the metal test-samples
Typical optical and scanning electron images of porous-nickel
and cast-nickel (core and periphery) test-samples are shown in
Fig. 1, which clearly indicates the formation of pores and triple
points at the grain boundaries of porous-nickel, Fig. 1(a) and (b).
The microstructural inhomogeneity of a typical cast-nickel testsample is also shown in Fig. 1, where equiaxed grains are found
at the core, Fig. 1(c) and (d), and elongated grains are formed at
the periphery as shown in Fig. 1(e) and (f). Spot EDAX results for
porous-nickel and the periphery of the cast-nickel samples indicated the existence of only oxygen and nickel peaks. The oxygen
L.Z. Mohamed et al. / Journal of Advanced Research 8 (2017) 717–729
721
Fig. 3. XRD patterns obtained from the surfaces of the oxidized samples of porous-nickel samples (a) sample (1), (b) sample (2), and (c) sample (3) and for the oxidized castnickel samples (d) sample (4), (e) sample (5), and (f) sample (6).
percent indicator (OI) at different spots of the porous-nickel samples reached up to 2.64% while the corresponding value at the
periphery of cast-nickel samples was about 1%. The spot EDAX
results at the cores of cast-nickel samples had no oxygen peaks
(a sign of negligible content of oxygen at the core of the castsamples).
Oxidation kinetics
Fig. 2(I) shows the dependence of weight gain per unit area of
each of the three test-samples of porous-nickel, Fig. 2(I-a), and
each of the three test-samples of cast-nickel, Fig. 2(I-b). All kinetic
curves indicated that the oxidation rate was initially rapid and
722
L.Z. Mohamed et al. / Journal of Advanced Research 8 (2017) 717–729
Table 2
The relative intensity percent of the peaks of the XRD pattern obtained from the surfaces of the six samples and the corresponding peaks reported in literature for NiO powder
[25].
Sample No.
Relative intensity percent
NiO Powder [25]
Sample 1 (Porous-nickel)
Sample 2 (Porous-nickel)
Sample 3 (Porous-nickel)
Sample 4 (Cast-nickel)
Sample 5 (Cast-nickel)
Sample 6 (Cast-nickel)
(1 1 1)
(2 0 0)
(2 2 0)
(3 1 1)
(2 2 2)
(4 0 0)
68
5
65
100
36
100
58
100
100
100
35
100
63
46
44
17
35
28
27
56
100
14
14
9
8
6
21
32
10
2
4
3
3
16
16
3
2
41
3
2
8
16
(a)
(c)
A photographic image of the
A photographic image of the
duplex scale formed on
duplex scale formed on
porous-nickel
cast-nickel
(b)
A photographic image of the cross-section
of an oxidized
porous-nickel sample
(d)
A photographic image of the
cross-section of an oxidized
cast-nickel sample
Fig. 4. The macrostructure of the duplex oxide scales formed on porous-nickel samples (a and b) and on cast-nickel samples (c and d).
then gradually decreased over a period of about 40 h (transientstage). Later, a linear rate (steady-state rate) was observed. At
some points during the steady-state period, the kinetic rates
showed a rapid increase for a short period of time and then it
started to slow down again nearly to the steady-state linear rate.
This rapid increase might arise from the development of more easy
paths which allow molecular oxygen migration such as microcracks propagation, cavities development and partial separation of
the oxide layers from the metal substrate [8]. These easy paths
for molecular oxygen migration might be due to the development
of internal stresses within the oxide scales [8].
The dependence of the average weight gain per unit area on time
is shown in Fig. 2(II). The average weight gain per unit area for the
three porous- and also for the three cast-nickel samples are plotted
in Fig. 2(II-c) and (II-d), respectively. Both Figures were found to
behave linearly after about 40 h for the rest of the oxidation process.
The bars shown in the figures represent the standard deviation at
each point. The highest value of the standard deviation for the aver-
L.Z. Mohamed et al. / Journal of Advanced Research 8 (2017) 717–729
723
Fig. 5. SEM images for the surfaces of the oxidized porous-nickel test-samples of (a)
sample (1), (b) sample (2) and (c) sample (3).
Fig. 6. SEM images for the surfaces of oxidized three cast-nickel test-samples of (a)
sample (4), (b) sample (5) and (c) sample (6).
age weight gain per unit area of the porous-nickel samples was ±58%
and the corresponding value for the cast-nickel samples was ±41%.
This, in turn, might be caused by the higher inhomogeneity of the
porous-nickel samples than that of the cast-nickel samples.
The dependence of the average rate of oxidation on time is
shown in Fig. 2(III). The average rate of oxidation is estimated by
using the relation DWav/Dt where DWav is given by the change
in average weight gain per unit area over the time period Dt. The
dependence of the average oxidation rate for porous- and castnickel is shown in Fig. 2(III-e) and (III-f), respectively. It is clear
from all Figures that the growth rate of the oxide scales at the initial stage is rapid and then it slows down until it reaches a constant
value (linear behavior). The values of the linear rate constants were
about 5.5 Â 10À8 g/cm2 s and 3.4 Â 10À8 g/cm2 s for porous- and
724
L.Z. Mohamed et al. / Journal of Advanced Research 8 (2017) 717–729
cast-nickel, respectively, which means a better oxidation resistance of cast-nickel than porous-nickel.
Texture analysis of the outer oxide layers
The diffraction patterns, Fig. 3, obtained from the surfaces of the
oxidized samples, under the oxidation conditions used in this
work, confirmed that Ni1Àx O is the only oxide phase formed which
is in agreement with literature [1,24]. Accordingly, the relative
intensity percent of the peaks of the XRD pattern obtained from
each of the surfaces of the oxidized samples might reflect the texture of each of the outer oxide layer.
Fig. 3 shows the XRD patterns obtained from the outer surfaces
of the oxide scales formed on the six nickel samples (three porous
and three cast). The obtained peaks coincided with the peaks
reported for nickel oxide powder in literature [25].
The relative intensity percent of the obtained peaks of the six
patterns obtained from the surfaces for the test-samples and the
corresponding peaks reported for NiO powder in literature [25]
are listed in Table 2. These data indicated that the oxide grains in
the outer oxide layers of the scales might have crystallographic
(1 1 1), (2 0 0), and (2 2 0) preferred orientation for samples (3
and 5), (1 and 4) and 6, respectively. This preferred orientation
might refer to the formation of columnar grains at the outer part
of the oxide scales.
Macrostructure of the oxide layers
Fig. 4 shows the macrostructure of the duplex oxide scales
formed on a porous- sample and on a cast-nickel test-sample as
detected by visual examination. Fig. 4(a) and (b) show that the
color of the outer oxide layer formed on a porous-nickel sample
is black with glossy and dark parts, and the color of the inner layer
is light green. The two oxide layers formed on the cast-nickel samples are shown in Fig. 4(c) and (d). The outer one had a dull
greenish-black color, while the color of the inner oxide layer was
light green. The formation of colored-duplex scale is reported in
previous work [24]. The molecular oxygen inward migration leads
to the formation of NiO duplex scales [21,22], which are generally
composed of small equiaxed grains at the metal/oxide interface
overgrown by larger columnar grains in the external part, the
duplex scales are generally formed at temperatures less than
1273 K [8].
Surface topography and microstructure of the oxidized nickel samples
Fig. 5 shows the surface topography observed by SEM for the
oxide scales formed on the three porous-nickel samples 1, 2, and
3, as shown in Fig. 5(a)–(c), respectively. The surface topography
of the porous-nickel samples shows a dimpled structure surrounded by cleavage zones, Fig. 5(a), facetted structure, Fig. 5(b),
and pores within the nickel oxide grains, Fig. 5(c), which might
have acted as nuclei for the dimples. Fig. 6(a)–(c) also show the
topography observed by SEM for the surfaces of oxide scales
formed on the three cast-nickel samples 4, 5, and 6, respectively.
The presence of facetted structure and parallel microfissures across
some grains (the parallel directions differ from one grain to
another) is revealed from Fig. 6(a) and (b). Moreover, pores are
detected within the grains on the surfaces of these scales, Fig. 6(c).
The EDAX results obtained at different spots of the mentioned
surfaces showed that the OI varied from about 6% to 18%. This
variation might be caused by the porosity of the scale and the
unevenness of the surfaces of the oxide scales.
Figs. 7 and 8 illustrate the microstructures of the cross-sections
of the oxidized porous- and cast-nickel samples. Fig. 7(a) and (b)
show the optical images of the porous- and cast-nickel samples,
Fig. 7. Optical images of the cross-sections of oxidized porous-nickel test-sample
(a) and cast-nickel test-sample (b).
respectively; whereas Fig. 8(a) and (b) show the SEM images and
the corresponding oxygen and nickel line-profiles for the oxidized
porous- and cast-nickel samples, respectively. The optical and SEM
Figures indicated that oxide duplex scales were developed on the
porous- and cast-nickel test-samples. The two layers were partially
separated from each other because of the formation of cavities
between the two layers. In some parts, the lower layer (about
50 mm in thickness) was overgrown by an upper layer (about
100 mm in thickness). In other parts, the lower layer was noticed
to be less than 10% of the thickness of the upper layer. The two
oxide layers of the duplex scale were noticeably porous.
The nickel and oxygen line-profiles recorded along the crosssection of the oxidized samples are also shown in Fig. 8. It was
noticed that the oxygen profile was high along the oxide scale and
that it decreased to an almost very low level along the metal phase
region; while the nickel profile was observed to have its highest
level over the metal phase region. The oxygen profile increased over
cavities to its highest value because these cavities were filled with
air. Also, if a closed pore was just underneath the surface layer, both
oxygen and nickel profiles would simultaneously get lower. The
EDAX profiles in Fig. 8 also indicate the formation of NiO particles
within the pores of the porous-nickel samples; since repeated peaks
of oxygen are observed on the oxygen profile and these oxygen
peaks are associated with decrease in the nickel profile.
L.Z. Mohamed et al. / Journal of Advanced Research 8 (2017) 717–729
725
Fig. 8. SEM images and line EDAX profiles for oxygen and nickel along the cross-sections of oxidized porous-nickel test-sample (a) and cast-nickel test-sample (b).
Fig. 9. SEM image for the porous-nickel substrate and EDAX results for an NiO particle formed inside one of the pores (p).
726
L.Z. Mohamed et al. / Journal of Advanced Research 8 (2017) 717–729
Fig. 9 shows an SEM image and the corresponding spot EDAX
results on a particle developed at one of the sample pores (P).
The spot EDAX results yielded only Ni and O peaks which, in turn,
indicated the formation of NiO particles.
SEM images of the cross-sections of the cast-nickel samples
before and after oxidation are shown in Fig. 10. The images indicate the formation of voids within the metallic phase after oxidation; this phenomenon is previously reported in literature [26].
The size of these voids decreased with the depth in the metallic
phase measured from the scale/metal interface. The density
number of these voids was also decreasing with that depth until
they nearly vanished. The SEM image in Fig. 10 indicates that the
cast-nickel samples were almost free from porosity before
oxidation, as shown in Fig. 10(a). The formation of voids after oxidation within the metallic phase is revealed from Fig. 10(b).
The OI of the outer oxide layer formed on porous-nickel samples was 11.56% and almost the same value was detected for the
inner oxide layer while a value of about 1.5% for the OI was
obtained in the metal substrate. As for the cast-nickel, the OI of
the outer oxide layer is about 11.54% and almost the same value
was obtained for the inner oxide layer while a value of 0.85%
was detected for the OI of the metal phase.
The volume fraction percent of the voids decreases with the
increase in depth, below the scale/metal interface of the oxidized
cast-nickel test-sample as shown in Fig. 11 which also shows the
high volume fraction of the pores developed within the oxide scale
formed on the metal substrate. The high values of the volume fraction of the pores at the surface of the oxide scale revealed that the
pores were initially nucleated at the surfaces of the oxidized samples; while the highest value of the volume fraction was developed
at the scale/metal interface. This could be mainly related to the formation of cavities at the scale/metal interface; which is attributed
to the loss of adherence at the oxide/metal interface resulting from
the development of internal stresses [5,8].
Adherent and protective nickel oxide scales are formed on purehomogenous nickel substrates upon oxidation in air (or oxygen) at
Fig. 10. SEM images of the cross-section of a cast-nickel sample before oxidation (a) and after oxidation (b).
Fig. 11. The percentage of the volume fraction of voids with the depth below the oxidized cast-nickel sample surface of Fig. 10(b).
727
L.Z. Mohamed et al. / Journal of Advanced Research 8 (2017) 717–729
1273 K [11,24]. The scales are grown by outward cationic lattice
diffusion [6,11,24]. The average parabolic rate constant of the oxidation process of nickel under these conditions is about
3.5 Â 10À11 g2/cm4 s. Accordingly, the thickness of the NiO layer
formed in this case is about 35 mm which is 4–5 times smaller than
the thickness of the oxide layer, about 150 mm, formed on the inhomogeneous cast-nickel used in this work. Moreover, the depth of
the metal substrate region containing voids detected in this work
is found to be about 130 mm; which is not observed in the case
of oxidation of sound-homogenous pure nickel [11].
Oxidation mechanism
Fig. 12 shows the topography of initially formed oxides on
porous- and cast-nickel samples observed by SEM after oxidation
time of 10 and 30 min. Fig. 13 also illustrates the microstructure
(a)
of the cross-sections of oxidized porous- and cast-nickel samples
noticed by SEM after 10 and 30 min oxidation time. Fig. 12
(a) and (c) indicate the formation of a highly porous oxide layer
on the porous-nickel samples oxidized for 10 and 30 min, respectively, while Fig. 12(b) and (d) show the buildup of a network of
ridges with a cellular appearance of NiO layer on the cast-nickel
samples which were oxidized for 10 and 30 min, respectively.
The cross-section images also indicate the formation of a discontinuous thin layer on the porous-nickel test-samples, as shown in
Fig. 13(a) and (c), and the formation of NiO particles within the
pores of the porous-nickel test-samples. Microcracks propagation
extending from the pores of porous test-samples through the metal
matrix was, also, noticed. This, in turn, might be due to the acting
internal stresses which could be induced by the NiO particles
formed within the pores. Microcracks were also observed to extend
from the NiO layer formed on the surface of the porous-nickel
(b)
Surface topography, 10 min
Surface topography, 10 min
oxygen% indicator = 13.26
oxygen% indicator = 4.36
(c)
(d)
Surface topography, 30 min
Surface topography, 30 min
oxygen% indicator = 14.08
oxygen% indicator = 12.78
Fig. 12. SEM images of the surface topography of the oxidized samples for 10 and 30 min formed on the porous-nickel samples (a and c) and the cast-nickel samples for 10
and 30 min (b and d).
728
L.Z. Mohamed et al. / Journal of Advanced Research 8 (2017) 717–729
test-samples to the inner metal phase region. Fig. 13(b) and (d)
indicate the formation of fragile NiO layers on the cast-nickel
test-samples. The formation of a highly porous single layer on both
cases indicated that the oxidation mechanism at the initial oxidation period was controlled by inward migration of molecular
oxygen.
The values of OI detected by spot EDAX analysis were 13.2% and
14.08% for the thin layers formed on the porous-nickel samples
after 10 and 30 min, respectively. The corresponding values for
cast-nickel were 4.36% and 12.78%; this might be due to the discontinuity of the thin layers and the ridge structure of this oxide
layer which was formed on the cast-nickel after 10 min of
oxidation.
After about 40 h of oxidation, steady-state conditions (linear
oxidation rate) started to dominate the growth rate of the oxide
scales and the scales were observed to be of duplex nature.
The formation of a duplex scale might be initiated by loss of
adherence between the single layer and the metal substrate due
to the buildup of internal stresses within the oxide scale giving
the possibility of formation of a second layer between the upper
oxide layer and the metal substrate.
The linear kinetics, the topography of the oxide scales which
revealed the formation of paths for molecular oxygen migration,
the duplex-porous scale, the formation of cavities and formation
of NiO particles within the pores of the porous-nickel samples,
all indicate the growth of oxide scales by inward migration of
molecular oxygen along the NiO scale [1,8,21,22]. The oxygen
molecules might also migrate through the open pores of the
porous-nickel samples forming NiO particles within these pores.
On the other hand, most of the voids formed within the matrix
of the cast-nickel samples, which were relatively smaller than
the pores of the porous-nickel, did not include NiO grains.
(a)
(b)
10 min
10 min
(c)
(d)
30 min
30 min
Fig. 13. SEM images of the cross-section of the oxidized samples for 10 and 30 min formed on the porous-nickel samples (a and c) and the cast-nickel samples (c and d).
L.Z. Mohamed et al. / Journal of Advanced Research 8 (2017) 717–729
Accordingly, the oxidation mechanism based on inward migration of molecular oxygen through the NiO duplex-scale should be
the main mechanism for the oxidation process of inhomogeneous
nickel substrates. The formation of the voids within the metallic
phase of the cast-nickel might be explained on the basis of annihilation of vacancies formed at the oxide/metal interface in the metal
phase lattice as previously reported [26].
Conclusions
The oxidation behavior of two types of inhomogeneous nickel is
systematically investigated. The oxidation rate for both types is initially rapid and then it gradually decreases with time to a constant
rate which is attained after about 40 h. The linear rate constants
are about 5.5 Â 10À8 g/cm2 s for the porous-nickel type (porosity
14.8%) and 3.4 Â 10À8 g/cm2 s for the cast-nickel type. Initially single thin porous NiO layers are formed on the surfaces of the testsamples of both types. The single layers then change to duplex
scales. The two layers of the duplex scales, in general, have two different colors and both are porous. Cavities are formed between the
two layers and also at the scale/metal interface. Therefore, the two
layers do not adhere to each other; in addition the oxide scale is
partially separated from the metal phase. Nickel oxide particles
are formed in most of the pores of the porous-nickel substrate.
The cast-nickel type shows voids formation in the metal phase
whose size and distribution number decrease with depth, measured from the scale/metal interface. In other words, the voids volume fraction decreases with depth. The topography views of the
upper surfaces of the NiO scale indicate the formation of easy paths
for downwards migration of molecular oxygen. The easy paths
include pores, microfissures, dimples and transgranular microcracks. All these observations reveal that the scale growth occurs
by inward migration of molecular oxygen; therefore, the newly
formed oxide layers take place at the scale/metal interface.
Conflict of Interest
The authors have declared no conflict of interest.
Compliance with Ethics Requirements
This article does not contain any studies with human or animal
subjects.
References
[1] Atkinson HV. A review of the role of short-circuit diffusion in the oxidation of
nickel, chromium, and nickel-chromium alloys. Oxid Met 1985;24(3/
4):177–97.
729
[2] Neil B, Gerald HM, Fred SP. Introduction to the high-temperature oxidation of
metals. 2nd ed; 2006. p. 46–8.
[3] Ahmed JH. Study of optical and electrical properties of nickel oxide (NiO) thin
films deposited by using a spray pyrolysis technique. J Mod Phys
2014;5:2184–91.
[4] Saric I, Peter R, Kavre I, Badovinac IJ, Petravic L. Oxidation of nickel surfaces by
low energy ion bombardment. Nucl Instr Meth Phys Res B 2016;371:286–9.
[5] Zhou CH, Ma HT, Wang L. Comparative study of oxidation kinetics for pure
nickel oxidized under tensile and compressive stress. Corr Sci 2010;52:210–5.
[6] Haugsrud R. On the high-temperature oxidation of nickel. Corr Sci
2003;45:211–35.
[7] Jeangros Q, Hansen TW, Wagner JB, Dunin-Borkowski RE, Hebert C, Herle JV,
et al. Oxidation mechanism of nickel particles studied in an environmental
transmission electron microscope. Acta Mater 2014;67:362–72.
[8] Chevalier S, Desserrey F, Larpin JP. Oxygen transport during the high
temperature oxidation of pure nickel. Oxid Met 2005;64(314):219–34.
[9] Huntz AM, Lefevre B, Cassino F. Roughness and oxidation: application to NiO
growth on Ni at 800°C. Mater Sci Eng A 2000;290:190–7.
[10] Unutulmazsoy Y, Merkle R, Fischer D, Mannhart J, Maier J. The oxidation
kinetics of thin nickel films between 250 and 500 °C. Phys Chem Chem Phys
2017;19:9045–52.
[11] Elrefaie FA, Manolescu A, Smeltzer WW. Oxidation properties of nickel in the
temperature range 1073–1500 K. J Electrochem Soc 1985;132(10):2489–93.
[12] Gulbransen EA, Andrew KF. The kinetics of oxidation of high purity nickel. J
Electrochem Soc 1954;101(3):128–40.
[13] Cabanas-Polo S, Bermejo R, Ferrari B, Sanchez-Herencia AJ. Ni–NiO composites
obtained by controlled oxidation of green compacts. Corros Sci
2012;55:172–9.
[14] CzeMrinski F. The growth and structure of thin oxide films on nickel
superficially modified with ceria and cerium. PhD McGill University.
Montreal; 1997.
[15] Peraldi R, Monceau D, Pieraggi B. Correlations between growth kinetics and
microstructure for scales formed by high-temperature oxidation of pure
nickel. II. Growth kinetics. Oxid Met 2002;58:275–95.
[16] Nairong S, Lanting Z, Zhigang L, Feng S, Xianping D, Aidang S. The effect of
surface machining on the high-temperature oxidation of a single crystal Nibased superalloy. Mater Trans 2014;55(10):1540–6.
[17] Caplan D, Graham MJ, Cohen M. Effect of cold work on the oxidation of nickel
at high temperature. J Electrochem Soc 1972;119(9):1205–15.
[18] Louis PB, Megan F. Effects of crystallographic orientation on the early stages of
oxidation in nickel and chromium. J Mater Sci 2010;45:1663–71.
[19] Young DJ. High temperature oxidation and corrosion of metals. 2nd ed.; 2016.
p. 85.
[20] Atkinson A, Smart DW. Transport of nickel and oxygen during the oxidation of
nickel and dilute nickel/chromium alloy. J Electrochem Soc 1988;135
(11):2886–93.
[21] Kofstad P. On the formation of porosity and microchannels in growing scales.
Oxid Met 1985;24(5/6):265–76.
[22] Mrowec S. On the mechanism of high temperature oxidation of metals and
alloys. Corr Sci 1967;7:563–78.
[23] John CL, Samuel DK. Welding metallurgy and weldability of nickel-base alloys;
2009. p. 420.
[24] Gordon EZ. Some high temperature oxidation characteristics of nickel with
chromium additions. Project Designation NR 031-355. California Institute of
Technology; 1956.
[25] Taylor D. Thermal expansion data. I. Binary oxides with the sodium chloride
and wurtzite structures, MO Brit Ceram Trans J 1984; 83: 5.
[26] Simon P, Bernard V, Daniel M, Laurence R, Eric A. Injection of vacancies at
metal grain boundaries during the oxidation of nickel. Acta Mater 2004;52
(18):5375–80.