Dissecting lipid accumulation of microalgae Nannochloropsis oculata using fluorescent image analysis
Bạn đang xem bản rút gọn của tài liệu. Xem và tải ngay bản đầy đủ của tài liệu tại đây (1.15 MB, 7 trang )
5
TẠP CHÍ PHÁT TRIỂN KHOA HỌC & CÔNG NGHỆ:
CHUYÊN SAN KHOA HỌC TỰ NHIÊN, TẬP 2, SỐ 5, 2018
Dissecting lipid accumulation of microalgae
Nannochloropsis oculata using fluorescent
image analysis
Trinh Cam Tu, Tran Thanh Huong, Bui Trang Viet
Abstract—Cell suspension of Nannochloropsis
oculata was cultured in a modified f/2 medium to
study the changes of lipid content during phases of
growth. The growth of cell suspension was
determined by measuring the cell density and
diameter under light microscope. To observe and
evaluate the accumulation of lipid droplets in
microalgae cells, lipid droplets were stained with Nile
Red fluorescent dye then examined under
fluorescence microscope and the obtained images
were analyzed using Fiji ImageJ, an image
processing program. The cell density increased
quickly at the first 6 days of culture while cell
diameter reached the highest value at the 8 th day and
20th day of culture. The presence of lipid droplets in
the cells could be observed from the 20th day of
culture. The size of lipid droplets was gradually
increased after 60 days. Treatment of depleted
nitrogen for 4 days resulted an increase in the
accumulation of lipid. The intracellular lipid
accumulation during phases of growth of the cell
suspension under nitrogen-depleted conditions was
also discussed.
Keywords—Fiji ImageJ, lipid, microalgae culture,
Nannochloropsis oculata
S
1. INTRODUCTION
torage lipids in microalgae is a potential source
of biodiesel, an alternative energy replaces
fossil fuels [1-3]. Fluorescence microscope, Nile
Red dye, and ImageJ software were used to
observe and evaluate the shape, size, and density
of some intracellular pigments or lipid droplets in
microalgae [4-10]. The experimental results
showed that the lipid yield was enhanced in
nitrogen-depleted condition in comparison to
Received: 12-9-2017, accepted 20-01-2018, published 2011-2018
Trinh Cam Tu, Tran Thanh Huong, Bui Trang Viet –
University of Science, VNU-HCM
*Email:
nitrogen rich condition [11]. In this study, we used
ImageJ software to analyze the fluorescent images
of Nannochloropsis oculata cells stained by Nile
Red. The lipid accumulation of microalgae cells
during phases of growth under nitrogen sufficient
and nitrogen-depleted conditions was also
analyzed.
2. MATERIALS AND METHODS
Microalgae Nannochloropsis oculata was
cultured in Erlenmeyer flask with 20 mL of a
modified f/2 medium of Chiu et al. (2009) [12]. In
this modified f/2 medium, triple concentrations of
macro-elements and micro-elements were used,
and artificial sea water was used instead of natural
sea water. The artificial sea water has the
following composition (per liter): 29.23 g NaCl,
1.105 g KCl, 11.09 g MgSO 4.7H2O, 1.21 g Trisbase, 1.83 g CaCl2.2H2O, and 0.25 g NaHCO3.
Cell suspensions culture of Nannochloropsis
oculata
Cell suspensions of Nannochloropsis oculata at
the day 6 of culture were transfered to Erlenmeyer
flasks containing 20 mL of modified f/2 medium.
At the beginning of culture, the cell density was
106 cells/mL and the cell diameter was about 3.14
± 0.06 µm. The growth conditions were: 12 hours’
light/dark cycle, 2800 ± 200 lux, and 28 ± 2 oC.
The cultures were rotated at 75 round per minute
(RPM) (GFL 3019 shaker, Germany).
Effects of nitrogen-depleted condition in growth
and lipid accumulation of Nannochloropsis
oculata
Microalgae cell suspensions at the day 6 were
cultured in Erlenmeyer containing modified f/2
medium without nitrogen for 2, 4, or 6 days. After
that, the packed cell volume (PCV) of cell
suspensions was collected by centrifugation at
2000 RPM in 15 minutes, at 4 oC and the harvested
6
SCIENCE & TECHNOLOGY DEVELOPMENT JOURNAL:
NATURAL SCIENCES, VOL 2, ISSUE 5, 2018
cells were then transferred to modified f/2
medium. The results were then compared to the
one of the control, the cell suspension was cultured
for 10 days in modified f/2 with 0.88 M nitrogen.
The cell density, cell diameter and lipid
accumulation were evaluated after the treatments
and 10 days of culture in modified f/2 medium
with and without nitrogen.
Measurements of cell density and diameter
The cell density of Nannochloropsis oculata
was measured by counting the total number of
cells and clusters in hemocytometer under light
microscope (Kruss, MBL 2000) [13]. A drop of 5
μL of cell suspension was placed in Neubauer
Improved chamber (Assistent, Germany). The
chamber was observed under light microscope at
400X to count the total number of cells and
clusters. The measurement was carried out in
triplicate with 3 sample/time. Cell diameter was
measured by using an eyepiece micrometer under
light microscope. The measurement was conducted
10 times with 10 cells or/ and clusters/time.
Evaluation of lipid droplets in microalgae cell
using Nile Red staining
Nile Red was dissolved in dimethylsulphoxide
(DMSO) at a concentration of 0.5 mg/mL and
stored in dark at 4 oC. A volume of 20 µL of Nile
Red solution was added to 100 µL of microalgae
cell suspension and incubated in darkness for 15
minutes at room temperature. Fluorescence was
observed under fluorescent microscope (Olympus
CKX41, objective lens 40X, ocular lens 16X). The
experiments were repeated 3 times with 3
samples/time.
Fluorescence microscopy
Fluorescence microscope (Olympus CKX41)
was used to observe Nile Red fluorescence.
Yellow fluorescence of Nile Red was viewed
under the excitation of light with 460 –480 nm
wavelength and the emission of light with 530 –580
nm wavelength. The images of stained cells were
taken at the 30th seconds of light exposure using
Leica camera (DFC450).
Picture analysis by Fiji ImageJ software
Pictures of fluorescence were analyzed by Fiji
ImageJ software, version 1.50e for Macintosh,
with Analyze Particles function. In this method,
we used some defines to clarify fluorescence such
as [4]:
Number of cells was counted in the images
which was taken under normal light. Number of
fluorescent cells was counted in the images which
was taken under excitation and emission light.
Fluorescent region was the yellow region under
excitation of 460–480 nm and a fluorescent region
is equal to an intracellular lipid droplet.
Fluorescent regions whose areas were less than 10
square pixels were considered non-significant
therefore be eliminated. The cell could show no or
negligible fluorescent regions.
Area and Integrated Density were the two
indexes of Fiji ImageJ. In that, Area index
corresponded to the size of the fluorescence region
of lipid droplets and the Unit of Area was square
pixel. One μm2 equaled to 17.4 square pixel. Total
area (μm2) was the sum of all areas of all
fluorescent regions. Integrated Density was
changed from 0 to 255. This index represented the
brightness of fluorescent region. Total integrated
density was sum of integrated densities of all
fluorescent regions.
Statistical analysis
Results in all experiments were tested with
Duncan’s test at significant level 0.05 using IBM
SPSS Statistic version 20.0 for Macintosh. Data in
tables were shown as mean ± SE (standard error)
following by different alphabets which were
expressed the differences in statistical analysis.
3. RESULTS AND DISCUSSION
Fluorescence of lipid droplets staining by Nile
Red
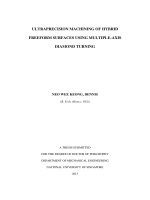
Lipid droplets showed yellow fluorescence with
Nile Red dye under the excitation wavelength of
460-480 nm (Fig. 3). The number of fluorescent
regions corresponded to the number of lipid
droplets in the cells. The size of lipid droplet was
featured by the area of fluorescent regions.
In the sample, the cell suspension at the day 20th
of culture was used to evaluate the intracellular
lipid droplets by analyzing the fluorescence images
of Nile Red stained cells using Fiji ImageJ. In the
images which had taken under normal light, there
were 15 microalgae cells while in the images
which had taken under excitation light, there were
5 fluorescent cells. Fig. 1 showed the result
exported from Fiji ImageJ.
TẠP CHÍ PHÁT TRIỂN KHOA HỌC & CÔNG NGHỆ:
CHUYÊN SAN KHOA HỌC TỰ NHIÊN, TẬP 2, SỐ 5, 2018
7
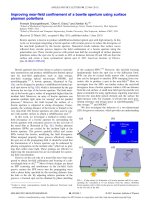
14, 21, and 22. The total area in the image was the
sum of 8 areas of 8 fluorescent regions.
Fig. 1. Result exported from the Fiji ImageJ when using
Analyzing Particles function for fluorescent images
- Column 1 was the number of fluorescent
regions. There were 22 fluorescent regions which
were numbered from 1 to 22.
- Column 2 (Area) was the area of fluorescent
regions in the column 1. Among 22 fluorescent
regions in the column 1, 14 fluorescent regions
which were numbered 3, 4, 5, 6, 8, 10, 11, 12, 15,
16, 17, 18, 19, and 20, had the areas less than 10
square pixels. These fluorescent regions were
therefore be eliminated. The real number of
fluorescent regions was 8. They were 1, 2, 7, 9, 13,
- Column 3 (IntDen) was integrated the density
of fluorescent region in the column 1. The total
integrated density in the image was the sum of 8
integrated densities of 8 fluorescent regions.
- The number of fluorescent region in a
fluorescent cell was the ratio of number of
fluorescent regions and number of fluorescent
cells.
- The total area in a fluorescent cell was the
ratio of total areas and number of fluorescent cells.
Growth of cell suspension of Nannochloropsis
oculata cultured in modified f/2 medium
The cell density increased rapidly in the first 6
days of culture. From the 6th day to the 8th day, the
cell density was steady and slightly increased
again from the 8th day to the 20th day.
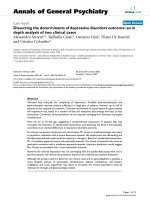
The cell diameter progressively increased during
growth. At the 8th day and the 20th day, the cells
had their widest diameter (Fig. 2).
During the growth, the percentage of small cells
increased while percentage of large cells
decreased. The cell suspension showed a highest
percentage of small cells and lowest percentage of
large cells at the 2nd day and the 12th day (Table 1).
Fig. 2. Changes of cell density (×104 cells/mL) and cell diameter (μm) of microalgae suspension cultured in modified f/2 medium.
The different alphabets above values in the same line express differences in statistical analysis according to Duncan's test (p≤0.05)
Table 1. Percentage of cell size of Nannochloropsis oculata cultured in Erlenmeyer flasks containing 20 mL modified f/2 medium.
% small cell
% medium cell
% large cell
Time of culture (days)
(≤ 2.56 µm)
(2.56–3.84 µm)
(≥ 3.84 µm)
0
25.74 ± 2.2b
10.89 ± 2.7a
63.37 ± 1.7a
1
62.38 ± 3.9c
23.76 ± 2.2b
13.86 ± 1.6b
2
85.15 ± 5.1d
11.88 ± 3.8a
2.97 ± 1.2a
c
b
4
59.41 ± 2.0
29.70 ± 4.7
10.89 ± 4.3b
6
17.82 ± 3.3a
17.82 ± 5.1a
64.36 ± 7.6c
8
17.82 ± 3.3a
9.90 ± 3.9a
72.28 ± 6.3c
10
25.74 ± 2.2b
10.89 ± 4.6a
63.37 ± 6.5c
12
80.20 ± 5.2d
11.88 ± 5.6a
7.92 ± 1.7b
a
a
20
10.89 ± 3.2
17.82 ± 4.1
71.29 ± 8.2c
The different alphabets following mean in the same column express differences in statistical analysis according to Duncan's t est (p≤0.05)
8
SCIENCE & TECHNOLOGY DEVELOPMENT JOURNAL:
NATURAL SCIENCES, VOL 2, ISSUE 5, 2018
Lipid droplets accumulation in growth phases
of N. oculata
Nannochloropsis oculata growing in modified
f/2 medium had no lipid accumulation during the
first 14 days of culture. The number of microalgae
cells increased however no fluorescence was
detected when these cells were stained with Nile
Red. At the 20th day of culture, microalgae cells
had intracellular lipid droplets since the cells
showed fluorescence after stained with Nile Red.
The number of cells in cell suspension had
fluorescence increased rapidly. Similar, the
fluorescence signal of lipid droplets in cell
suspension increased gradually from the 20th day
to the 35th and 60th day, in both total area and total
integrated density (Fig. 3, Table 2). However,
there was no change in the number of fluorescent
regions in fluorescent cells (table 2). Pluronicgrafted gelatin (PG) was created via urethane
linkage between amino groups on gelatin backbone
and NPC-remaining moiety of NPC-P-OH. In the
PG spectrum, the resonance peak at 7.23 –7.29
ppm indicated aromatic protons of phenylalanine
and other typical protons of aminoacids in gelatin
as noted in Fig. 3. Some protons of the pluronic (CH3 of PPO at 1.08 ppm and -CH2 of PEO at 3.6
ppm) also appeared in the spectrum. Moreover, a
disappearance of the aromatic proton (NPC) at
7.38–8.22 ppm confirmed the substitution of NPC
by the primary amine of gelatin to form PG
copolymer.
Table 2. Lipid accumulation in growth phases of microalgae cells cultured in Erlenmeyer containing modified f/2 medium
Time of
culture
(days)
Number
of cells
6
10
14
20
35
60
5 ± 2a
10± 3a
15 ± 5a
16 ± 4a
21 ± 2a
40 ± 0b
In cell suspension (334 251 m)
Number of
Total integrated
fluorescent
Total area (µm2)
density
cells
4 ± 2a
11 ± 2b
24 ± 8c
148.9 ± 44.7a
913.1 ± 98.4b
2698.0 ± 296.3a
139176 ± 4354a
1163923 ± 3399b
5025762 ± 4774c
In a fluorescent cell
Number of
fluorescent
Total area (µm2)
regions
1.7 ± 0.3a
1.7 ± 0.1a
2.7 ± 1.3a
34.8 ± 8.0a
82.2 ± 7.9b
106.6 ± 12.9c
The different alphabets following mean in the same column express differences in statistical analysis according to Duncan's test
(p≤0.05)
(-): no fluorescence was detected
A
B
Fig. 3. Fluorescence of the intracellular lipid droplets of Nannochloropsis oculata cultured in Erlenmeyer flasks containing
modified f/2 medium after 35 days (A) and 60 days (B). Lipid droplets were stained with Nile Red and left in dark for 15 minutes.
Pictures were taken after about 30 seconds exposure to the excitation of 460 - 480 nm wavelength and emission of 530 - 580 nm
wavelength
Effects of nitrogen on growth and lipid
accumulation of Nannochloropsis oculata cell
suspension
The cell density decreased while cell diameter
increased when microalgae cell suspensions were
cultured in modified f/2 medium without nitrogen.
The cell density greatly decreased as the treatment
time in modified f/2 medium without nitrogen
become longer. In contrast, the cell diameter
increased only after two days of culture in nonnitrogen medium. The cells in the treatment with
4-days culture in medium without nitrogen had the
widest cell diameter (Table 3).
9
TẠP CHÍ PHÁT TRIỂN KHOA HỌC & CÔNG NGHỆ:
CHUYÊN SAN KHOA HỌC TỰ NHIÊN, TẬP 2, SỐ 5, 2018
Lipid droplets were detected (by staining with
Nile Red dye) in microalgae cells which were
grown in modified f/2 medium without nitrogen in
2, 4 or 6 days of culture. Otherwise, in the control
(modified f/2 medium with nitrogen at 0.88 M),
microalgae cells showed no lipid accumulation.
The number of fluorescent cells, total area and
total integrated density of fluorescent regions in
cell suspensions increased proportionally to the
duration of the treatment. In a fluorescent cell, the
number of fluorescent regions and total area
reached the highest value when the microalgae
cells were cultured in non-nitrogen medium for 6
days (Table 4).
Table 3. Cell density and diameter of microalgae cell suspension of Nannochloropsis oculata cultured in Erlenmeyer flask
containing modified f/2 medium with (control) or without nitrogen in 2, 4, or 6 days of culture
Treatment of nitrogen
Cell diameter (µm)
Cell density (106 cells/mL)
Concentration of
nitrogen
Control
0
Time of treatment
(days)
After treatment
0
1.0 ± 0.1 a
2
2.1 ± 0.1c
4
4.0 ± 0.1f
6
5.5 ± 0.1g
2
1.7 ± 0.1b
7.3 ± 0.1b
3.5 ± 0.1b
3.5 ± 0.1b
4
2.6 ± 0.1d
7.8 ± 0.1c
4.6 ± 0.2c
3.4 ± 0.1ab
6
2.9 ± 0.1e
6.9 ± 0.1a
3.9 ± 0.1bc
3.1 ± 0.1a
10 days
After treatment
10 days
3.1 ± 0.1ab
2.5 ± 0.1a
7.4 ± 0.1b
3.6 ± 0.1b
2.8 ± 0.1 ab
3.5 ± 0.1b
The different alphabets following mean in the same column express differences in statistical analysis according to Duncan's test
(p≤0.05)
Table 4. Lipid accumulation of microalgae cells cultured in Erlenmeyer containing modified f/2 medium with (control) or without
nitrogen after 2, 4 or 6 days of culture
Treatment of nitrogen
Time
of
treatment
2
4
6
In observed field (83834 m2)
Concentration
Number
cells
Control
7± 1a
a
8± 1
Control
14± 2c
Total area
(µm2)
Total
density
-
-
-
5.3± 0.1
b
0
10± 1
Control
18 ± 1d
11±1
Number of
fluorescent
cells
a
0
0
of
b
In a fluorescent cell
7.7± 0.1
181± 41
-
b
9.3± 0.6
a
468± 34
b
c
925± 80
integrated
a
Total
area
-
-
286359 ± 17942
1.4±0.2
-
-
720297±14188
b
1206942 ± 150795
a
1.7± 0.1
c
Number of
fluorescent
regions
a
c
2.2± 0.8
23±6a
61±1b
-
b
99± 5c
The different alphabets following mean in the same column express differences in statistical analysis according to Duncan's test
(p≤0.05)
(-): no fluorescence was detected
According to Halim and Webley (2015), the
staining reaction between lipid and Nile Red dye
depended on lipid concentration, the ratio of Nile
Red dye and lipid as well as the duration of the
incubation in darkness [14]. The stronger
interaction of lipid and Nile Red dye was, the
stronger fluorescence showed. In this experiment,
we used the same concentration of Nile Red dye
and the incubation time for all samples. Therefore,
the integrated density of fluorescent region would
represent the concentration of lipid, and the area of
fluorescent region would represent the size of
intracellular lipid droplet. On the other hand, from
these data (number of fluorescent regions, area,
integrated density), the accumulation of lipids in
microalgae cells could be evaluated. The number
of fluorescent regions was the number of lipid
droplets in microalgae cell. The area of fluorescent
region was the size of lipid droplet and the
integrated density of the fluorescent region was the
concentration of lipid.
10
SCIENCE & TECHNOLOGY DEVELOPMENT JOURNAL:
NATURAL SCIENCES, VOL 2, ISSUE 5, 2018
Growth of cell suspension of Nannochloropsis
oculata had two phases of fast growth. In the first
fast growth (day 0–6th), the cell density increased
while cell diameter remained steady. In contrast, in
the second fast growth (day 8th–20th), the cell
density and the diameter increased together. The
cells got their widest diameter twice during growth
(at day 8th and day 20th of culture). The first
increase in cell diameter at day 8 occurred just
before the second fast growth phase and did not
relate to lipid accumulation. Microalgae cells at
this phase had no fluorescence when staining with
Nile Red dye. The majority of large cells was
found in this period and these cells were then
divided at the later part of the growth. These
results showed that the first growth phase was for
biomass accumulation and cell division. And the
first increase in cell diameter (day 8 th) was the
preparation for the second fast growth which lead
to the accumulation of lipids from the 20th day.
The cell diameter reached its highest value again at
the 20th day while cell density slowly increased.
Also, the accumulation of lipids started at the 20th
day of culture. At the 20th day of culture, it was
difficult to observe the fluorescence of lipid
droplets in the cells because they were too small.
The accumulation of lipid droplets increased
gradually from the 20th day to the 35th and the 60th
day, in both size and concentration. However, the
number of lipid droplets in microalgae cells did
not increase (Table 2).
Nitrogen is one of the factors that have highly
impact on the accumulation of lipid in microalgae
cells. According to Converti et al., (2009) a 75%
decrease of nitrogen in the medium stimulated
lipid accumulation in Nannochloropsis oculata
[11]. In our experiments, the treatment of
microalgae in non-nitrogen medium promoted the
lipid accumulation. Although Nannochloropsis
oculata cells grew slowly in nitrogen-depleted
medium, intracellular lipid droplets were presented
and increased in both size and concentration.
While in the control, microalgae cells divided
strongly and did not have lipid droplets at that time
(Table 4). In particular, nitrogen deficiency in 2
days could rapidly stimulate the accumulation of
lipid. The comparison between treatments (2 days
to 6 days treatments) showed that the longer time
of treatment was, the more lipid droplets were
accumulated. The number, concentration and size
of the intracellular lipid droplets were the highest
when microalgae cells were cultivated in nonnitrogen medium for 6 days.
4. CONCLUSION
Fluorescence of lipid droplet dyed with Nile
Red could be analyzed by using Fiji ImageJ
software to fast evaluate the lipid accumulation
through numbers, size and concentration of the
intracellular lipid droplets of Nannochloropsis
oculata. Microalgae cell suspension strongly grew
in the first 20 days of culture and started to
accumulate lipid droplets from the 20 th day and
increased lipid accumulation from the 35 th day to
the 60th day of culture in Erlenmeyer flasks with
20 mL of modified f/2 medium. In the lipid
accumulation phase (day 35 to day 60), the number
of lipid droplets was the same while the
concentration of lipid increased. In modified f/2
medium without nitrogen, cell density decreased
while lipid accumulation increased as soon as
nitrogen was depleted.
Acknowledgments: The authors would like to
thank to Dr. Thuong Kiet Do for his supports in
using Fiji ImageJ software to analyze fluorescent
images. This research is funded by Vietnam
National University Ho Chi Minh City under grant
number C2017-18-02 and Ministry of Education
and Training, Vietnam International Education
Development (VIED), via Project 911.
REFERENCES
[1]
A. Makri, S. Bellou, M. Birkou, K. Papatrehas, N.P.
Dolapsakis, D. Bokas, S. Papanikolaou, and G. Aggelis,
“Lipid synthesized by micro algae grown in l aboratory
and industrial scale bioreactors”, Eng. Life Sci., vol. 11,
no. 1, pp. 52–58, 2011.
[2]
W. Chen, C. Zhang, L. Song, M. Sommerfeld, and Q. Hu,
“A high throughput Nile red method for quantitative
measurement of neutral lipids in microalgae”, Journal of
Microbiological Methods, vol. 77, no. 1, pp. 41–47,
2009.
[3]
G.G. Satpati, P.C. Gorain, and R. Pal, “Efficacy of
EDTA and Phosphorous on biomass yield and total lipid
accumulation in two green microalgae with special
emphasis on neutral lipid detection by flow cytometry”,
Advances in Biology, vol. 2016, Article ID 8712470, 12
pages, 2016, doi:10.1155/2016/8712470
[4]
M.D. Abràmoff, P.J. Magalhães, and S.J. Ram, “Image
processing with ImageJ”, Biophotonics International,
vol. 11, no. 7, pp. 36–42, 2004.
[5]
J. Cheng, H. Lu, Y. Huang, K. Li, R. Huang, J. Zhou, and
K. Cen, “Enhancing growth rate and lipid yield of
Chlorella with nuclear irradiation under high salt and CO 2
stress”, Bioresource Technology, vol. 203, pp. 220–227,
2016.
TẠP CHÍ PHÁT TRIỂN KHOA HỌC & CÔNG NGHỆ:
CHUYÊN SAN KHOA HỌC TỰ NHIÊN, TẬP 2, SỐ 5, 2018
[6]
T.T.Y. Doan, and J.P. Obbard, “Improved Nile red
staining of Nannochloropsis sp”, Journal of Applied
Phycology, vol. 23, no. 5, pp. 895–901, 2011.
[7]
P. Greenspan and S.D. Fowler, “Spectrofluorometric
studies of the lipid probe, nile red”, Journal of Lipid
Research, vol. 26, no. 7, pp. 781–789, 1985.
[8]
C. Grove and D.A. Jerram, “jPOR: An ImageJ macro to
quantify total optical porosity from blue-stained thin
sections”, Computers & Geosciences, vol. 37, no. 11, pp.
1850–1859, 2011.
[9]
G.H. Huang, G. Chen, and F. Chen, “Rapid screening
method for lipid production in alga based on Nile red
fluorescence”, Biomass and Bioenergy, vol. 33, no. 10,
pp. 1386–1392, 2009.
[10] P.D. Kerrison, M.S. Stanley, M. Kelly, A. MacLeod,
K.D. Black, and A.D. Hughes, “Optimising the
settlement and hatchery culture of Saccharina latissima
(Phaeophyta) by manipulation of growth medium and
substrate surface condition”, Journal of Applied
Phycology, vol. 28, no. 2, pp. 1181–1191, 2016.
11
[11] A. Converti, A.A. Casazza, E.Y. Ortiz, P. Perego, M.D.
Borghi, “Effects of temperature and nitrogen
concentration on the growth and lipid content of
Nannochloropsis oculata and Chlorella vulgaris for
biodiesel production”, Chemical Engineering and
Processing: Process Intensification , vol. 48, no. 6, pp.
1146–1151, 2009.
[12] S.Y. Chiu, C.Y. Kao, M.T. Tsai, S.C. Ong, C.H. Chen,
and C.S. Lin, “Lipid accumulation and CO 2 utilization of
Nannochloropsis oculata in response to CO2 aeration”,
Bioresource Technology, vol. 100, pp. 833–838, 2009.
[13] R.R.L. Guillard and M.S. Sieracki, Counting cells in
cultures with the light microscope. In R.A. Andersen eds.
Algal culturing techniques. Elsevier Academic Press, pp.
239–252, 2005.
[14] R. Halim and P.A. Webley, “Nile Red staining for oil
determination in microalgal cells: A new insight through
statistical modelling”, International Journal of Chemical
Engineering, vol. 2015, Article ID 695061, 14 pages,
2015, doi:10.1155/2015/695061
Khảo sát sự tích lũy lipid ở vi tảo
Nannochloropsis oculata bằng kỹ thuật phân
tích ảnh huỳnh quang
Trịnh Cẩm Tú, Trần Thanh Hương , Bùi Trang Việt
Trường Đại học Khoa học Tự nhiên, ĐHQ G-HCM
Tác giả liên hệ:
Ngày nhận bản thảo 12 -09-2017; ngày chấp nhận đăng 20 -01-2018; ngày đăng 20-11-2018
Tóm tắt—Dịch treo tế bào vi tảo Nannochloropsis
oculata được nuôi trong môi trường f/2 cải tiến nhằm
khảo sát sự thay đổi hàm lượng lipid trong tế bào
qua các giai đoạn tăng trưởng. Sự tăng trưởng của
dịch treo tế bào được xác định thông qua việc đo mậ t
độ và kích thước tế bào dưới kính hiển vi quang học.
Thuốc nhuộm huỳnh quang Nile Red được sử dụng
để phát hiện và ước lượng hàm lượng lipid trong tế
bào vi tảo nhờ kính hiển vi huỳnh quang và phần
mềm phân tích ảnh Fiji ImageJ. Mật độ tế bào tăng
nhanh và mạnh trong 6 ngày đầu nuôi cấy trong khi
kích thước tế bào tăng tối đa ở ngày 8 và ngày 20. Sự
hiện diện của các giọt dầu trong tế bào có thể được
nhìn thấy từ ngày 20 của sự nuôi cấy. Kích thước các
giọt dầu tăng dần theo thời gian nuôi cấy và đạt cao
nhất ở ngày thứ 60. Xử lý giảm hoàn toàn nitrogen
trong môi trường nuôi cấy trong 4 ngày liên tục làm
tăng mạnh sự tích lũy giọt lipid trong tế bào. Sự tích
lũy lipid trong tế bào theo các giai đoạn tăng trưởng
của dịch treo tế bào vi tảo và dưới ảnh hưởng của sự
thiếu hụt nitrogen được thảo luận.
Từ khóa —phần mềm Fiji ImageJ, lipid, nuôi cấy
vi tảo, Nannochloropsis oculata