Determination of the p/o-Isomer product ratios in electrophilic aromatic nitration of Alkylbenzenes using high resolution 1 H NMR spectroscopy
Bạn đang xem bản rút gọn của tài liệu. Xem và tải ngay bản đầy đủ của tài liệu tại đây (215.62 KB, 9 trang )
World Journal of Chemical Education, 2019, Vol. 7, No. 3, 216-224
Available online at />Published by Science and Education Publishing
DOI:10.12691/wjce-7-3-5
Determination of the p/o-Isomer Product Ratios in
Electrophilic Aromatic Nitration of Alkylbenzenes
Using High Resolution 1H NMR Spectroscopy
Michelle K. Waddell, Charles M. Bump, Edmund M. Ndip, Godson C. Nwokogu*
Department of Chemistry and Biochemistry, Hampton University, Hampton, VA 23668, U.S.A.
*Corresponding author:
Received June 25, 2019; Revised August 10, 2019; Accepted August 25, 2019
Abstract High resolution 1H NMR spectroscopy, an increasingly available instrumental method, is used in
undergraduate organic laboratory practice as a simpler alternative to gas chromatographic method for the direct
determination of the p/o ratios of the crude reaction product from the nitration of alkylbenzenes. The choice of
isopropylbenzene as a substrate illustrates that steric effect can be significant in controlling regioselectivity in
electrophilic aromatic substitution reactions.
Keywords: laboratory instruction, organic chemistry laboratory, electrophilic aromatic substitution, nitration of
aromatic compounds, regioselectivity, quantitative 1H NMR spectroscopy
Cite This Article: Michelle K. Waddell, Charles M. Bump, Edmund M. Ndip, and Godson C. Nwokogu,
“Determination of the p/o-Isomer Product Ratios in Electrophilic Aromatic Nitration of Alkylbenzenes Using
High Resolution 1H NMR Spectroscopy.” World Journal of Chemical Education, vol. 7, no. 3 (2019): 216-224.
doi: 10.12691/wjce-7-3-5.
1. Introduction
Nitration of alkylbenzenes is a reaction used to
illustrate the concepts of regioselectivity, directing effects
and steric effects of substituents in electrophilic aromatic
substitutions (EAS). The earlier method used for the
quantitative determination of the regioselectivity of this
reaction in laboratory exercises [1,2] and class room
demonstrations [3] is the gas chromatographic (gc)
analysis of the product mixture. A newer method that has
been reported for determining mole ratios of binary
mixtures of conformers [4], tautomers [5], stereoisomers
[6,7,8,9] and regioisomers [6,7,10,11,12,13] is high
resolution 1H NMR spectroscopy. This method is faster,
simpler to use, more direct and accurate for the
determination of the mole ratio of mixtures than the gas
chromatographic method. The most relevant reported
examples of this application of quantitative NMR
spectroscopy, however, analyzed regio-isomeric ratios of
pre-purified solid EAS reaction products. Purification
steps such as recrystallization [10] or trituration [12],
however, alter the actual product ratios because of
different solubilities in the solvent used. We report here
the use of high resolution 1H NMR spectroscopy to
determine the actual o/p reaction products ratios in EAS
reactions from which only the reaction solvent has been
removed by evaporation.
High resolution/field instruments are necessary for
adequate separation of proton signals of components of
mixtures and for accurate signal integration. The infusion
of modern instrumentation into the undergraduate
curriculum by funding agencies in many countries [14]
has resulted in the increasing availability of high
resolution NMR spectrometers for undergraduate
education. Optional autosamplers, automation for running
multiple samples, and user-friendly software for
spectrometer control and data processing that can be
purchased with modern spectrometers make it possible for
large undergraduate classes to acquire hands-on skills and
experimental data on these instruments.
The example reported here is a laboratory activity that
illustrates the determination of the actual regioselectivity
of EAS reactions with the following advantages:
(a) The ratio of isomers generated by the reaction is
determined directly from the crude after reaction solvent
removal without any further purification. Purification
steps such as recrystallization, trituration and distillation
alter the actual ratio of the reaction product mixture.
(b) The use of isopropylbenzene best illustrates the
significance of steric effect on the regioselectivity of EAS
reactions in the presence of both statistical and electronic
factors.
(c) The relevant aromatic 1H NMR signals for
determining mole ratio of products are quite removed
from the signals of impurities and unreacted alkylbenzene
substrate. This allows for accurate results without
purification of the crude even for reactions with low
conversion.
(d) This method can be successfully used to determine
the p-/o- mole ratio of the crude product mixture from
World Journal of Chemical Education
nitration of aromatic compounds even when the products
are liquids which are more difficult to purify.
The nitration of an alkylbenzene laboratory activity is
preceded by a pre-nitration activity – a discovery-based
activity on the use of 1H NMR spectroscopy to determine
the mole ratio of compounds of known structures and
molar masses in mixtures. This 1H NMR activity
acquainted students with matching 1H signals to structures
in a mixture, sample preparation, data acquisition
procedures and 1H NMR spectral processing with the
spectrometer software. Students discover from this
activity that under certain conditions, the mole ratios of
components of a mixture can be determined using
integrals of appropriate signals of the components.
In the second lab period, each laboratory team of three
students carries out the mixed acid nitration of
isopropylbenzene, the sample preparation and acquisition
of proton NMR spectrum of the team’s crude product
mixture. Each group processes the spectrum of their
product on their own time according to instructor
demonstrated instructions and calculates the mole ratio of
p-isopropylnitrobenzene to o-isopropylnitrobenzene of
their crude product for writing their individual lab reports.
These laboratory activities have been performed by
students during two spring and two summer semesters of
second semester organic chemistry laboratory courses.
The results and answers to post-lab questions in student
lab reports indicate that these activities enhanced student
skill in instrumental analysis of experimental results and
understanding of the factors that control regioselectivity in
EAS reactions.
217
posted on a common lab section table drawn by the
instructor on a board. Comparing the ratios from
calculations based on integrals of signals of components
with the ones calculated from masses and molar masses of
components of the different mixtures leads students to
discover that the ratio of integrals is equal to the mole
ratio of components of a mixture only when the integrals
correspond to equal number of protons in the structure
of each component! Both the spectral data acquisition
for the known binary ester mixture and the processing
demonstrations, as described in SI, are completed in one
3h laboratory period. These skills are then applied by
students in the data acquisition and independent analysis
of the products of the EAS reaction to calculate the o/p
product ratio.
2. Experimental Section
2.1. Pre-Nitration Activity: Determination of
the Mole Ratio of Components of a
Binary Mixture by 1H NMR Spectroscopy
This pre-nitration activity is an discovery-based
exercise which acquaints students with the use of 1H NMR
spectroscopy for the calculation of the mole ratio of
components of a binary mixture. First, students are
provided with processed 1H NMR spectra of pure ethyl
ethanoate (EE), pure methyl propanoate (MP) and a
mixture of the two compounds or instructor-selected
substitutes. These spectra are used to illustrate how proton
signals are matched to structures and how this information
can be used to assign signals in a mixture to the
components. Student groups are then provided samples
with known but different masses of ethyl ethanoate and
methyl propanoate or any substitutes the instructor
chooses, i.e. each lab team in the laboratory section is
assigned a quantitatively different mixture of the two
compounds EE and MP. Each team prepares an NMR
sample of their mixture and all samples are set up for
automatic acquisition, processing and printing of the 1H
NMR spectra. [15] After obtaining the processed and
printed copy of the integrated 1H NMR spectrum of their
mixture (Figure 1) each team is required to calculate ratios
of integrals of specified signals of components (see SI for
description of the calculations) as well as mole ratio of
their mixture. The results of these calculations are all
Figure 1. 1H NMR spectrum of a 3:1 mixture of ethyl ethanoate (EE)
and methyl propanoate (MP) respectively
2.2. Nitration of Isopropylbenzene and
Acquisition of 1H NMR Spectrum
of the Crude Product Mixture
When compared with some modern methods [16,17,18]
for generating the nitronium ion, the old mixed acid
method [19,20,21] is still the simplest one. The procedure
involves dropwise addition of 1 mL of conc. sulfuric acid
into 1 mL of concentrated nitric acid with stirring and
cooling in an ice bath. This acid mixture is then added, in
small portions, with stirring using a glass rod or magnetic
stirrer if available, to 1 mL of isopropylbenzene dissolved
in 5 mL of methylene chloride (CH2Cl2). After the
addition, the reaction mixture is stirred vigorously for 1 h.
Then 10 mL of fresh CH2Cl2 is added to the reaction
mixture and the organic layer is washed successively with
saturated NaHCO3(aq) and distilled water. After drying
over anhydrous Na2SO4, the methylene chloride can be
removed by using the rotary evaporator, if available or by
simple distillation. Reducing the amount of solvent in the
product mixture enhances the signals of the products and
does not alter the ratio of regioisomers produced.
1
H NMR spectrum of the product for each group is
prepared in deuterated chloroform (CDCl3). All samples
for a lab section are set up on an autosampler and run in
automation mode. The acquired NMR data can be made
218
World Journal of Chemical Education
available to students by three methods: access to a storage
computer, e-mailing the data to students and/or posting the
data on an instructional platform such as BlackBoardTM.
determining the integral values for the relevant signals and
calculating the mole ratio using aromatic signals may be
illustrated to students using the 1H NMR spectrum of the
mixture of p- and o-chloronitrobenzenes.
3. Hazards
4.1. 1H NMR Analysis of the Nitration
Product Mixture
Gloves should be worn for handling concentrated nitric
and sulfuric acids, aromatic and all compounds used in the
activities. CH2Cl2 and CDCl3 are eye and skin irritants.
They are also very volatile and should be handled in a
fume hood. Methyl propanoate causes skin irritation and
ethyl ethanoate causes eye irritation. Nitrobenzenes are
toxic substances that should be handled with protective wear.
4. Results and Discussion
A mixture of known mole ratio prepared from pure
samples of ortho- and para-chloronitrobenzenes is used
by the instructors to verify that the operating parameters
of the 400 MHz spectrometer used in product analysis will
ensure close numeric equality between ratio of signal
integrals and mole ratio of components of a mixture of
aromatic compounds, i.e. that the ratios obtained from
integrals is similar to the mole ratio calculated from the
masses of components. The 1H NMR spectrum of the
mixture of pure samples of o- and p-chloronitrobenzene
and the 1H NMR spectra of each pure component are used
also to identify that the signals of the protons adjacent to
the nitro-group in the p- and o-substituted nitrobenzenes
can be adequate basis for the determination of the mole
ratio of the regio-isomeric products from the nitration of
alkylbenzenes (Figure 2).
Student processing instruction for the determination of
mole ratio of para/ortho nitration products was illustrated
with the 1H NMR spectrum of a sample nitration
product mixture (Figure 3). Spectral processing should
include horizontal and vertical expansions of the region
(7.6 - 8.2 ppm) of the spectrum that contains the relevant
aromatic proton signals for the para and ortho product
components, as well as the different methods for
measuring the integrals. For the p-nitrocumene, the two
protons adjacent to the nitro-group appear as two triplets
centered at 8.15 ppm while the one proton adjacent to the
nitro-group in o-nitrocumene shows as two doublets
centered at 7.76 ppm. Automatic and/or manual integration
methods can be used to determine the integral of the
relevant signals. The numerical integral value can be read
off from the processed spectrum or by using the vertical
measure cursor of the processing software if the relevant
signal is co-integrated with another signal. Alternatively,
the spectrum can be plotted and a ruler can be used to
measure the vertical height of integrals for the specific
signals. Vertical expansion of signal intensity (abundance)
is usually necessary for the signals and integrals for the
para- and ortho-products to be visible when reaction
conversion is low. With a well shimmed spectrometer,
significant expansions of signal intensity of more than 100
times can be achieved without degrading the spectral
baseline. A clean and horizontal baseline is necessary for
accurate integral read-out.
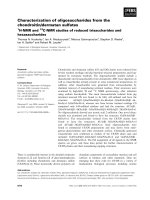
Figure 2. Structures of p-Nitrocumene and o-Nitrocumene showing the
chemical shifts of the protons used to calculate mole ratio of the their
mixture in crude product
The suitability of 1H NMR spectroscopy for determining
the mole ratio of p/o-nitration products of alkylbenzenes at
400 MHz is also based on the fact that the aromatic
protons adjacent to the nitro-group of the p-product (Hp)
and the o-product (Ho) (Figure 2) are both well separated
from each other and quite distant from the other signals in
the crude product mixture at this operating frequency.
That this method will work for analysis of the nitration
product of most monosubstituted benzenes is illustrated by
the observations that the frequency separation between the
Ho and Hp signals of o-nitrotoluene and p-nitrotoluene
respectively is 6 Hz at 60 MHz [22] but for the
isopropylnitrobenzene analogs, the separation is 170 Hz at
400 MHz. [23] For o- and p-chloronitrobenzenes, the
corresponding o- and p-proton signals are overlapped at
60 MHz [22] but separated by 145 Hz at 400 MHz [23].
Introductory instructions for processing the spectrum and
Figure 3. Sample 1H NMR Spectrum of a Nitration Product Mixture
Obtained on a 400 MHz Spectrometer
Armed with the information presented above, students
are generally able to process their spectra at their own
time and use the integrals for the designated signals and
the number of protons to determine the p/o ratio of their
nitration product mixture using the formula:
World Journal of Chemical Education
Mole Ratio = δ I p / 2δ I o
where δIp is the integral or integral measure for the two
protons adjacent to the nitro-substituent of the p-product
and δIo is the integral or integral measure for the one
proton adjacent to the nitro-substituent of the o-product.
4.2. Statistical Analysis of Students
Calculated Mole Ratios
The analysis presented here is based on results obtained
by 100 students organized in 33 lab teams in six
laboratory sections during the spring and summer of the
same year. In each section, students worked in teams of
three. Out of the 33 working teams in all the laboratory
sections, no nitration product was detected in the 1H NMR
spectra for six teams. One probable reason for the failed
reactions could be inadequate mixing of the organic and
aqueous layers. The spectrum of one of the teams showed
only the para-product, one group obtained a p/o ratio of
3.15:1, another 4.16:1, and another 4.5:1 which are much
higher than majority of the other results. Twenty three of
the product mixtures obtained p/o ratios that were in the
range of 2.50:1 to 3.06:1. The average ratio for all samples,
excluding the products with ratios of 3.15: 1 and above,
was 2.74 ± 0.14. [24] The average of all student reported
ratios was 2.88 ± 0.45. Fulkrod [1] reported a value of
2.63 for this ratio by gc. The results with ratios above
3.1:1 as well as the one with only para-product might be
due to unwitting changes in the procedure such as the
amounts of the concentrated acids and temperature of the
reaction. The mass ratio of the acids as well as the
temperature of the reaction have been reported to lead to
product composition varying from a mixture of the o-, mand p-isomers to only the para-isomer. [20]
Statement of Competing Interests
The authors have no competing interests
Supporting Information
List of chemicals, student instructions for each activity,
lab report questions, lab report guidelines, instructor notes
and a table of student reported p- and o- integral values
and ratios calculated from them are available.
References
[1]
[2]
[3]
[4]
[5]
[6]
[7]
[8]
5. Conclusion
Students in second semester organic chemistry laboratory
course used a simple method – high resolution 1H NMR
spectroscopy - to determine directly from the crude, the
actual mole ratio of regio-isomeric products from the
electrophilic aromatic nitration reaction of alkylbenzenes
after removing the reaction solvent only. For the nitration
of isopropylbenzene, p/o ratio varied from 2.50 to 3.06,
with the average ratio being 2.74 ± 0.14. Based on the greater
than 2 values for the p/o ratio obtained by the lab teams,
students were able to conclude in their report of this activity,
that steric effect was much stronger than statistical and
electronic factors in controlling the regioselectivity of the
nitration of isopropylbenzene. The activities acquainted
students with the use of proton NMR spectroscopy for the
simple and direct quantitative analyses of any mixture of
known components and applied that knowledge to the
analysis of crude product mixtures of EAS reactions.
Acknowledgements
Support from the United States National Science
Foundation for the acquisition of a 400 MHz NMR
spectrometer (Grant # CHE-0722510) is acknowledged.
219
[9]
[10]
[11]
[12]
[13]
[14]
[15]
Fulkrod, J. E. A Laboratory Study of Steric and Inductive Effects.
J. Chem. Educ. 1974, 51(2), 115.
Jarret, R. M., New, J. and Patraitis, C. Electrophilic
Aromatic Substitution Discovery Lab. J. Chem. Educ. 1995, 72(5),
457-459.
Davis, M.; Deady, L.W.; Paproth, T.G. The Nitration of
Alkylbenzenes: A Lecture Demonstration. J. Chem. Educ. 1978,
55(1), 34.
Kutateladze, A. G., and Hornback, J. M. Determination of the
Position of the Conformational Equilibrium of a Trans 1,2Disubstituted Cyclohexane by NMR Spectroscopy: An
Experiment in Physical Organic Chemistry for Undergraduate
Students. J. Chem. Educ. 2001, 78(1), 81-82.
Drexler, E. J., and Field, K. W. An NMR Study of Keto-Enol
Tautomerism in β-Dicarbonyl Compounds. J. Chem. Educ. 1976,
53(6), 392-393.
Markovic, R., Baranac, M., Jovanovic, V., and Dzabaski, Z.
Regioselective Synthesis of a Stereodefined Heterocyclic PushPull Alkene: 1H NMR Studies and Two-Dimensional TLC
Illustrating Z/E Isomerization. J. Chem. Educ. 2004, 81(7), 10261029.
Friesen, J. B., and Schretzman, R. Dehydration of 2-Methyl-1cyclohexanol: New Findings from a Popular Undergraduate
Laboratory Experiment. J. Chem. Educ. 2011, 88, 114-1147.
Saba, S., Clarke, D. D., Iwanoski, C., and Lobasso, T. Using NMR
to Probe the Regio- and Stereochemistry of the Hydration of
1-Hexene. J. Chem. Educ. 2010, 87(11), 1238-1241.
Centco, R. S., and Mohan, R. S. The Discovery-Oriented
Approach to Organic Chemistry. 4. Epoxidation of p-Methoxytrans-β-methylstyrene: An Exercise in NMR and IR Spectroscopy
for Sophomore Organic Laboratories. J. Chem. Educ. 2001, 78(1),
77-79.
Treadwell, E. M., Lin, T-Y. A More Challenging Interpretative
Nitration Experiment Employing Substituted Benzoic Acids and
Acetanilides. J. Chem. Educ. 2008, 85(11), 1541-1543.
Sen, S. E., and Anliker, K. S. 1H NMR Analysis of R/S Ibuprofen
by the Formation of Diastereomeric Pairs. J. Chem. Educ. 1996,
73(6), 569-572.
McElveen, S. R., Gavardinas, K., Stamberger, J. A., and Mohan, R.
S. The Discovery-Oriented Approach to Organic Chemistry. 1.
Nitration of Unknown Organic Compounds: An Exercise in 1H
NMR and 13NMR Spectroscopy for Sophomore Organic
Laboratories. J. Chem. Educ. 1999, 75(4), 535-536.
Clark, M. A., Duns, G., Golberg, D., Karwowska, A.,
Turgeon, A., and Turley, J. NMR Analysis of Product Mixtures in
Electrophilic Aromatic Substitution. J. Chem. Educ. 1990,
67(9), 802.
The chemistry division of the US National Science Foundation
(NSF), through its Major Research Instrumentation (MRI)
program, funded 82 high resolution NMR spectrometers (67 were
400/500 MHz, 15 were 300 MHz) for undergraduate institutions
from 1997 to 2012.
NMR experiments were run on a JEOL ECS 400 MHz
spectrometer equipped with a 24-slot auto-sampler using
Delta software. Even though the three students in a team
obtained the same data, each student submitted an independent
report. Working in teams promoted collaborative learning
and writing individual reports provided training in writing.
220
World Journal of Chemical Education
[16] Matthew, S. M., Biradar, A. V., Umbarkar, S. B., and Dongare, M.
[20] Durst, D. H. and Gorkel, G. W. Experimental Organic Chemistry,
2nd Ed., McGraw-Hill, New York, pages 492-xx, 1987.
K. Regioselective Nitration of Cumene to 4-Nitrocumene Using
Nitric Acid Over Solid Catalyst. Catalysis Commun., 2006, 7(6),
394-398.
[17] Aridoss, G., Laali, K. K. Ethylammonium Nitrate (EAN)/Tf2O and
EAN/TFAA: Ionc Liquids Based Systems for Aromatic Nitration.
J. Org. Chem., 2011, 76(19), 8088-8094.
[18] Augusto, J., Rodrigues, R., Filho, A. P. D., and Moran, P. J. S.
Regioselectivity of Mononitration of Alkylbenzenes by Immobilized
Acyl Nitrates. Synth. Commun., 1999, 29(12), 2169-2174.
[19] Knowles, J. H., and Norman, R. O. C. The Transmission of Polar
Effects Through Aromatic Systems. Part II. The Nitration of
Benzyl Derivatives. J. Chem. Soc., 1961, 2938-2947.
[21] Haun, J. W., and Kobe, K. A. Mononitration of Cumene. Ind. And
Eng. Chem., 1951, 43(10), 2355-2362.
[22] Pouchert, C. J. The Aldrich Library of NMR Spectra, Edition II,
Vol. I; pages 1131c, 1133b, 1140a, 1143b; Aldrich Chemical
Company, Inc., Milwaukee, Wisconsin, 1983.
[23] The reported frequency separations were obtained using our 400
MHz spectrometer on pure samples of the compounds purchased
from Aldrich Chemical Company.
[24] A table of measurements of integrals and the calculated ratio from
each lab team is provided in Supplemental Information. The
reported statistical analysis was based on these results.
Supplemental Information
1. Chemicals Used and Their CAS Numbers:
Compound Name
CAS Registry Number
Ethyl ethanoate (ethyl acetate)
141-78-6
Methyl propanoate (methyl propionate)
554-12-1
Isopropylbenzene (cumene)
98-82-8
p-Isopropylnitrobenzene (p-nitrocumene)
1817-47-6
o-isopropylnitrobenzene (o-nitrocumene)
6526-72-3
p-Chloronitrobenzene
100-00-5
o-Chloronitrobenzene
88-73-3
Methylene chloride (Dichloromethane)
75-09-2
Deuterated Chloroform
865-49-6
Tetramethylsilane
75-76-3
conc. Sulfuric acid
7664-93-9
conc. Nitric acid
7697-37-2
Sodium Carbonate
497-19-8
Sodium Sulfate
7757-82-6
2. Instructor Notes
2.1. Pre-Nitration Activity: Discovery-based Activity on 1H NMR Spectroscopy
i. Our activities were carried out on a JEOL ECS 400 MHz NMR spectrometer with a 24-slot autosampler. The
control and processing software is Delta v 4.3.6. The software license allows students to install the processing-only
software on their personal computers without cost. Processing and automation routines, buttons, and cursors will
differ depending on the available spectrometer model but modern spectrometers have identical software
capabilities.
ii. Any two compounds can be selected as components for the preparation of the mixtures for the pre-nitration 1H
NMR activity, provided that the chemical shift for at least one 1H signal for each component is known and
separated enough from other signals for separate integration.
iii. For volatile components such as ethyl ethanoate, the mixtures should be stored in snap-cap vials at room
temperature. Under these conditions, we found that there is not enough evaporation to alter the initial mole ratio
even after a year. In screw-cap vials, ethyl ethanoate can suffer enough evaporation in hours to alter the ratio.
Choice of less volatile components will avoid this problem.
iv. It may be necessary to verify that signal separation for the o- and p-products would be adequate for this laboratory
activity on spectrometers operating at frequencies lower than 400MHz.
v. The 1H NMR spectra of a known mixture of ethyl ethanoate and methyl propanoate and each pure component or
substitutes should be obtained and stored on a computer that students have access to. These sample 1H NMR
spectra are then used in the first lab period by instructors to teach and demonstrate the procedures for processing
and matching signals to protons in the structures and calculation of integral ratios from the processed NMR
spectrum of the mixtures.
World Journal of Chemical Education
221
iv. Groups should enter their results of the required calculations for their mixture on the same class table. Each student
should copy this table for later analysis of all the data to identify the condition when integral ratio is equal to mole
ratio for each mixture on the class table.
2.2. Nitration of Alkylbenzenes
i. An alkylbenzene can be assigned for this exercise to all lab sections. Different lab sections or even different teams
in a section can also be assigned different alkylbenzenes. The more the number of alkyl substituents on the
benzylic carbon, the faster the nitration reaction. The reaction time should therefore be longest for nitration of
toluene and shortest for t-butylbenzene. We have successfully used toluene, ethyl and isopropylbenzenes over a
number of second-semester organic chemistry lab courses. Various alkybenzenes are available from Aldrich
Chemical Company. Ratio of p/o will differ based on the alkylbenzene used.
ii. The mechanisms for generation of the nitronium ion from the mixed acids and the attack of the nitronium ion on
the specific alkylbenzene used can be reviewed to illustrate the mechanisms with a specific example even if these
mechanisms may have been presented in lecture class. These mechanisms are found in every undergraduate
organic chemistry text book.
iii. In order to avoid the development of a lot of heat and splashing of acid, conc. sulfuric acid must be added to the
conc. nitric acid and not the other way round. Other methods for generating the nitronium ion can also be used,
with the understanding that product isomer ratios will depend also on the method for generating the nitronium ion.
iv. If magnetic stirring is not available, the reaction mixture can be vigorously stirred with a glass rod or by swirling
the reaction flask. These alternatives are however, less effective for creating contact between reactants in the
aqueous and organic solvent layers
2.3. Processing of the 1H NMR of the Crude Nitration Product
i. Demonstration of the determination of mole ratio of para/ortho products is necessary for students to learn how to
accurately and independently process the spectrum of their nitration products. The 1H NMR data of the mixture of
known composition prepared from pure p- and o- chloronitrobenzenes is adequate for demonstrating the procedure.
The demonstration should stress (a) identification of the region where the signals of interest lie in the complete spectrum
(b) software features used to perform horizontal and vertical expansions of the 7.6 - 8.2 ppm region of the spectrum
that contains the relevant signals for para and ortho protons, and (c) how to create the vertical measures of integrals.
ii. For the p-isopropylnitrobenzene (cumene), the signals for the two protons adjacent to the nitro-group are centered
at 8.15 ppm with each split into three unsymmetrical peaks. The one proton adjacent to the nitro-group in onitrocumene shows as two signals centered at 7.76 ppm. In the spectrum of the crude product mixture, there are
adjacent minor signals centered at 8.097, 8.057 and 8.035 ppm that get automatically co-integrated with the signals
of interest. The integration values are therefore higher than what it actually is for the signals of interest. However,
the usually identifiable inflection in the combined integral of signals that are separate but close, makes it possible
to use vertical measure or a ruler to obtain the numerical height of the integrals of the signals of interest.
iii. Vertical expansion of signal intensity (abundance) is necessary for reactions that produce low yield of product in
order for the signals for the para- and ortho-products to be visible. With a well-shimmed spectrometer and NMR
sample tubes rated for the operating frequency of the spectrometer, significant expansion of signal intensity of
more than 100 times can be achieved without degrading the spectral baseline.
iv. The acquired spectral data for all nitration samples can be made accessible to students by any or all of the
following avenues, if available: (a) a storage computer that students have access to; (b) e-mailing data files to
students or (c) upload to campus-wide instructional platform such as BlackBoard. Students should then access their
spectra for processing at their convenience.
v. Both the basic demonstrations and exercises on signal matching and quantitative application of 1H NMR
experiment can be accomplished in one laboratory period (2h 50m). The nitration reaction and isolation of the
crude product mixture can be completed in 1h 30 min. This is followed by preparation of NMR samples, and the
set up for automated 1H NMR spectral data acquisition for the crude product mixture of the nitration reaction. The
instructor makes all acquired spectral data available to students through the three methods already listed. Students
are instructed to download their spectral data and process them according to instructions when they write their lab
reports for the activity.
vi. The emphasis on the nitration experiment is the determination of the mole ratio of the isomeric product mixture
from the crude, not the percent yield or percent conversion of the reaction.
3. Student Handout: Experimental Procedures
3.1. Hazards and Safety Information
Students should always wear goggles when carrying out experiments in the lab. For safe handling of concentrated
nitric and sulfuric acids as well as the alkybenzenes and their nitration products, gloves must be worn. This reaction must
222
World Journal of Chemical Education
be carried out in a fume hood because vigorous stirring and the exothermic nature of the reaction lead to appreciable
evaporation of the CH2Cl2 solvent. The ester mixtures should also be handled in a fume hood and with gloves.
CAUTION: Wear gloves when pouring and measuring concentrated nitric and sulfuric acids! Reaction must be
carried out in a hood.
3.2. Pre-Nitration Activity: Can 1H NMR Spectroscopy be Used for Quantitative Analysis of a
Mixture of Organic Compounds?
One of the pieces of quantitative data from1H NMR spectrum of a pure compound is the integral value of each signal
that provides the ratio of the number of protons responsible for each signal. If a sample is a mixture of two or more
compounds, can the integrated 1H NMR of such a mixture provide any quantitative information about the composition of
the mixture? In this exercise, you will investigate whether a quantitative information about a binary mixture can be
deduced from the integrated 1H NMR of the mixture and if so, what are the necessary conditions for such quantitative
deduction to hold true.
For accuracy in determination of the integral values of signals, the spectra of the components of the mixture must meet
certain basic requirements: (a) the chemical shift of at least one set of protons of each component must be known. This
information can be obtained either by looking up the spectra of the compounds in the chemical literature or by running
the 1H NMR sample of each compound; (b) the signals to be used for comparison must be separated from other signals of
the same as well as those of the other compound in the mixture so that integrals can be adequately determined; (c) the
baseline for the signal of interest in each component must be clean and horizontal. When these conditions are met,
integrals are most accurate and values calculated from them are most dependable and reproducible.
In the first part of this activity, you will learn to match signals in the 1H NMR spectrum of a mixture to protons in the
structure of each component compound using the 1H NMR spectrum of the pure components. The compounds ethyl
ethanoate and methyl propanoate and their mixture are adequate for this purpose but your instructor may choose other
compounds that may be available in your stockroom. The structures of the two compounds that are used in this write-up
are given below. Each compound has a signal that is a singlet, one that is a triplet and one that is a quartet. Labeling of the
different proton sets in each structure (a, b, and c) are based on similarity of chemical/magnetic environment. (Figure S1)
The spectra of the two compounds and their mixture will be provided. Using a combination of structural effects on
chemical shift, multiplicity and integrals of signals in both spectra of methyl propanoate and ethyl ethanoate, assign and
label the corresponding signals for a, b, and c proton sets according to the labeling in the structures above on the spectra
of pure ethyl ethanoate and methyl propanoate. Then use the assignments in the spectra of the pure compounds to assign
the signal for each proton set – a, b, and c for each compound in the mixture, using the subscript EE and MP respectively
to differentiate the signals for ethyl ethanoate from those of methyl propanoate, e.g. aEE, cMP etc.
Do the spectra of the two compounds satisfy the three conditions given above for accurate integration?
Write your name on each spectrum and submit your three signals-labeled NMR spectra and your answer to the
question asked above to your instructor before you choose a sample for part 2 of this activity.
In the second part of this lab activity, each group will be assigned a mixture of ethyl ethanoate and methyl propanoate
of given mass composition. Each group will prepare an NMR sample of the assigned mixture. 1H NMR spectra of
samples will be collected in automation mode, processed, integrated and the printed spectrum will be provided to your
group. Using the given masses of components of the mixture and the processed 1H NMR spectrum, each group will carry
out the following calculations and enter their results on the class table prepared by the instructor so that everybody will
have data from all groups.
1. Calculate the mole ratio of your mixture from the masses of components provided
2. Calculate the following ratios of integrals for MP: EE using
a. The integral for the singlet CH3 signal for each component of the mixture
b. The integral for the quartet –CH2—signal for each component of the mixture
c. The integral for one hydrogen atom for each compound of the mixture. You may calculate the integral for one
H-atom by dividing the integral of a signal with the number of hydrogen atoms responsible for that signal in
that compound.
d. The integral for a CH3 signal in one compound and a CH2 signal in the other?
World Journal of Chemical Education
223
Enter the five ratios (1, 2a,b,c and d) calculated for your mixture on the class table on the board and copy the complete
table for the whole class in your lab notebook.
Based on your analyses of the data in the table for each group including yours, answer the following questions in your
lab report:
i. What is common to all the ratios calculated in 2 a, b and c for each group?
ii. What is common to all the ratios calculated in 1, 2a, b, and c for each group?
iii. How do the ratios calculated in 1, 2a, b, and c compare to the one calculated using the integral for a CH3 in one
compound and the integral for a CH2 in another, i.e. 2d for each group?
iv. Is there any numerical relationship between some integral ratios and mole ratio for each mixture on the data
table? If yes, describe it.
3. From the observations above, provide a yes or no answer to the question that is the topic of this lab activity. If your
answer is yes, state the quantitative relationship between the ratio of integrals for signals and the mole ratio of
components of a mixture. State the numerical condition that must apply for this trend to hold true for a mixture.
In your lab report for this activity, you must specify the identity of the mixture your group was assigned, including the
mass composition.
Show the details of each of the five calculations for 1, 2a, b, c and d.
Provide answer to questions i - iv about the data table and your conclusive statement, i.e. item #3.
Include the class data table and the processed spectrum of your mixture with signals labeled as in the three labeled
spectra you submitted to the instructor after the first part of the lab activity. Your spectrum must show assignments for
each signal from each compound of the mixture using the a,b,c, and the EE/MP labels as in Figure S1.
3.3. Mixed Acid Nitration of Isopropylbenzene (Cumene) or Any Alkylbenzene:
3.3.1. Introduction:
Nitration of isopropylbenzene is a typical electrophilic aromatic substitution reaction that can yield three possible
regio-isomeric products as shown in Eq. 1. The major product isomers for this substrate will be the p- and o-products
since the isoprpyl group is an activating group and therefore, an ortho- and para-directing substituent. The mechanism for
formation of the nitronium ion from the concentrated nitric and sulfuric acid mixture and the two-step mechanism of
attack of the nitronium ion on the aromatic ring can be found in your undergraduate organic chemistry textbook.
CH2Cl2
NO2
+ Conc. H2SO4 + Conc. HNO3
+
+
Eq. 1
NO2
NO2
3.3.2. Experimental Procedure:
i. Measure into a 125 mL Erlenmeyer flask, 1 mL of conc. nitric acid. Cool in ice/water bath.
ii. To this acid, add in small portions, with stirring, 1 mL of conc. sulfuric acid.
iii. In another 125 mL Erlenmeyer flask, add 1 mL of isopropylbenzene, followed by the addition of 5 mL of
methylene chloride (CH2Cl2).
iv. While stirring the organic solution with a magnetic bar on a magnetic stirrer, add, in small portions, the acid
mixture.
v. After completing the addition, stir the mixture vigorously for 1 h. Vigorous stirring is necessary to establish large
surface contact area between the aqueous and organic layers for the reaction period. Methylene chloride
evaporates because of the heat generated in the reaction as well as the vigorous stirring. It is necessary to add
additional portions of 5 mL of methylene chloride to maintain at least 10 mL of organic layer at the end of the
reaction.
vi. At the end of the reaction period, transfer the reaction mixture into a separatory funnel. Rinse the reaction flask
with 5 mL of methylene chloride and pour the rinse into the separatory funnel.
vii. Separate the aqueous acid layer into a beaker for later adequate disposal.
viii. Rinse the organic layer twice, each time with 5 mL of saturated aqueous sodium bicarbonate solution, followed by
two washings each with 5 mL of distilled water.
ix. Dry the resulting organic solution over 2g of anhydrous Na2SO4 and decant into a clean, dry round bottom flask
for solvent removal by rotary evaporation or simple distillation.
x. Using a pipette, add one drop of the liquid product into an NMR sample tube followed by the addition of no more
than 1 mL of CDCl3 with .03% tetramethylsilane (TMS) as internal reference. If the yield is low, the 1 mL of
CDCl3 should be added to the flask containing the product and this solution is then transferred into the NMR
sample tube using a pipette.
224
World Journal of Chemical Education
The acid solution from the reaction should be disposed of either by diluting with water and pouring down the drain or
neutralizing with sodium carbonate/bicarbonate, then dissolving/diluting with water and pouring down the drain. The
remainder of the product should be handed over to the instructor.
3.3.3. Calculation of p/o Isomer Mole Ratio from 1H NMR of the Nitration Product Mixture:
Reference and phase the spectrum. Expand horizontally and vertically the 7 – 9 ppm region. The signals centered at 7.7
ppm are for the one proton (Ho) of o-nitrocumene. The signals centered at 8.15 ppm are due to the two protons (Hp) of pnitrocumene (Figure S2). For low yield products, it is necessary to use the vertical expansion cursor to render both the
relevant para and ortho-product peaks high enough for visibility. After integrating the signals, use the vertical measure
cursor to determine the height of the integral for the specific signals of interest. These vertical measures, which are
proportional to their integrals, are used to calculate mole ratio of p- to o- product.
Statistically, the p/o ratio should be 1:2 since there is one para position and two ortho sites for substitution.
Also, electronic factors should favor ortho over para product since the isopropyl substituent stabilizes the carbocation
of the ortho σ-complex much better than the carbocation of the para σ-complex. Your actual experimental mole ratio
should be determined from the proton NMR signal integration using the following equation:
p/o Mole ratio = δΙp/2δΙo
where
δIp = integration or vertical measure units for 2 para-Hp;
δIo = integration or vertical measure units for 1 ortho-Ho;
3.3.4. Lab Report for Lab Period #2:
This report should contain the following items: Title of the experiment, equation of the reaction, table of reagents
showing structure, name, amount, molecular weight, and number of moles for pure substances, procedure for the nitration
reaction including preparation of NMR sample and the calculation of the mole ratio of p- to – o-isopropylnitrobenzenes.
Is your calculated mole ratio in accord with your prediction based on statistical and electronic factors? If not, suggest an
explanation for the difference. Attach an annotated copy of the part of the processed 1H NMR spectrum used to calculate
the products mole ratio.
© The Author(s) 2019. This article is an open access article distributed under the terms and conditions of the Creative Commons
Attribution (CC BY) license ( />