Comparison of the adsorption of Zn(II) on a- and g-MnO2 nanostructures
Bạn đang xem bản rút gọn của tài liệu. Xem và tải ngay bản đầy đủ của tài liệu tại đây (1.83 MB, 6 trang )
Physical Sciences | Chemistry
Comparison of the adsorption of Zn(II)
on a- and g-MnO2 nanostructures
Van Phuc Dinh1*, Ngoc Chung Le2, Ngoc Tuan Nguyen3, Thien Hoang Ho1, Van Dong Nguyen4
Dong Nai University
2
Dalat University
3
Vietnam Atomic Energy Institute
4
University of Science, Vietnam National University, Ho Chi Minh city
1
Received 11 April 2017; accepted 28 August 2017
Abstract:
In this report, the adsorption of Zn(II) ion on g- and a-MnO2 nanostructures
was compared. The results showed that the maximum adsorption was obtained
at pH = 4.0 for both materials and after 60 minutes for g-MnO2 and 80 minutes
for a-MnO2. Adsorption isotherm models demonstrated that the Langmuir was
the best model to describe the adsorption of Zinc(II) on g- and a-MnO2 because
of the highest correlation coefficient (R2), the smallest root mean square
error (RMSE), and the nonlinear chi-squared test (c2) values. The maximum
adsorption capacity of g-MnO2 calculated from Langmuir model was 55.23
mg/g, which was roughly double a-MnO2. The lower 1/n value from Freundlich
model for a-MnO2 revealed that it was not as favourable as g-MnO2. The
heat of the adsorption as well as the mean free energy estimated from Temkin
and Dubinin - Radushkevich models to be less than 8 kJ/mol indicated that
the adsorption on both materials followed a physical process. Kinetic studies
showed that pseudo-second-order model was accurate to describe both
materials in three stages.
Keywords: adsorption, kinetics, Zinc, a-MnO2 , g-MnO2.
Classification number: 2.2
Introduction
Zinc is an essential trace element
that can be found in cells throughout
the human body as well as animals
and plants. However, Zinc can cause
depression, lethargy, neurological signs,
and excessive thirst [1]. Zinc is widely
used in many important industrial
applications such as mining, coal and
waste combustion, and steel processing
[2]. Various treatment techniques have
been applied to remove Zinc(II) ions from
contaminated water such as chemical
precipitation, flotation, adsorption,
ion exchange, and electrochemical
deposition [3]. Adsorption technology is
considered as one of the most efficient
and promising methods for the treatment
of trace amount of heavy metal ions in
a large volume of water because of its
enrichment efficiency and the ease of
phase separation [4-9].
Manganese dioxide is a low-cost
and environmentally friendly material.
Along with many types of crystalline
structures such as a-, b-, and g-, etc.,
manganese dioxide has been extensively
studied due to its excellent chemical
characteristics. Therefore, this material
is applied in different areas such as
batteries, molecular sieves, catalysts,
and adsorbents [10-12]. However, a
systematic comparison of the adsorption
of Zn(II) from the aqueous solution onto
a- and g-MnO2 nanomaterials has not
been reported.
Our goal is to compare the adsorption
Corresponding author: Email:
*
14
Vietnam Journal of Science,
Technology and Engineering
september 2017 l Vol.59 Number 3
capacity of Zinc(II) from aqueous
solution by using a- and g-MnO2
nanomaterials as adsorbents. Four nonlinear adsorption isotherm models,
namely Langmuir, Freundlich, Temkin,
and Dubinin - Radushkevich and three
kinetic models, namely pseudo-firstorder, pseudo-second-order, and intradiffusion were used to assess the uptake
capacity and to predict the adsorption
mechanism.
Material and methods
Chemicals
Potassium permanganate (KMnO4),
ethyl alcohol (C2H5OH), HNO3, and
NaOH with analytical grade were
purchased from Merck. Zn(II) ion was
used as the adsorbate. 1000 mg/l of zinc
standard stock solution was prepared
by dissolving Zn(NO3)2 respectively in
double-distilled water.
Analytical methods
Atomic Absorption Spectrometry
(flame technique) was used to determine
the concentration of zinc in aqueous
solution by using an atomic absorption
spectrophotometer
AA
7000
(Shimadzu, Japan).
The pH measurements were done with
a pH-meter (MARTINI Instruments Mi150 Romania) which was standardized
by using HANNA instruments with three
buffer solutions with the pH values of
4.01±0.01, 7.01±0.01, and 10.01±0.01.
Temperature-controlled
shaker
(Model IKA R5) was used for the
equilibrium studies.
Physical Sciences | Chemistry
Preparation a-MnO2 and g-MnO2
The g-MnO2 was successfully
synthesized by L. Ngoc Chung and
D. Van Phuc [11] from ethanol and
potassium permanganate; whereas,
a-MnO2 was formed by heating g-MnO2
at 6000C [12]. The synthesized g-MnO2
and a-MnO2 characterized by X-ray
Diffractometer D5000 with X-ray
radiation: CuKa, λ = 1.54056Å, Ultra
High Resolution Scanning Electron
Microscopy S - 4800, Transmission
Electron Microscope with physical
absorption system Micrometrics Gemini
VII, and BET-BJH analysis were used as
absorbents to adsorb Zinc(II) ions from
aqueous solution.
Adsorption study
0.1 g of adsorbents was placed
into 50 ml of Zn(II) ion solution in a
100 ml conical flask. The effect of pH
(2-6), contact time (20-240 min), and
initial concentration of Zn(II) ions
were examined. The obtained mixture
was centrifuged at 5500 rpm within 10
minutes, then was purified by PTFE
Syring Filters with 0.22 µm of pore size
to get the filtrate. The concentrations
of Zn(II) ions in the filtrate before and
after the adsorption were determined by
F- ASS.
The adsorption capacity was
calculated by using the mass balance
equation for the adsorbent [12].
( C − Ce ) .V
q= o
(1)
Table 1. The non-linear, error functions, and meaning of some models.
Non-linear
form
Isotherm
q .K .C
qe = m L e
1+K L .Ce
Langmuir
Meaning
Assuming the adsorption
occurred on monolayer on
the material surface. Also,
estimating the maximum
adsorption capacity on the
material surface.
q e = K F .Ce1/n
Temkin
RT
qe =
Ln ( KT Ce ) for adsorbates as well as
bT
Evaluating the adsorption
potentials of the adsorbent
the heat of the adsorption
process.
Evaluating the value of
mean sorption energy which
( − β .e 2 ) gives information about
qe = qm .e
chemical
and
physical
sorption
Dubinin Radushkevich
where: q is the adsorption capacity
(mg/g) at equilibrium, Co and Ce are the
initial and the equilibrium concentrations
(mg/l), respectively. V is the volume (l)
of the solution, and m is the mass (g) of
the adsorbent used.
Some adsorption isotherm formula
and kinetic models which were applied
to predict both the adsorption capacities
of materials and the adsorption
mechanisms were given in Table 1 and
Table 2 [13].
n
R2 = 1 −
∑(q
n =1
n
e , meas
− qe ,calc )
− qe ,calc
)
2
2
1 n
∑ ( qe,meas − qe,calc )
n − 1 n =1
n
c =∑
2
e , meas
∑(q
n =1
Assuming the adsorption
occurred on multilayers
on RMSE
=
the material surface.
Freundlich
(q
e , meas
− qe ,calc )
2
2
qe ,calc
n =1
The small values of RMSE
and c2 indicate firstly a better
fitting model, and secondly the
correspondence of the model
with the experimental data.
Where: qe: the adsorption capacity at equilibrium (mg/g); qm: the maximum
adsorption capacity (mg/g); Ce: the equilibrium concentration (mg/l); KL:
Langmuir constant; KF: Freundlich constant; n: adsorption intensity; R: the
universal gas constant (8.314.10-3 kJ/K.mol); T: the temperature (K); bT: Temkin
isotherm constant related to the adsorption heat (kJ/mol); KT: the equilibrium
binding constant (l/mol); b: Dubinin-Radushkevich isotherm constant (mol2/kJ2);
e: Dubinin-Radushkevich isotherm constant; E: mean free energy (kJ/mol);
R2: correlation coefficient; RMSE: Root mean square error; c2: Non-linear
chi-squared test.
Table 2. Models and kinetic parameters.
Kinetic parameters
Kinetic models
g- MnO2
qe (exp) (mg/g)
m
The removal efficiency (%) was
calculated using the following formula:
( C − Ce ) .100% (2)
% Removal = o
Co
List of error functions
Pseudo-firstorder model
Pseudosecond-order
model
Intra-particle
diffusion
model
k .t
log ( qe - qt ) = log qe - 1
2,303
t
=
q
1
1
+ .t
k2 qe2
qe
qt= kdt1/2+ C
a- MnO2
25.5 mg/g
K1(min)
7.60.10-3
0.0166
R2
0.5594
0.7323
qe (cal) (mg/g)
1.88
7.00
K2 (g/mg.min)
0.06
5.86.10-3
R2
1.0000
0.9982
qe (cal) (mg/g)
24.94
25.91
k1
4.209
1.741
k2
0.3078
0.1164
k3
0.0026
-0.0025
Where: qe: the amount of solute adsorbed at equilibrium per unit weight of
adsorbent (mg/g); q: the amount of solute adsorbed at any time (mg/g); k1, k2,
kd: the adsorption constant; t, t1/2: adsorption time.
september 2017 l Vol.59 Number 3
Vietnam Journal of Science,
Technology and Engineering
15
Physical Sciences | Chemistry
Results and discussions
Characterization of g- and a-MnO2
nanomaterials
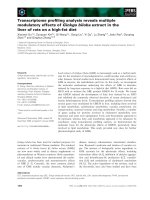
Figure 1 shows the X-ray diffraction
patterns of two samples at room
temperature and at 6000C. The results
indicated that g-MnO2 was formed at
room temperature with some specific
peaks at 2θ = 22.20, 37.80, 42.50,
56.30, and 65.70 corresponded with
orthorhombic γ-MnO2 (JCPDS card
No. 82-2169); whereas, a-MnO2 was
formed by heating g-MnO2 at 6000C with
specific peaks at 2q = 28.580, 37.480,
49.780, 59.980, and 68.980 (JCPDS card
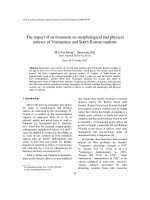
No. 01-072-1982). Surface properties,
which affect the adsorption capacity
of both materials, were determined
by Scanning Electron Microscope
(SEM) (Fig. 2) and TEM (Fig. 3).
The comparison between SEM and
TEM images of g-MnO2 and a-MnO2
provided that g-MnO2 nanomaterial
had a porous surface including many
nanospheres while a-MnO2 consisted
of a lot of nanorods which were bigger
than nanospheres. Moreover, the surface
area of g-MnO2 was 65.00 m2/g, which
was approximately 6.5 times higher than
that of a-MnO2 (about 9.37 m2/g) (Table
3). It can be predicted that adsorption
properties of g-MnO2 were more
favourable than that of a-MnO2.
Fig. 1. XRD patterns of g-MnO2 (a) and a-MnO2 (B).
Fig. 2. SEM images of g-MnO2 (A) and a-MnO2 (B).
Investigation of factors affecting
the adsorption
The pH and adsorption contact
time are important factors affecting the
adsorption of Zinc(II) ions on a- and
g-MnO2 nanomaterials. As shown in
Fig. 4a, at low pH values, the uptake
of Zn(II) onto these materials was lower
because the H+ ions effectively compete
with the Zn2+ [14]. At high pH values, the
adsorption of Zinc(II) ion also decreased
due to the formation of different types
of Zinc(II) such as Zn(OH)+, Zn(OH)2
or ZnO22- [15]. Although the charging
behaviour of MnO2 could induce
16
Vietnam Journal of Science,
Technology and Engineering
Fig. 3. TEM images of g-MnO2 (A) and a-MnO2 (B).
Table 3. BET and BJH analysis results of g-MnO2 and α-MnO2.
BET surface
area
BJH adsorption
pore size
BJH desorption
pore size
g-MnO2
65.00 m2/g
417.83 Å
340.23 Å
α-MnO2
9.37 m2/g
162.95A0
734.37A0
Materials
september 2017 l Vol.59 Number 3
Physical Sciences | Chemistry
adsorption, this effect was not mentioned
in the present study. Therefore, a range
of pH values was chosen from 2.0 to 5.5.
As a result, the maximum adsorption
capacity obtained at pH=4.0 for both
a- and g-MnO2 nano-adsorbents was
approximately 94.96% removal for
a-MnO2 and nearly 98.90% removal for
g-MnO2.
Fig. 4. The influence of pH (A) and adsorption contact time (B) to the removal
of Zinc(II) by a- and g-MnO2 (240 rpm of shaking speed and 50 ppm of initial
concentration).
Figure 4B shows that the adsorption
increases with the increase in the contact
time and reaches equilibrium after 80
minutes for a-MnO2 and 60 minutes
for g-MnO2. However, the adsorption
capacity of g-MnO2 was better than that
of a-MnO2 at any time.
Adsorption models studies
Isotherm models:
Fig. 5. Plots of non-linear isotherm Langmuir models of g-MnO2 (A) and
a-MnO2 (B).
Fig. 6. Plots of non-linear isotherm Freundlich models of g-MnO2 (A) and
a-MnO2 (B).
Fig. 7. Plots of non-linear isotherm Temkin models of g-MnO2 (A) and a-MnO2 (B).
Fig. 8. Plots of non-linear isotherm Dubinin - Radushkevich models of g-MnO2
(A) and a-MnO2 (B).
In order to predict adsorption
mechanisms and assess the adsorption
capacities of a- and g-MnO2 materials,
four
models
namely
Langmuir,
Freundlich, Temkin, and Dubinin Raduskevich were chosen and fitted
with the experimental data.
On the one hand, Langmuir model
assumes the uptake of Zinc(II) onto both
materials to be monolayer adsorption.
Plots of Langmuir models in Fig. 5 and
non-linear isotherm Langmuir models
parameters given in Table 4 provided
that the experimental data of the
adsorption of Zinc(II) ions on a-MnO2
fitted to the Langmuir model better than
that of g-MnO2, which corresponded
with higher R2 value and smaller
RMSE and c2 values. In contrast, the
maximum capacity of a-MnO2 (28.50
mg/g) was two times less than that of
g-MnO2 (55.23 mg/g). It was completely
concordant with the porous structure of
g-MnO2 with many adsorption sites.
On the other hand, Freundlich model
assumes the adsorption of Zinc(II)
ions as the multilayer adsorption and
the interaction between adsorbate and
absorbent. As shown in Fig. 6 and
september 2017 l Vol.59 Number 3
Vietnam Journal of Science,
Technology and Engineering
17
Physical Sciences | Chemistry
Table 4. Isotherm equilibrium parameters.
Isotherm
Langmuir
Freundlich
Temkin
Dubinin Radushkevich
q .K .C
qe = m L e
1+K L .Ce
q e = K F .Ce1/n
qe =
RT
Ln ( KT Ce )
bT
qe = qm .e
( − β .e )
2
Table 4, the experimental data of the
uptake onto a-MnO2 did not fit well
to Freundlich model as g-MnO2 did. In
addition, Zinc(II) ions could interact
with g-MnO2 stronger than a-MnO2
because of the smaller n value of
g-MnO2. Nevertheless, the interactions
between Zinc(II) and both materials
were favourable since the 1/n values of
18
Vietnam Journal of Science,
Technology and Engineering
Isotherm Parameters
Nonlinear forms
g-MnO2
a-MnO2
KL
0.0379
1.805
qm (mg/g)
55.23
28.76
RMSE
0.619
0.1899
R2
0.9928
0.9877
c2
0.0561
0.0078
n
3.17
18.79
KF
10.19
23.44
RMSE
1.036
0.687
R2
0.9798
0.8395
c2
0.2031
0.1089
KT (l/mg)
0.4156
7.34.106
bT(kJ/mol)
0.21
1.69
RMSE
0.6380
0.6544
R2
0.9923
0.8542
c2
0.0693
0.0981
qm (mg/g)
44.16
28.17
b
57.13
0.2859
E (kJ/mol)
0.094
1.32
RMSE
2.262
0.2972
R2
0.9037
0.9699
c2
0.8348
0.0192
a-MnO2 (0.0505) and g-MnO2 (0.1425)
were less than 1.
Temkin and Dubinin-Raduskevich
models were used to estimate the heat of
the adsorption and the mean free energy
of the uptake of Zinc(II) ions onto both
materials. Fig. 7, Fig. 8 and Table 4
showed that the experimental data fitted
september 2017 l Vol.59 Number 3
to Temkin model better than DubininRadushkevich model for g-MnO2;
whereas, a-MnO2 followed Dubinin
- Radushkevich model. Energy values
calculated from both models to be less
than 8 kJ/mol provided that there was a
weak interaction between the absorbent
and adsorbate [16] and the adsorption of
Zinc(II) ions onto a-MnO2 and g-MnO2
was essentially a physical process [8].
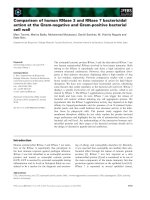
Kinetic models:
The uptake rate of Zn2+ ions onto
a-MnO2 and g-MnO2 surface was
described by three kinetic models,
namely pseudo-first-order, pseudosecond-order,
and
intra-particle
diffusion model. The calculated results
showed that although the adsorption
process partially followed both
pseudo-first-order and pseudo-secondorder equations for different time, the
adsorption of Zinc(II) ions onto both
materials was controlled by the pseudosecond-order model because of its
higher R2 values (Fig. 9 and Table 2). In
addition, intra-particle diffusion model
developed by Weber and Morris [17]
was applied to identify the diffusion
mechanism involved in the adsorption
process. Fig. 10 showed that there were
three stages in the uptake of Zn2+ ions
onto both a-MnO2 and g-MnO2 surfaces.
In the first one, Zn2+ ions were transferred
from the solution to the material’s
surfaces. A gradual adsorption stage, in
which the intra-particle diffusion was
the controlling factor, was occurred
in the second part. However, the plot
did not pass through the origin. It was
thereby concluded that the sorption
can be controlled by two or more
diffusion mechanisms [18]. The last one
constituted the final equilibrium stage
where the intra-particle diffusion started
to decelerate. This can be explained
that firstly, Zn2+ ion concentration in
the solution was extremely low; and
secondly, the adsorbent equilibrium was
obtained when the number of adsorption
sites decreased [19].
Physical Sciences | Chemistry
Anand (2009), “Pb(II), Cd(II) and Zn(II) adsorption on
low grade manganese ore”, International Journal of
Engineering, Science and Technology, 1(1), pp.106122.
[8] R.R. Bhatt, B.A. Shah (2015), “Sorption
studies of heavy metal ions by salicylic acidformaldehyde-catechol terpolymeric resin: Isotherm,
kinetic and thermodynamics”, Arabian Journal of
Chemistry, 8(3), pp.414-426.
[9] C. Necla, R.K. Ali, A. Salih, G.S. Eda, A.
Ihsan (2011), “Adsorption of Zinc(II) on diatomite
and manganese-oxide-modified diatomite: A kinetic
and equilibrium study”, Journal of Hazardous
Materials, 193, pp.27-36.
Fig. 9. Plots of pseudo-first-order (A), pseudo-second-order (B).
[10] J. Li, B. Xi, Y. Zhu, Q. Li, Y. Yan, Y. Qian
(2011), “A precursor route to synthesize mesoporous
γ-MnO2 microcrystals and their applications in
lithium battery and water treatment”, J. Alloy.
Compd., 509(39), pp.9542-9548.
[11] L. Ngoc Chung, D. Van Phuc (2015),
“Sorption of lead(II), cobalt(II) and copper(II) ions
from aqueous solutions by γ-MnO2 nanostructure”,
Adv. Nat. Sci.: Nanosci. Nanotechnol., 6(2),
025014.
Fig. 10. Plots of intra-particle diffusion models of g-MnO2 (A) and a-MnO2 (B).
Conclusions
REFERENCES
To our knowledge, the comparison
of the uptake of Zinc(II) ions onto
a-MnO2 and g-MnO2 nanomaterials
in the optimal condition (4.0 of pH, 80
minutes of shaking time for a-MnO2
and 60 minutes for g-MnO2, and 40-200
mg/l of initial concentration) is the first
report. The results indicated that the
maximum adsorption capacity calculated
from Langmuir for g-MnO2 material was
nearly two times higher than a-MnO2.
Energy values estimated from Temkin
and Dubinin - Radushkevich models
to be less than 8 kJ/mol informed that
the uptake of Zinc(II) ions onto both
materials was essentially a physical
process. Kinetic studies showed that the
adsorption data was well represented
by pseudo-second-order models and
the uptake of Zinc(II) ions onto both
materials followed three stages.
[1] H. Ullah, S. Noreen, Fozia, A. Rehman, A.
Waseem, S. Zubair, M. Adnan, I. Ahmad (2017),
“Comparative study of heavy metals content in
cosmetic products of different countries marketed in
Khyber Pakhtunkhwa, Pakistan”, Arabian Journal of
Chemistry, 10(1), pp.10-18.
[2] C. Gakwisiri, N. Raut, A. Al-Saadi, S. AlAisri, A. Al-Ajmi (2012), “A Critical Review of
Removal of Zinc from Wastewater”, In: Proceedings
of the World Congress on Engineering, London, U.K.,
p.4.
[3] M.A. Barakat (2011), “New trends in
removing heavy metals from industrial wastewater”,
Arabian Journal of Chemistry, 4(4), pp.361-377.
[4] K.S. Tushar, G. Dustin (2011), “Adsorption
of zinc (Zn2+) from aqueous solution on natural
Bentonite”, Desalination and Water Treatment,
267(2-3), pp.286-294.
[5] M. Minceva, L. Markovska, V. Meshko
(2007), “Removal of Zn2+, Cd2+ and Pb2+ from binary
aqueous solution by natural zeolite and granulated
activated carbon”, Macedonian Journal of Chemistry
and Chemical Engineering, 26(2), pp.125-134.
[6] K. Abidin, H. Ali (2005), “Oren adsorption of
zinc from aqueous solutions to bentonite”, Journal of
Hazardous Materials, 125(1-3), pp.183-189.
[7] K. Rout, M. Mohapatra, B.K. Mohapatra, S.
[12] V.P. Dinh, N.C. Le, T.P.T. Nguyen, N.T.
Nguyen (2016), “Synthesis of α-MnO2 Nanomaterial
from a Precursor γ-MnO2: Characterization and
Comparative Adsorption of Pb(II) and Fe(III)”, Journal
of Chemistry, 2016(2016), 8285717.
[13] K.Y. Foo, B.H. Hameed (2010), “Insights
into the modeling of adsorption isotherm systems”,
Chemical Engineering Journal, 156(1), pp.2-10.
[14] C.P.J. Isaac, A. Sivakumar (2013), “Removal
of lead and cadmium ions from water using Annona
squamosa shell: kinetic and equilibrium studies”,
Desalination and Water Treatment, 51(40-42),
pp.7700-7709.
[15] A. Heidari, H. Younesi, Z. Mehraban,
H. Heikkinen (2013), “Selective adsorption of
Pb(II), Cd(II), and Ni(II) ions from aqueous solution
using chitosan-MAA nanoparticles”, Int. J. Biol.
Macromol., 61, pp.251-263.
[16] J. Anwar, U. Shafique, Waheed-uz-Zaman,
M. Salman, A. Dar, S. Anwar (2010), “Removal of
Pb(II) and Cd(II) from water by adsorption on peels of
banana”, Bioresource Technology, 101(6), pp.17521755.
[17] W.J. Weber, J.C. Morris (1963), “Kinetics of
adsorption carbon from solutions”, Journal Sanitary
Engeering Division: Proceedings of American
Society of Civil Engineers, 89(2), pp.31-60.
[18] S. Vasiliu, I. Bunia, S. Racovita, V. Neagu
(2011), “Adsorption of cefotaxime sodium salt on
polymer coated ion exchange resin microparticles:
Kinetics, equilibrium and thermodynamic studies”,
Carbohyd. Polym., 85(2), pp.376-387.
[19] F.C. Wu, R.L. Tseng, R.S. Juang (2000),
“Comparative adsorption of metal and dye on flakeand bead-types of chitosans prepared from fishery
wastes”, Journal of Hazardous Materials, 73(1),
pp.63-75.
september 2017 l Vol.59 Number 3
Vietnam Journal of Science,
Technology and Engineering
19