Effect of feed and draught on Carbon Dioxide emission from the rumen of He-Buffalo
Bạn đang xem bản rút gọn của tài liệu. Xem và tải ngay bản đầy đủ của tài liệu tại đây (468.55 KB, 11 trang )
Int.J.Curr.Microbiol.App.Sci (2019) 8(4): 496-506
International Journal of Current Microbiology and Applied Sciences
ISSN: 2319-7706 Volume 8 Number 04 (2019)
Journal homepage:
Original Research Article
/>
Effect of Feed and Draught on Carbon Dioxide Emission
from the Rumen of He-Buffalo
Akanksha*, Jayant Singh and T.P. Singh
Department of Farm Machinery and Power Engineering, College of Technology, GBPUA&T,
Pantnagar, Uttarakhand, 263145, India
*Corresponding author
ABSTRACT
Keywords
Trifolium
Alexandrinum
(Berseem),
Treadmill, Hebuffalo, CO2
concentration,
Bhusa, Draught
Article Info
Accepted:
07 March 2019
Available Online:
10 April 2019
The bacteria in ruminant animals help to digest the food and produce copious amounts of
carbon dioxide and methane in the process. So, to know the effect of feed on CO 2 emission
from rumen of he-buffalo the study was conducted at 4 different feed concentration at two
different draught levels at 3 hour of exercise on treadmill having speed of 2 km/h and 3
hour of rest period under maintained environment controlled chamber. The environment
temperature and relative humidity was maintained according to the average temperature
and relative humidity of the area which was 25 oC and 90%. Two draught levels of 10%
and 12% of body weight were selected. The study shows decreasing CO 2 concentration in
exhaled air of test he-buffalo with increase in duration of exercise and also with increase in
level of draught and it shows increasing trend with the increase of berseem percentage in
feed. The maximum concentration of CO2 is 75.60% at 10% draught level and at 75%
berseem concentrated feed on dry matter basis during initial hour (o h) of exercise.
Minimum concentration observed is 69.77% at 12% draught level after 3 rd h of exercise
and when 100% wheat bhusa on dry matter basis was used as feed. CO 2 concentration of
test he-buffalo shows increasing trend with increase in duration of rest. The maximum
concentration of carbon dioxide is 76.59% which is at 10% draught (at 3rd hour of rest
period) and at 75% berseem concentrated feed on dry matter basis. Minimum
concentration observed is 72.26% at 12% draught level after 1st hour (initial hour) of rest
and at 100% wheat bhusa on dry matter basis was used as feed.
for more than three decades and its effects
were well documented. Different studies
show that the feeding habits of cattle – cows,
buffaloes and all ruminant creatures
contributes to climate change. A buffalo is a
ruminant animal, which means it extracts
nutrition from the food that it eats by
fermentation process. Agriculture sector
accounts for highest anthropogenic GHGs
emissions. The United Nations Environment
Introduction
Global warming has attracted the attention of
the world communities in the recent years due
to occurrence of the numerous abnormal
weather events, rise in sea level, displacement
of communities, and drop in agricultural
productivity and its effect on livestock and
farming. The effects of the global livestock
industry on global warming have been studied
496
Int.J.Curr.Microbiol.App.Sci (2019) 8(4): 496-506
Programme (UNEP) analysis that the world’s
cattle contributed to more greenhouse gas
emissions than global transport report was
released in 2006. It was estimated that 2125% of carbon dioxide (CO2) from agriculture
activities contributes to the anthropogenic
GHGs emissions (Angela et al., 2000). The
animal emits CO2 per day because of bacterial
digesting cellulose in the Rumen mainly
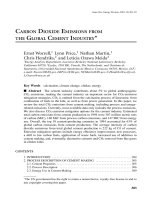
herbivores. Buffaloes contribute to nearly
21.23% (108.7 million) of the total livestock
population in India with its population growth
of 4.18% in rural areas (Shown in the below
chart). Total buffaloes population in India is
108.7 million. In Uttarakhand, buffaloes
numbered at 9, 87,775 as per 2012 Census.
India at 283.8 m above mean sea level, 29°N
latitude, 29.3°E longitude. The psychometric
chamber was developed in the Department.
The chamber having animal tread mill,
humidifiers, air conditioners (split type),
thermometer, etc. Temperature and humidity
was maintained as 25±1oC and 90± 1%
respectively. Two draught 10% and 12% of
body weight of the he-buffalo were selected.
The he-buffalo was put to exercise on
treadmill for 3 hours continuously followed
by 3 hours of rest. The samples were collected
every hour starting from 0 hr in Douglas bag.
Speed and inclination of the treadmill were
fixed at 2 km/h and 0o respectively throughout
the study. Pant adjustable single animal collar
harness with U-shaped pipe frame for
supporting draught used for harnessing of
buffalo.
Nearly 60% of its population is dependent on
agriculture and allied activities and the
draught animal are primary source of power
in India in particular and developing countries
in general. Hence, the present study was
designed to evaluate carbon dioxide emission
from rumen of he-buffalo with the effect of
feed and draught levels at different exercise
and rest periods.
Selection of animal and fodder for the
experiment
Two murrah he-buffaloes weighing 550 ± 18
Kg, age 5-6 year have been selected for the
experiment and were maintained on wheat
bhus, green fodder (berseem) at fixed rate of
3kg/100kg body weight per day on dry matter
basis along with fixed concentrate amount of
2.5kg/day for each trial.
Materials and Methods
The present study has been conducted from
October 2016 to April 2017 in the Department
of Farm Machinery and Power Engineering,
College of Technology, G.B. Pant University
of Agriculture and Technology, Pantnagar.
The study fully based on the guidelines of the
Committee for the Purpose of Control and
Supervision of Experiments on Animals
(CPCSEA, 2006). The he-buffalo was
maintained on wheat bhusa, berseem and
concentrate in different proportion for the
present study.
The dietary treatment was given in different
composition of threshed wheat straw
(length=1.5-3.2cm), berseem (length= 3-4
cm), concentrate and water. Wheat straw has
an average of 8.5 to 15% lignin and 70 to 80
% fiber, its dry matter content was 92.11g per
100g of wheat straw. In 100g of berseem total
60-65% digestible nutrient, 17% crude protein
and 25.9% crude fiber and its dry matter
content was 8.85g -12.65g. Amount of
concentrate was fixed as 2.5kg on daily basis
for each trial. Feed were weighed on dry
matter intake (DMI) before the experiment.
Body weights were measured every seven
days.
Study site and experimental design
For the study, a psychometric chamber was
developed. The site lies in Terai region of
497
Int.J.Curr.Microbiol.App.Sci (2019) 8(4): 496-506
bag as shown in figure 1 to collect and store
the exhaled gas. A 22 mm diameter anti-static
corrugated rubber tube and a three way non
return valve used to connect the face mask
with Douglas bag. Sample for analysis were
collected with the help of 20 ml disposable
syringes. The collected sample was analyzed
through Gas Chromatograph technique.
Sample was analyzed using propaq Q column
in Thermal Conductivity Detector of Nucon
5700 Gas Chromatograph in Bio-Mechanics
lab of Farm Machinery and Power
Engineering Department. Hydrogen gas was
used as carrier gas for the analysis. Volume of
sample used for analysis was 2 ml.
Daily feed for different trials conducted
Berseem and wheat bhusa was used as feed.
Berseem is a highly palatable fodder.
Different amount of feed is selected for
different trials. The wheat bhusa and berseem
diets were offered twice daily at 08:00am and
06:00pm.
T1 = 2.5 kg concentrate + 16 kg wheat straw
per day.
T2 = 2.5 kg concentrate + 12 kg wheat straw +
28 kg berseem per day.
T3 = 2.5 kg concentrate + 8 kg wheat straw +
56 kg berseem per day.
Experimental design and data analysis
T4 = 2.5 kg concentrate + 4 kg wheat straw +
75 kg berseem per day.
The Design Expert 10 Software was used for
the data analysis. The experiment was
designed in factorial, multilevel categorical
method completely randomized design. For
the analysis of data ANOVA technique using
F-test at 1%, 5% and 10% level of
significance was used. For each dependent
parameters with different combinations of
independent variables at constant temperature,
humidity, speed and inclination of treadmill
the linear regression analysis technique was
used to develop mathematical modelling
using Design Expert 10 software.
Feeding was done on dry matter basis during
the period of 14 days continuously and then
the buffalo was made to exercise on tread mill
for four numbers of days.
Buffalo on treadmill exercise
The he-buffalo were exercised on treadmill
from morning 10:00 am to afternoon 01:00
pm, for a period of three hours or up to the
he-buffalo reached a stage of fatigue (fatigues
score card was referred to diagnose). After
that the buffalo kept for rest for three hours
from 01:00 pm to 04:00 pm in controlled
chamber. For the analysis CO2 production by
he- buffalo the exhaled gas samples were
taken on hourly basis during exercise and rest
periods of 3 hours for four no of days in each
trial.
Results and Discussion
Effect of different influencing factors i.e.
different type of feeds, draughts and duration
of exercise on the presence of carbon dioxide
gas concentration in the collected exhaled air
of he-buffalo was estimated and statistically
analysed.
Figure 3.1 to 3.6 shows the average CO2
concentration observed during the treadmill
exercise at two draught levels, 4 feed levels at
3 h of exercise and 3 h of rest period at
constant treadmill speed and maintained
Carbon dioxide measurement technique
Samples was collected by placing an air tight
face mask on the mouth of he-buffalo which
was connected with the leak proof Douglas
498
Int.J.Curr.Microbiol.App.Sci (2019) 8(4): 496-506
environment controlled chamber. Increase and
decrease was measured with respect to 0 hr.
CO2 concentrations
exercise
observed
study the maximum CO2 concentration was
found 75.60% during initial hour and 76.59%
at 3rd h of rest which was slightly higher than
the 65.5% which was found by Sniffen and
Herdt (1991) during investigation on dairy
cattle.
during
The maximum concentration of CO2 is 75.60
% at 10% draught level and at 75% berseem
on dry matter basis during initial hour (0 h) of
exercise. Minimum concentration observed is
69.77% at 12% draught level after 3rd h of
exercise and at 100% wheat bhusa on dry
matter basis was used as feed. It was observed
that maximum percentage decrease in CO2
concentration is 4.03 which were at 12%
draught and at feed proportion of 100 %
bhusa on dry matter basis. The minimum
percentage decrease found is 1.32% at 10%
draught level and 75% berseem proportion on
dry matter basis was used for feeding
purpose. Decrease in CO2 concentration was
found 2.71 and 4.03 percent at 10% and 12%
draught levels respectively when 100% wheat
bhusa on dry matter basis was used as feed.
When addition of 25% berseem was done on
dry matter basis the percentage decrease in
CO2 concentration was observed is 2.54 and
3.87 percent at 10% and 12% draught.
Similarly, 1.72 and 2.85 percent decrease was
observed at 10% and 12% draught when 50%
berseem on dry matter basis was added in
feed. Percentage decrease of 1.32 and 2.14
percent is observed at 10% and 12% draught
respectively when 75% berseem on dry matter
basis used in feed.
It is observed that maximum percentage
increase in CO2 concentration is 2.32% after
third hour of rest from the initial (0 hour)
which is at 10% draught level and at feed
level of 100 % bhusa on dry matter basis. The
minimum percentage increase found is 0.88%
from the initial (0 h) at 12% draught level,
75% berseem on dry matter basis was used
for feeding purpose. Percentage increase in
CO2 was found 2.32 and 1.86 percent from
initial at 10% and 12% draught level
respectively at 100% bhusa on dry matter
basis used as feed. At addition of 25%
berseem in feed on dry matter basis the
percentage increase observed is 1.30 and 1.03
percent at 10% and 12% draught level.
Similarly, increase of 1.40 and 1.39 percent
from initial was observed at 10% and 12%
draught at the addition of 50% berseem in
feed on dry matter basis. Percentage increase
of 1.31 and 0.88 percent from initial is
observed at 10% and 12% draught
respectively when 75% berseem on dry matter
basis was used in feed.
Average percentage increase from 3rd hour of
exercise to the first hour rest period was
found between 1 to 4 %. The maximum
percentage increase in CO2 concentration
after exercise and at first hour of rest was 3.44
at feed level of 100% bhusa on dry matter
basis at 12% draught and minimum was 1.58
at feed concentration of 75% berseem on dry
matter basis at 10% level of draught.
CO2 concentrations observed during rest
The maximum concentration of carbon
dioxide is 76.59% which is at 10% draught
and having 75% berseem concentration on
dry matter basis at 3rd hour of rest period.
Minimum concentration observed is 72.26%
at 12% draught level after 1st hour (initial
hour) of rest and when 100% wheat bhusa on
dry matter basis was used as feed. During the
The concentration of CO2 at 3rd h of rest
period after exercise was higher than the
initial (0 h). The relationship between CO2
concentration with different feed level,
499
Int.J.Curr.Microbiol.App.Sci (2019) 8(4): 496-506
valid for 98.79 % data. The value of R2 –
adjusted was 98.37 which was observed to be
close to R2 (0.9879) value. It shows a
relatively satisfactory adjustment to the model
obtained from the experimental data.
duration of exercise, duration of rest period
after exercise, two draught levels at constant
level of temperature, humidity, inclination of
treadmill and speed is depicted in Figure 3.1–
3.6 represent the average relation between
different feed concentration and CO2 emission
at different duration of exercise and rest
period at 10% and 12% draught.
The predicted R2 (0.9796) is in reasonable
agreement with the adjusted R2 of 0.9837 i.e.,
the difference is less than 0.2. The Model
obtained was highly significant (p<0.01) at
Fcal value of 205.00 which was greater than
Ftab value 9.23 at 1% level of significance.
Results of regression analysis of data
obtained during exercise
The regression analysis of the experimental
variables for carbon dioxide was done using
multilevel categorical design in Factorial
method of Design expert 10. Thirty two
experiments were carried out with the
combinations of three variables and there
different levels. The F-value of model
obtained implies that the model was
significant at 1% level (p< 0.01) of
significance.
The significant predicted quadratic regression
equation for CO2 emission in exiled gas of hebuffalo is as follows:
CO2 concentration (%) Y = 73.62 - 0.29 A +
1.66 B – 0.99 C – 0.22 AC + 0.32 BC – 0.42
B2
. .. (3.1)
Where,
Statistical analysis of CO2 concentration
during exercise
A= Draught
B = Feed (% DMB of berseem)
C = Duration of exercise and rest (h)
In terms of linear, interactive and quadratic
term the effect of different treatment on CO2
emission was done through Analysis of
Variance (ANOVA). F-value indicate that
linear terms of independent variables
significantly affected CO2 concentration
(P<0.01) at 1% level of significance. F-value
of individual independent parameters indicate
that effect of draught, feed, duration of
exercise was highly significant at 1% level of
significance (p<0.0001) (Table 1).
Positive terms of coefficient B, AB, BC
indicate the increase in CO2 concentration
with increase in level of variables. Negative
term of coefficient A, C, AC, B2 indicate the
decrease in CO2 concentration with increase
in level of variables.
Graphical analysis of CO2 concentration in
exhaled gas during exercise
The method used for the graphical analysis of
data obtained during the experiment was
Factorial method multi categorical design in
Design Expert 10. Figure 3.7 gives the 3Dimensional representation of the relationship
between the independent variables and the
CO2 emission during exercise it was
concluded from graph the decrease of CO2
emission with increase in draught and
Numerical analysis of CO2 concentration in
exhaled gas of buffalo during exercise
Multiple linear regression analysis was done
for the CO2 concentration in exhaled gas.
Regression analysis results that the coefficient
of determination (R2) for regression model is
0.9879, which conclude that the model was
500
Int.J.Curr.Microbiol.App.Sci (2019) 8(4): 496-506
data. The predicted R2 (0.9533) is in
reasonable agreement with the adjusted R2 of
0.9765 i.e., the difference is less than 0.2. The
Model obtained was highly significant
(p<0.01) at Fcal value of 68.66 which was
greater than Ftab value 3.89 at 1% level of
significance.
duration of exercise and increasing trend with
increase in berseem percentage.
Results of regression analysis of data
obtained during rest
The regression analysis of the experimental
variables was done using multilevel
categorical design with three variables in the
Factorial method. Twenty four experiments
were carried out with the combinations of
three variables containing different levels.
The model F-value implies the model was
significant at 1% level (p< 0.01) 0f
significance.
The significant predicted quadratic regression
equation developed for CO2 emission in
exiled gas of he- buffalo is given below.
CO2 concentration (%) Y = 75.08 – 0.31 A +
1.19 B + 0.61 C – 0.19 BC– 0.18B2 . .. (3.2)
Where,
Statistical analysis of CO2 concentration in
exhaled gas during rest
A= Draught
B = Feed (kg)
C = Duration of exercise and rest (h)
Shows the effect of different treatment
variables in linear, interactive and quadratic
term on CO2 emission during rest. In Table Fvalue (68.66) indicate that linear terms of
independent variables significantly affected
CO2 concentration (P<0.01) at 1% level of
significance. The interactive and quadratic
term also affect CO2 concentration at 1%
level of significance. It was found that the
effect of draught, feed, duration of exercise
was highly significant at 1% level of
significance (p<0.0001).
Positive terms of coefficient B, C indicate the
increase in CO2 concentration with increase in
level of variables. Negative term of
coefficient A, BC, B2, C2 indicate the
decrease in CO2 concentration with increase
in level of variables.
Graphical analysis of CO2 concentration in
exhaled gas during rest
The Factorial method multilevel categorical
design in Design Expert 10 was used for the
graphical analysis of data obtained during the
experiment when buffalo was at rest after
exercise.
Numerical analysis of CO2 concentration in
exhaled gas of buffalo
Multiple linear regression analysis was done
for the CO2 concentration in exiled gas at rest.
The Regression analysis results that the
coefficient of determination (R2) for
regression model is 0.9765, which conclude
that the model was valid for 97.65 % data.
Figure 3.8 gives the 3-Dimensional
representation of the relationship between the
independent variables and the CO2 emission
during rest period after exercise. It was
concluded from graph the decrease of CO2
emission with increase in draught and
increase in emission with increase in duration
of exercise and berseem percentage of feed.
The value of R2 –adjusted was 0.9639 which
was observed to be close to R2 (0.9765) value.
It shows a relatively satisfactory adjustment
to the model obtained from the experimental
501
Int.J.Curr.Microbiol.App.Sci (2019) 8(4): 496-506
Table.1 Dependent and independent variables
Independent Variables
Trial
no.
Feed composition
Dependent
variable
Draught
equivalen
t to %
body
weight
%
%
Sample
collection at
different
hours of
exercise
hour
Sample
collection
at different
hours of
rest
hour
0th,1st, 2rd and
3rd
th st rd
0 ,1 ,2 and
3rd
0th, 1st, 2rd
and 3rd
0th, 1st, 2rd
and 3rd
4th, 5th and
6th
th th
4 , 5 and
6th
4th, 5th and
6th
4th, 5th and
6th
T1
Wheat
straw
(%)
100
Berseem
(%)
Concentrate
(fixed)
0
2.5 kg
10
12
T2
75
25
2.5 kg
10
12
T3
50
50
2.5 kg
10
12
T4
25
75
2.5 kg
10
12
Fig.1.1 Distributions of all India Livestock census-2012
Fig.2 View of three way air valve and face mask connected with Douglas bag
502
Percentage
(%)
CO2
production
CO2
production
CO2
production
CO2
production
Int.J.Curr.Microbiol.App.Sci (2019) 8(4): 496-506
Fig.3.1 Relationship between CO2 concentrations in the exhaled gas during exercise and rest at
two draught levels and at 100% wheat bhusa on DMB as feed
Fig.3.2 Relationship between CO2 concentrations in the exhaled gas during exercise and rest at
two draught levels and at 25% berseem on DMB as feed
Fig.3.3 Relationship between CO2 concentrations in the exhaled gas during exercise and rest at
two draught levels and at 50% berseem on DMB as feed
503
Int.J.Curr.Microbiol.App.Sci (2019) 8(4): 496-506
Fig.3.4 Relationship between CO2 concentrations in the exhaled gas during exercise and rest at
two draught levels and at 75% berseem on DMB as feed
Fig.3.5 Carbon dioxide emission at 10% draught level and different feed proportions at exercise
and rest period
Fig.3.6 Carbon dioxide emission at 12% draught level and different feed proportions at exercise
and rest period
504
Int.J.Curr.Microbiol.App.Sci (2019) 8(4): 496-506
CO2 (%)
Fig.3.7 Effect of draught, feed, duration of rest on CO2 emission
CO2 (%)
Fig.3.8 Effect of draught, feed and duration of rest on CO2 emission during rest
Conclusions of the study are as follows:
The dietary dependence has effect on
the CO2 emission. It shows increasing
trend with the increase of berseem
percentage in feed.
The CO2 concentration in exhaled air
of test he-buffalo shows decreasing
trend with increase in duration of
exercise and also with increase in
level of draught
505
The maximum concentration of CO2
during exercise is 75.60 % at 10 %
draught level and at 75 % berseem on
dry matter basis during initial hour (o
h) of exercise.
CO2 concentration in exhaled gas was
found increasing with the increase in
duration of rest period after exercise.
The maximum concentration of CO2
during rest was 76.59 % at 10 %
draught level during 3rd hour of rest
Int.J.Curr.Microbiol.App.Sci (2019) 8(4): 496-506
and when 75 % berseem on dry matter
basis used during feeding.
Indian veterinary research InstituteDeemed University, Izatnagar (India).
pp. 75.
Pedersen, S., Blanes-Vidal; Jørgensen, H,;
Chwalibog, A., Haeussermann, A.,
Heetkamp, M.J.W., Aarnink, A.J.A.,
2008. Carbon dioxide production in
animal houses: a literature review.
Agricultural
Engineering
International.: CGIR E journal: Manus
BC 08 008, vol. X. December. 19 pp.
Pinares-Patino, C. S., D’Hour, P., Jouany, J.
P. and Martin, C. 2006. Effects of
stocking rate on methane and carbon
dioxide emissions from grazing cattle.
Agriculture,
Ecosystems
and
Environment, 121 : 30-46.
Sniffen, C.J. and H. H. Herdt. 1991. Typical
compositions of rumen gases. The
Veterinary Clinics of North America:
Food Animal Practice, Philadelphia,
PA: W. B. Saunders Company, 7(2).
Sharma, S.C. 2006. Effect of environment and
work conditions on fatigue of draught
buffalo. Thesis, PhD. G.B. Pant
University of Agriculture and
Technology, Pantnagar.
Thakur, T.C., Singh., Bachchan and Singh,
M. P. 1989b. Effect of load in
physiological response of buffaloes in
rotary
mode.
Agricultural
Mechanization in Asia, Africa and
Latin America, 20 (4): 15-22.
References
19th Livestock census-All India Report 2012.
Ministry of Agriculture, Department
of Animal Husbandry and Fisheries.
Beauchemin, K. A., Eun J. S. 2008.
Relationship
between
enzymic
activities and in-vitro degradation of
alfalfa hay and corn silage. Animal
feed science and technology, 145 (14): 53-67.
Bell, M., Eckard, R., Moate, P. J., Yan, T.
2016. Modelling the effect of diet
composition on enteric methane
emissions across sheep, beef cattle and
dairy cows. Multidisciplinary Digital
Publishing Institute, 6(9): 54.
Kumar, m. and Nandini, N. 2015. Livestockrelated greenhouse gas emissions – a
profile of Bengaluru urban district,
India. International Journal of
Advance Research, 3 (1): 290-295.
Madsen, J., Bjerg, B.S., Hvelplund, T.,
Weisbjerg, M. R. and Lund, P. 2010.
Methane and carbon dioxide ratio in
excreted air for quantification of the
methane production from ruminants.
Livestock Science, 129 : 223-227.
Mehadra, Jaiprakash. 2002. Effect of
treadmill exercise and heat on
physiology of male buffalo calves.
Thesis M.V.Sc. (Animal Physiology),
How to cite this article:
Akanksha, Jayant Singh and Singh, T.P. 2019. Effect of Feed and Draught on Carbon Dioxide
Emission from the Rumen of He-Buffalo. Int.J.Curr.Microbiol.App.Sci. 8(04): 496-506.
doi: />
506