Soil organic carbon stocks assessment in Uttarakhand state using remote sensing and Gis technique
Bạn đang xem bản rút gọn của tài liệu. Xem và tải ngay bản đầy đủ của tài liệu tại đây (865.38 KB, 13 trang )
Int.J.Curr.Microbiol.App.Sci (2019) 8(1): 1646-1658
International Journal of Current Microbiology and Applied Sciences
ISSN: 2319-7706 Volume 8 Number 01 (2019)
Journal homepage:
Original Research Article
/>
Soil Organic Carbon Stocks Assessment in Uttarakhand State using Remote
Sensing and GIS Technique
Nitin Surendra Singh Gahlod, Navneet Jaryal*, Mallikarjun Roodagi,
Sanjay A. Dhale, Devinder Kumar and Ravindra Kulkarni
Soil and Land Use Survey of India, C - 4, sector - 1, Noida-201301
*Corresponding author
ABSTRACT
Keywords
Bulk density
Models, Carbon
cycle, Carbon stock,
Pedotransfer
function, SOC stock
Article Info
Accepted:
12 December 2018
Available Online:
10 January 2019
Soil organic carbon (SOC) content is key component of the global carbon (C) cycle which
is highly variable with respect to space and time. The main objective of this study was to
provide an assessment of soil organic carbon (SOC) stock variability for Uttarakhand state.
The other objective of this study was to evaluate the performance of different pedotransfer
functions for reliable assessment of bulk density. Soil Resource Mapping for Uttarakhand
state was conducted on 1:50,000 scale with the help of Satellite imagery (LISS III) along
with exhaustive ground truthing through soil surveys. Stratified sampling was carried out
based on remotely sensed satellite data for different slope, physiography and landuse/cover. The physico-chemical properties of selected samples for agriculture and forest
land use were utilized for analyzing the performance of six pedotransfer functions for
assessment of bulk density. The SOC stocks were estimated on the basis of soil organic
matter content for top 20 cm layer and bulk density estimated from best performing
pedotransfer functions models. The SOC stock class of 51-100 tonnes C ha-1 was
dominated by covering 42.00% of state area followed by 26-50 tonnes C ha-1 class
covering 23.74% area. Similarly, about 7.91% and 3.24 % area of state are covered under
11-25 tonnes C ha-1 and 101-160 tonnes C ha-1 classes, respectively. Remaining 22.44 % of
state not forms part of study were mapped under settlement, snowbound area,
drainages/rivers, reservoirs etc. The difference in performance of pedotransfer functions
under different land use system implies the necessity of evaluation of pedotransfer
functions before their implementation. Significantly greater SOC stocks were observed in
forest and grassland/open-scrub land use and such differences can be attributed to the
higher tree/shrub density, shrub/herb biomass and forest litter in the forest areas as
compared to agriculture land use.
Introduction
Greenhouse gases (GHGs) emission from
anthropogenic activities is considered to be
most significant driver of observed climate
change since the mid-20th century. In annual
report for the year 2017, National Centers for
Environmental Information (NCEI) ref
reported that global annual land surface
temperature was 1.31°C above the 20th century
1646
Int.J.Curr.Microbiol.App.Sci (2019) 8(1): 1646-1658
average and also the third highest in the 138year record, behind 2016 (warmest) and 2015
(second warmest). The global oceans also had
their third warmest year since global records
began in 1880 at 0.67°C (1.21°F) above the
20th century average (Global Climate Report,
2017)
The resulting variability of climate poses
threat to the environment and the quality of
human life over the world. It is for this reason;
the parties to the United Nations Frame Work
Convention on Climate Change (UNFCCC)
have undertaken a comprehensive exercise to
address the issues of climate change
adaptation and mitigation. For such an
undertaking, the assessment and management
of natural carbon sources and sinks has proven
to be most vital and practical approach to
regulate the level of GHGs in the atmosphere.
proportion of humified carbon and the rate of
efflux of carbon (Lal, 2001). There is
established link between soil quality and soil
organic carbon (SOC) concentration and
atmospheric carbon.
With this work, we aim to make an assessment
of SOC stock in Uttarakhand state of India as
a unit under different soils and landuse
systems (with its extent on surface layer i.e. 25
cm). Information on carbon status could aid in
estimating carbon sequestration potential for
this important but fragile ecosystem of
Uttarakhand state, India. The information
generated in this study will be useful for
policy-makers and environmentalists for
undertaking appropriate conservation plans.
Materials and Methods
Study area
Systems involving vegetation act as carbon
sinks due to their ability to sequester from
atmospheric carbon to deep layers of soil
profile. Atmospheric carbon can be
sequestered in long-lived carbon pools of plant
biomass both above and below ground or
recalcitrant organic and inorganic carbon in
soils and deeper subsurface environments.
Soil organic carbon (SOC) is the carbon held
within soil organic constituents (i.e., products
produced as dead plants and animals
decompose and the soil microbial biomass).
The SOC stock to 1m depth ranges from 30
tons C /ha in arid climates to 800 tons/ha in
organic soils in cold regions, and a
predominant range of 50 to 150 tons C /ha
(Lal, 2004). Soils are considered as the largest
carbon reservoirs of the terrestrial carbon
cycle storing 2344 Pg (1 Pg = 1015 g) of
carbon (C) up to 3 m depth which is more than
twice that in vegetation (359 Pg) and
atmosphere (760 Pg) combined. The size of
the soil organic matter pool is determined by
the rate of input of fresh organic matter, the
Uttarakhand state is a part of the northwestern Himalayas bounded by Nepal in the
East and Himachal Pradesh in the West while
the northern boundary goes up to Tibet/China,
whereas southern boundary extends into IndoGangetic plains. The state lies between 28⁰ 43'
and 31⁰ 27’ N Latitude and 77⁰ 34’ and 81⁰
02’ E Longitude with total geographical area
of 53,48,379 ha, out of which approximately
84.7% is mountainous. About 20.03% of total
geographical area is under snow cover/glaciers
and steep slopes. The major North Indian
rivers – the Ganga and the Yamuna, originate
from this region. Uttarakhand state covers 13
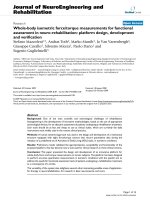
districts within two revenue divisions (Figure
1). Out of total geographical area, 41,48,338
ha area was covered under this study while
remaining 12,00,040 ha area was covered
under miscellaneous landuse i.e. habitation,
rockout crop, snow cover and waterbodies.
The climate of Uttarakhand state can be
characterized as subtropical. Within the same
catchment subtropical even tropical climate is
1647
Int.J.Curr.Microbiol.App.Sci (2019) 8(1): 1646-1658
often observed at the lower end of the
watershed i.e. in valleys, while temperate
climate prevails in the upper reaches of the
stream. The mean annual rainfall varies from
1100 to1600 mm with intensity ranging from
drizzling to torrential rain. The rainfall is
heavy and well distributed in from June to
September the wet season accurse during these
months, the rainfall is moderate during May
and October and the rainfall is low during
November to February.
Soil resource mapping survey
The study was conducted during 2010-12 in
the state of Uttarakhand by Soil and Land Use
Survey of India (SLUSI) using guidelines
developed for Soil Resource Mapping. The
area of interest was large, having high
altitudinal variation and other biophysical
factors such as climate, slope and topography
that influence soil type and biomass
accumulation (and therefore Soil mapping and
C stocks assessed in stratified fashion),
stratification was carried on the basis of
altitude zones and random selection of
sampling points on differences in slope,
physiography and landuse/cover in order to
reduce uncertainty. Development of data on
1:50,000 scale to the extent of the area of
interest was done to design of an effective
sampling procedure to depict extent of area.
Stratified sampling using remotely sensed
LISS III (Spatial resolution 23.5 m) satellite
data based on differences in slope,
physiography, altitude and land-use/cover
collected randomly along the road side taking
in to account remoteness/inaccessibility of
region. Carbon accounting making use of
stratified random sampling has the benefits
when compared to a random sampling
approach. In this case, stratification refers to
the division of a heterogeneous landscape into
distinct strata based on the carbon stock in the
vegetation. The benefits of this method are:
a.
If the strata are well defined and
internally homogeneous (relative to all areas
of equal altitude zones), the number of
samples required to achieve a specified
accuracy of the mean is considerably smaller
than with random sampling.
b.
The method is more robust if the
overall distribution does not follow a normal
random distribution, but still assumes
deviations from such a distribution within
each stratum are manageable in carbon
accounting, maps derived from remote sensing
(or direct attributes at the unit or pixel scale)
form the strata containing range of slopes,
land use/ cover types. The LISS III data
generally have higher precision on low carbon
density landscapes and variations within high
carbon density categories.
Preparation and processing of samples
In the laboratory, samples for C analysis were
dried in a solar oven and then sieved first
through 20 mm mesh and then through 2 mm
mesh. The plant roots and other visible
fractions were removed and a fraction of each
specimen was ground and reduced to particles
with maximum diameter of 50 microns before
automatic chemical analysis. Samples for
determination of bulk density were placed to
dry in KR box in an electric oven at 105 °C
for approximately 72 hours.
Analysis of pH, total carbon content and
particle size distribution
Soil pH of the samples was determined in a
soil water suspension (1:2.5) by pH meter
using a glass electrode. Organic Carbon was
estimated by Walkley and Black method
(Jackson, 1973).
Particle size distribution (mechanical analysis)
of soil sample was determined by Bouyoucos
Hydrometer method (Bouyoucos, 1962).
1648
Int.J.Curr.Microbiol.App.Sci (2019) 8(1): 1646-1658
Estimation of bulk density
For agriculture and forest landuse system,
selected samples were analyzed in laboratory
for estimation of bulk density as per standard
Keen Raczkowski box technique (Black,
1965).
The various cases reported in literature
indicates that the bulk density is closely
associated with soil physical and chemical
properties and can be estimated using
pedotransfer functions but the performances of
pedotransfer functions varies when subjected
to different soils and landuse systems. The
majority of these studies support the
recommendation to apply these functions with
care and evaluate the best function for each
soil conditions before further applications
(Abdelbaki, 2016; Xu et al., 2015 and Kaur et
al., 2002).
Many researchers have observed that the soil
texture is the most significantly related soil
property which is related to bulk density of
soil due to which sand and clay are the most
essential parameter used in most of the
pedotransfer functions models (Kumar et al.,
2009). The soil organic carbon is considered
to be second after soil texture in governing the
soil bulk density and is reported to have a
significant but negative correlation with bulk
density of soil (Chaudhari et al., 2013; Sakin,
2012; Sakin et al., 2011; Leifeld et al., 2005
and Morisada et al., 2004). Therefore, keeping
these facts in mid, the physico-chemical
characteristics of 130 samples analyzed in
laboratory for agriculture and forest land use
were used for estimation of bulk density
through six different models based on
pedotransfer functions selected form literature
and the calculated bulk density of these three
models were plotted in against the values of
observed bulk density and plotted graphs were
utilized
to
work
out
coefficient of
determination (R2 value), thereby validating
the models as per mentioned in literature
(Abdelbaki, 2016; Bernoux et al., 1998;
Tomasella and Hodnett, 1998 and Benites et
al., 2007).
The equations used to estimate the bulk
density values from the aforesaid models are
as under:
Model 1: Bulk Density (kg/dm3) = 1.419 0.0037 × clay (%) - 0.061 × carbon (%)
Model 2: Bulk Density (kg/dm3) = 1.5688 0.0005 × clay (g/kg) - 0.009 × carbon (g/kg)
Model 3: Bulk Density (kg/dm3) = 1.578 0.054 × carbon (%) - 0.006 × silt (%) - 0.004
× clay (%)
Model 4: Bulk Density (kg/dm3) = 0.69794 +
0.750636 Exp [-0.230355 x OC (%)] +
[0.0008687 x sand (%)] + [0.0005164 x clay
(%)]
Model 5: Bulk Density (kg/dm3) = 1.66 0.308 (OC)0.5
Model 6: Bulk Density (kg/dm3) = 0.167 x
1.526/ {1.526 x OM (%) + 0.159 [1-OM
(%)]/100)}
Calculation of SOC stock
SOC stocks were calculated for each mapping
unit using analytical data of associated soil
series in mapping units using following
formula:
SOC stock (t C ha-1)= depth (m) x bulk
density (Mg cm-3) x OC (g kg-1)
The observed SOC stocks were categorized in
five groups (0 - 10, 11 - 25, 26 - 50, 51 - 100
and 101 -160 t C ha-1) for the state. The
present study has been aimed at SOC stock
mapping for assessment of SOC stocks under
1649
Int.J.Curr.Microbiol.App.Sci (2019) 8(1): 1646-1658
different land uses of Uttarakhand state. The
soil layer developed in Soil Resource mapping
survey developed using remote sensing (RS)
technique in GIS software Arc-GIS 10.3 was
used as base for preparing SOC stock map.
Results and Discussion
Comparison of models for bulk density
determination
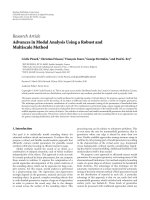
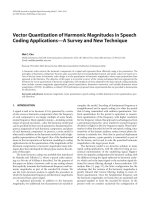
The plotted graphs of estimated bulk density
against observed bulk density observed best
R² value for agriculture (0.811) for
pedotransfer function “model 2” equation
whereas “model 1” observed best R² value
(0.702) for forest land use (Figure 2 and 3).
Therefore “model 2” was selected for
estimation of bulk density in agriculture
landuse while “model 1” was used for
estimation of bulk density in forest, plantation
and open scrub land uses. The inconsistency in
performance of pedotransfer function models
for bulk density models for different land use
systems. These results supports the findings of
various studies which supports the evaluation
of these pedotransfer function models due to
their difference in performance under different
land conditions (Nanko et al., 2014; Han et
al., 2012; Jalabert et al., 2010; Martin et al.,
2009)
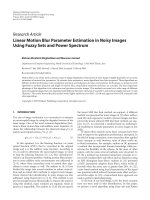
SOC stock in Uttarakhand state
Among different classes of SOC stock, the
maximum area of 22,46,367 ha was covered
under SOC stock class of 51 - 100 t C ha-1
followed by SOC stock classes of 26 - 50 t C
ha-1 (12,69,597 ha), 11 - 25 t C ha-1 (4,22,794
ha), 101 - 160 t C ha-1 (1,73,488 ha) and 0 - 10
t C ha-1 (36,092 ha), respectively (Table 1 and
Figure 4).
SOC stock in different districts
The SOC stock class of 51 - 100 t C ha-1 was
the dominant class in the eight out of thirteen
districts of Uttarakhand state (except
Bageshwar, Champawat, Haridwar, Nainital
and Udham Singh Nagar districts) covering an
area of 42.00% and 30.60% area out of total
geographical area and total surveyed area,
respectively (Table 1 and Figure 4). The
districts covering the mountainous area of
state observed higher SOC stocks due to
having majority of area under forests and open
scrub which have higher SOC content as
compared to agriculture soils.
SOC stock under different landuse systems
The landuse systems of forest and
grassland/open-scrub observed to have
majority of area having SOC stock more than
51 t C ha-1 (72.65% of forest area and 77.70%
area under grassland/open-scrub) as compared
to agriculture where 81.44% area was
recorded to have less than 50 t C ha-1 SOC
stock (Table 2). These results are in agreement
with literature that the forest and grasslands
have higher potential of accumulating and
conserving SOC as compared to agriculture as
the change in landuse from forest and
grassland to agriculture is accompanied by
loss in SOC (Kassa et al., 2017; Martín et al.,
2016; Poeplau and Don, 2013; Kuimi et al.,
2016).
The occurrence of higher SOC content in both
forest and grassland/open-scrub can be
attributed to the litter fall addition from trees
and shrubs to the surface soil (Yimer et al.,
2015; Worku et al., 2014 and Nsabimana et
al., 2008) Furthermore, the forest and
grassland/open-scrub possess a higher organic
carbon; through dead fine tree and shrub roots
and the mycorrhizal fungi contribution of
organic matter (Yimer et al., 2007 and Lemma
et al., 2006). Whereas, the low carbon stocks
were observed in agriculture land-use as soils
in these area are subjected to continuous loss
of SOC due to frequent soil disturbance, crop
uptake, leaching and surface erosion losses,
and inadequate land management.
1650
Int.J.Curr.Microbiol.App.Sci (2019) 8(1): 1646-1658
Table.1 District wise area distribution of SOC stocks in Uttarakhand state
Districts
Area (ha)
SOC stock (t C ha-1)
Miscellaneous
0 - 10
11 - 25
26 - 50
51 - 100
101 -160
Habitation
Rockout Crop
Snow Cover
Waterbodies
Total area
783
5003
108225
191482
704
1184
-
-
3065
310446
Bageshwar
-
36554
78952
73923
9807
65
-
27338
738
227377
Chamoli
-
11640
75603
321865
49652
34
173
314754
2893
776613
6388
17283
85910
59250
1758
183
217
-
6978
177967
Dehradun
-
-
59119
222780
1041
9960
-
-
11973
304872
Haridwar
4556
161560
33004
15553
-
6981
-
-
15424
237078
Nainital
9998
78329
170915
135924
-
876
-
-
16065
412106
Pauri Garhwal
14367
54095
215584
228845
867
53
-
-
14719
528530
Pithoragarh
-
10435
40976
378684
34795
674
950
254047
3366
723927
Rudraprayag
-
737
28940
134810
2813
19
-
31011
1210
199541
Tehri Garhwal
-
3156
125911
198875
33929
239
-
24126
4020
390258
Udham Singh Nagar
-
38181
187283
5841
-
5310
-
-
17571
254188
Uttarkashi
-
5820
59176
278533
38122
139
-
420265
3421
805477
Almora
Champawat
Total Area
4148338
1200040
1651
5348379
Int.J.Curr.Microbiol.App.Sci (2019) 8(1): 1646-1658
Table.2 Distribution of SOC stocks with respect to landuse in Uttarakhand state
SOC stock (t C ha-1)
Landuse
Total Area
(ha)
0 - 10
11 - 25
26 - 50
51 - 100
101 -160
Agriculture
11203
208797
690352
206511
1041
1117904
Forest
24889
202786
413894
1541592
162687
2345847
-
4158
141117
496868
9761
651903
-
7053
24235
1395
-
32683
Grassland/Openscrub
Plantation
Habitation
25717
Rockout Crop
1340
Snow Cover
1071541
Waterbodies
101443
Total Area (ha)
36092
422794
1269597
2246367
Fig.1 Location map of Uttarakhand state
1652
173488
5348379
Int.J.Curr.Microbiol.App.Sci (2019) 8(1): 1646-1658
Calculated bulk density (g cm-3)
Fig.2 Validation of models for predicting bulk density of agriculture land use
Observed bulk density (g cm-3)
1653
Int.J.Curr.Microbiol.App.Sci (2019) 8(1): 1646-1658
Calculated bulk density (g cm-3)
Fig.3 Validation of models for predicting bulk density of forest landuse
Observed bulk density (g cm-3)
1654
Int.J.Curr.Microbiol.App.Sci (2019) 8(1): 1646-1658
Fig.4 Spatial distribution of SOC stock classes in Uttarakhand state
The crop residue removal and grazing after
the harvest and are found in concordance with
the findings of Don et al., (2011) and
Lemenih and Itanna (2004).
The majority of the forest and grassland/openscrub lies with in the mountainous region of
the state and are generally subjected to higher
risk of soil erosion due to higher degree of
slopes. However, these areas are also reported
to have higher risk of soil loss through
erosion due to higher degree of land slope and
high rainfall and are subjected to frequent
occurrences of landslides every year
(Mahapatra et al., 2018).
In conclusion, present study demonstrated the
application of random sampling for the
estimation of bulk density for estimating SOC
stocks across landscapes in mountainous
areas. The method applied is simple and
allows for reliable and robust measurements
of soil carbon stocks in different soil types
and under different land cover and land-use
systems. Furthermore, this study also
confirms that the performance of pedotransfer
function in assessment of bulk density varies
with the type of land use system.
The land use wise distribution revealed that
the forests and grasslands are the major
contributor toward the state SOC stock as
72.65% of forest area and 77.70% area under
grassland /open-scrub were found to have
SOC stock above 50 t C ha-1, while majority
of these area lies in mountainous region of
state and subjected to high risk of soil erosion.
Therefore, such area requires special attention
for management and conservation of these
SOC stocks.
1655
Int.J.Curr.Microbiol.App.Sci (2019) 8(1): 1646-1658
This study has generated the SOC stock
database and its spatial distribution in the
state which can be taken as base line
information for future monitoring of SOC
stocks.
Acknowledgement
Authors want to record their thanks to Natural
Resource Management Division, Department
of Agriculture Co-operation and Farmer’s
Welfare, Ministry of Agriculture and
Farmer’s Welfare, Govt. of India for
providing all necessary facilities and financial
support to carry out this study.
References
Abdelbaki, A.M., 2016. Evaluation of
pedotransfer functions for predicting
soil bulk density for US soils. Ain
Shams Engineering Journal. Online
published: encedirect.
com/science/article/pii/S209044791630
1745.
Benites, V.M., Machado, P.L.O.A., Fidalgo,
E.C.C., Coelho, M.R. and Madari, B.E.,
2007. Pedotransfer functions for
estimating soil bulk density from
existing soil survey reports in Brazil.
Geoderma. 139: 90–97.
Bernoux, M., Cerri, C., Arrouays, D., Jolivet,
C., and Volkoff, B. 1998. Bulk densities
of Brazilian Amazon soils related to
other soil properties. Soil Science
Society of America Journal. 62(3): 743749.
Black, C.A. 1965. Soil plant relationship. 2nd
edition Pub. NewYork., USA, pp. 515516.
Bouyoucos, G.J.1962. Hydrometer method
improved for making particle size
analysis of soils. Agronomy Journal. 54:
464-465.
Chaudhari, P.R., Ahire, D.V., Ahire, V.D.,
Chkravarty, M. and Maity, S. 2013. Soil
bulk density as related to soil texture,
organic matter content and available
total nutrients of Coimbatore soil.
International Journal of Scientific and
Research Publications. 3(2): 1-8.
Don, A., Schumacher, J., and Freibauer, A.
2011. Impact of tropical land use
change on soil organic carbon stocks–a
meta analysis. Global Change Biology.
17(4): 1658-1670.
Global Climate Report - Annual. 2017.
National Centers for Environmental
Information (NCEI). c.
noaa.gov/sotc/global/201713.
Han, G.Z., Zhang, G.L., Gong, Z.T., and
Wang,
G.F.
2012.
Pedotransfer
functions for estimating soil bulk
density in China. Soil Science. 177(3):
158-164.
Martin, M.P., Seen, D.L., Boulonne, L.,
Jolivet, C., Nair, K.M., Bourgeon, G.
and Arrouays, D. 2009. Optimizing
pedotransfer functions for estimating
soil bulk density using boosted
regression trees. Soil Science Society of
America Journal. 73 (2): 485-493.
Jackson, M.L. 1973. Soil Chemical Analysis.
Prentice Hall of India Pvt. Ltd., New
Delhi, pp. 38-56.
Jalabert, S.S.M., Martin, M.P., Renaud, J.P.,
Boulonne, L., Jolivet, C., Montanarella,
L. and Arrouays D. 2010. Estimating
forest soil bulk density using boosted
regression modelling. Soil Use and
Management. 26(4): 516-528.
Kassa, H., Dondeyne, S., Poesen, J., Frankl,
A. and Nyssen, J. 2017. Impact of
deforestation on soil fertility, soil
carbon and nitrogen stocks: the case of
the Gacheb catchment in the White Nile
Basin,
Ethiopia.
Agriculture,
Ecosystems and Environment. 247:
273-282.
Kaur, R., Kumar, S. and Gurung, H.P. 2002.
A pedo-transfer function (PTF) for
estimating soil bulk density from basic
1656
Int.J.Curr.Microbiol.App.Sci (2019) 8(1): 1646-1658
soil data and its comparison with
existing PTFs. Soil Research. 40(5):
847-858.
Kuimi, T., Vashum and Shanmuganathan, J.
2016. Soil organic carbon status and
sustainability
of
slash-and-burn
cultivation in India. Journal of
Sustainable Forestry. 35(8): 591-603.
Kumar, D., Bansal, M.L., Phogat, V.K. 2009.
Compactability in relation to texture
and organic matter content of alluvial
soils. Indian Journal of Agricultural
Research. 43(3): 180-186.
Lal, R. 2004. Soil carbon sequestration
impacts on global climate change and
food security. Science. 304: 1623-1627.
Lal, R. 2001. World cropland soils as a source
or sink for atmospheric carbon.
Advances in Agronomy. 71: 145-191.
Leifeld, J., Bassin, S., and Fuhrer, J. 2005.
Carbon stocks in Swiss agricultural
soils predicted by land-use, soil
characteristics,
and
altitude.
Agriculture,
Ecosystems
&
Environment. 105(1-2): 255-266.
Lemenih, M. and Itanna, F. 2004. Soil carbon
stocks and turnovers in various
vegetation types and arable lands along
an elevation gradient in southern
Ethiopia. Geoderma. 123(1-2): 177-188.
Lemma, B., Kleja, D.B., Nilsson, I. and
Olsson, M. 2006. Soil carbon
sequestration under different exotic tree
species in the southwestern highlands of
Ethiopia. Geoderma. 136(3-4): 886-898.
Mahapatra, S. K., Reddy, G.O., Nagdev, R.,
Yadav, R.P., Singh, S.K., and Sharda,
V.N. 2018. Assessment of soil erosion
in the fragile Himalayan ecosystem of
Uttarakhand, India using USLE and GIS
for sustainable productivity. Current
Science. 115(1): 108-121.
Martín, J.R., Álvaro-Fuentes, J., Gonzalo, J.,
Gil, C., Ramos-Miras, J.J., Corbí, J.G.,
and Boluda, R. 2016. Assessment of the
soil organic carbon stock in Spain.
Geoderma. 264: 117-125.
Morisada, K., Ono, K. and Kanomata, H.
2004. Organic carbon stock in forest
soils in Japan. Geoderma. 119(1-2): 2132.
Nanko, K., Ugawa, S., Hashimoto, S., Imaya,
A., Kobayashi, M., Sakai, H., Ishizuka,
S., Miura, S., Tanaka, N., Takahashi, M.
and Kaneko, S. 2014. A pedotransfer
function for estimating bulk density of
forest soil in Japan affected by volcanic
ash. Geoderma. 213: 36-45.
Nsabimana, D., Klemendtson, L., Kaplin,
B.A. and Wallin, G. 2008. Soil carbon
and nutrient accumulation under forest
plantations in southern Rwanda. African
Journal of Environmental Science and
Technology. 2(6): 142–149.
Poeplau, C. and Don, A. 2013. Sensitivity of
soil organic carbon stocks and fractions
to different land-use changes across
Europe. Geoderma. 192: 189-201.
Sakin, E. 2012. Organic carbon organic
matter and bulk density relationships in
arid-semi arid soils in Southeast
Anatolia region. African Journal of
Biotechnology. 11(6):1373-1377.
Sakin, E., Deliboran, A. and Tutar, E. 2011.
Bulk density of Harran plain soils in
relation to other soil properties. African
Journal of Agricultural Research. 6(7):
1750-1757.
Tomasella, J. and Hodnett, M.G. 1998.
Estimating
soil
water
retention
characteristics from limited data in
Brazilian Amazonia. Soil Science.
163(3): 190-202.
Worku, G., Bantider, A. and Temesgen, H.
2014. Effects of land use/land cover
change on some soil physical and
chemical properties in Ameleke microwatershed Gedeo and Borena Zones,
South Ethiopia. Journal of Environment
and Earth Science. 4: 13–24.
1657
Int.J.Curr.Microbiol.App.Sci (2019) 8(1): 1646-1658
Xu, L., He, N.P., Yu, G.R., Wen, D., Gao, Y.
and He, H.L. 2015. Differences in
pedotransfer functions of bulk density
lead to high uncertainty in soil organic
carbon estimation at regional scales:
Evidence from Chinese terrestrial
ecosystems. Journal of Geophysical
Research: Biogeosciences. 120(8):
1567-1575.
Yimer, F., Alemu, G. and Abdelkadir, A.
2015. Soil property variations in
relation to exclosure and open grazing
land use types in the Central Rift Valley
area of Ethiopia. Environmental
Systems Research. 4: 17.
Yimer, F., Ledin, S. and Abdelkadir, A. 2007.
Changes in soil organic carbon and total
nitrogen contents in three adjacent land
use types in the Bale Mountains, southeastern highlands of Ethiopia. Forest
Ecology and Management. 242(2-3):
337-342.
How to cite this article:
Nitin Surendra Singh Gahlod, Navneet Jaryal, Mallikarjun Roodagi, Sanjay A. Dhale, Devinder
Kumar and Ravindra Kulkarni. 2019. Soil Organic Carbon Stocks Assessment in Uttarakhand
State using Remote Sensing and GIS Technique. Int.J.Curr.Microbiol.App.Sci. 8(01): 16461658. doi: />
1658