Structure and physicochemical properties of the Aβ42 tetramer: Multiscale molecular dynamics simulations
Bạn đang xem bản rút gọn của tài liệu. Xem và tải ngay bản đầy đủ của tài liệu tại đây (4.93 MB, 17 trang )
Article
Cite This: J. Phys. Chem. B XXXX, XXX, XXX−XXX
pubs.acs.org/JPCB
Structure and Physicochemical Properties of the Aβ42 Tetramer:
Multiscale Molecular Dynamics Simulations
Hoang Linh Nguyen,†,∥ Pawel Krupa,‡ Nguyen Minh Hai,§ Huynh Quang Linh,∥ and Mai Suan Li*,‡
Downloaded via ACADEMIA SINICA on August 23, 2019 at 10:03:20 (UTC).
See for options on how to legitimately share published articles.
†
Institute for Computational Science and Technology, SBI Building, Quang Trung Software City, Tan Chanh Hiep Ward, District
12, Ho Chi Minh City 700000, Vietnam
‡
Institute of Physics Polish Academy of Sciences, Al. Lotników 32/46, 02-668 Warsaw, Poland
§
Faculty of Physics and Engineering Physics, University of Science-VNU HCM, Ho Chi Minh City 700000, Vietnam
∥
Biomedical Engineering Department, Ho Chi Minh City University of Technology-VNU HCM, 268 Ly Thuong Kiet Street, Distr.
10, Ho Chi Minh City 700000, Vietnam
S Supporting Information
*
ABSTRACT: Despite years of intensive research, little is known about oligomeric structures
present during Alzheimer’s disease (AD). Excess of amyloid beta (Aβ) peptides and their
aggregation are the basis of the amyloid cascade hypothesis, which attempts to explain the
causes of AD. Because of the intrinsically disordered nature of Aβ monomers and the high
aggregation rate of oligomers, their structures are almost impossible to resolve using
experimental methods. For this reason, we used a physics-based coarse-grained force field to
extensively search for the conformational space of the Aβ42 tetramer, which is believed to be
the smallest stable Aβ oligomer and the most toxic one. The resulting structures were
subsequently optimized, tested for stability, and compared with the proposed experimental
fibril models, using molecular dynamics simulations in two popular all-atom force fields. Our results show that the Aβ42
tetramer can form polymorphic stable structures, which may explain different pathways of Aβ aggregation. The models obtained
comprise the outer and core chains and, therefore, are significantly different from the structure of mature fibrils. We found that
interaction with water is the reason why the tetramer is more compact and less dry inside than fibrils. Physicochemical
properties of the proposed all-atom structures are consistent with the available experimental observations and theoretical
expectations. Therefore, we provide possible models for further study and design of higher order oligomers.
of senile plaques9,10 as it has higher aggregation propensity and
consequently higher toxicity.10
Aβ peptides belong to an intrinsically disordered protein
class because they do not form a stable structure in water
environment.11,12 The aggregation forms of Aβ are divided into
oligomers, protofibrils, and fibrils. Oligomers and protofibrils
are considered as intermediate aggregates with a lower mass
than the fibril and do not have a specific structure as the Aβ
fibril.13 Because Aβ peptides aggregate into fibrils to constitute
plaques, the amyloid cascade hypothesis states that Aβ fibrils
play a dominant role in AD. However, recent clinical trials have
shown that removal of plaques cannot stop AD14,15 and soluble
aggregation states of Aβ, such as oligomers, are primary toxic
species rather than mature fibrils.16,17 Soluble Aβ oligomers
also have a higher correlation with severity of AD.18,19
Moreover, experiments observed that Aβ1−42 but not Aβ1−40
oligomers form pores in lipid bilayers leading to a loss of ionic
homeostasis.20,21 In agreement with these results, Drews and
coworkers observed that the Aβ1−42 tetramer or larger
oligomers cross the neuron membrane, and calcium ions
1. INTRODUCTION
Alzheimer’s disease (AD) is the most prevalent type of
dementia among senior population.1 The pathological hallmarks of AD are characterized by extracellular senile plaques
composed of amyloid fibrils, intracellular tangles constituted by
hyperphosphorylated tau protein, neuron and synapse loss, and
progression of cognitive decline.2 Although AD has been
identified more than 100 years ago, the mechanism of AD is
still largely unknown. There are three main hypotheses
proposed to explain the mechanism of AD including the
cholinergic, tau, and amyloid cascade hypothesis.3 It has been
observed that the exaggerated aggregation of amyloid beta
(Aβ) occurs before the accumulation of the hyperphosphorylated tau protein.4−6 Based on these observations, one has
proposed the amyloid cascade hypothesis, which posits that the
extracellular deposit of Aβ is the cause of AD.
Extracellular plaques consist of Aβ peptides which are
generated from the proteolytic cleavage of amyloid precursor
protein by β- and γ-secretases.7 Aβ has many alloforms with a
length from 39 to 43 amino-acid residues. From these
alloforms, Aβ1−40 and Aβ1−42 are the most prevalent, with 40
and 42 residues, respectively.8 Although Aβ1−40 is approximately 10-fold more abundant, Aβ1−42 is the main constituent
© XXXX American Chemical Society
Received: May 3, 2019
Revised: July 31, 2019
Published: July 31, 2019
A
DOI: 10.1021/acs.jpcb.9b04208
J. Phys. Chem. B XXXX, XXX, XXX−XXX
Article
The Journal of Physical Chemistry B
enter the cell.22 Low-molecular weight oligomers (8−70 kDa)
are far more bioactive than heavier oligomers (>150 kDa).23
Because the mass of Aβ monomers is about 4 kDa, these
oligomers are from a dimer to an 18-mer. The results from
studies of Jana et al. and Ono et al. suggest that the Aβ
tetramer may be the most toxic oligomer.24,25 Thus, lowmolecular weight Aβ oligomers are the most prominent targets
to shed light on the mechanism of AD.
Because of the toxicity and the importance of self-assembly
of Aβ oligomers, the determination of the molecular structure
of these aggregation forms may allow one to understand the
mechanism of AD as well as other diseases associated with
protein misfolding.3 Although the structures of mature Aβ
fibrils are available in the literature,26−30 the structure of
soluble Aβ oligomers is still largely unknown. Experiments
show that Aβ fibrils are in the “cross-beta” structure, where Aβ
molecules assemble into β-sheets with β-strands aligned
perpendicularly to the long axis of the fibril.31 The relative
arrangements of monomers in the cross section of the fibril
lead to the polymorphic character of the Aβ fibril.31 Aβ fibrils
favor in-register parallel β-sheets except fibrils formed by the
Iowa mutation.32,33 In contrast to fibrils, experiments show
that Aβ oligomers and protofibrils are still in a disordered
structure, and the β-content generally increases with the
increase of their molecular weight.3 The oligomers can form
both antiparallel and parallel β-sheet structures.34,35 These
results suggest that oligomers and protofibrils undergo
structural rearrangement to form fibrils. However, Qiang and
coworkers observed that Aβ 1−40 protofibrils with the
antiparallel structure of the Iowa mutation are metastable
and dissociated to monomers before assembling to fibrils with
a parallel structure.33 Therefore, these reports indicate that
oligomers and protofibrils are polymorphic and that an
antiparallel structure can be off-pathway to fibril formation.
As experiments only determine a general characteristic of
oligomer structures, the molecular dynamics (MD) technique
is a tool that can provide key insights into the structure of
oligomers. Simulations using replica exchange and classical
MD for Aβ monomers, dimers, and their mutants are usually
consistent with the experimental data.36−48 However, simulations for higher weight Aβ oligomers are difficult to conduct
because of the very large number of degrees of freedom and
the fact that initial structures can bias toward specific
conformations. Brown and coworkers simulated the Aβ42
tetramer and its interactions with the lipid membrane.49
However, conventional MD was used for these studies, which
may not be efficient enough to provide good sampling and
therefore can lead to artificially overstabilized conformations.
Furthermore, the conventional MD was also used to
investigate the aggregation processes of Aβ monomers.50−52
The structure of truncated Aβ oligomers have been simulated
using replica exchange MDs (REMD).53,54
Motivated by results about toxicity of Aβ1−42 oligomers and
the importance of their structures in the self-assembly
process,24,25 in this work, we performed coarse-grained
REMD and all-atom MD simulations for the Aβ1−42 tetramer,
one of the most toxic oligomers.24 Because the system
possesses large conformational varieties due to the presence
of four flexible chains, we used the coarse-grained united
residue (UNRES)55−58 force field to reduce the computational
cost and improve the sampling. The UNRES model allows one
to simulate protein systems with an effective timescale of
simulation of 3−4 orders of magnitude larger than all-atom
methods. By using this model, we can simulate the tetramer at
a significantly longer timescale and a wider temperature range
than all-atom models but not requiring massive parallel
computations. In the second step, classical all-atom MD
simulations were used to assess the stability and refine the
reconstructed coarse-grained models. Our results show that the
Aβ tetramer is dominated by coil structures in an oblate
spheroid shape. The different energies of the tetramer and fibril
suggest a radical change in the structure of the oligomer to
form the fibril, which is strictly connected to changing the
three-dimensional structure of the small oligomer to the quasione-dimensional fibril. The solute−solvent interaction is
responsible for the difference between oligomer and fibril
structures.
The question of existence of water inside Aβ fibrils is under
debate. Early experiments did not observe water molecules
buried in the fibril core,59 but more recent solid-state NMR
experiments have provided evidence for their presence.60,61
This result was also confirmed by all-atom MD simulation62
using fibril structures which were resolved by the experiment
and designed by the computer. The question of the difference
between the distributions of water molecules in Aβ oligomers
and fibrils remains open. In addition, because the water leakage
may play a decisive role in neurotoxicity and oligomers are
presumably more toxic than mature fibrils, we will consider this
problem for the tetramer case.
The structures of Aβ1−42 obtained in this work can also be
used as initial conformations to build higher oligomers and in
further studies of the amyloid aggregation process. Because in
this study, the full-length structure of Aβ1−42 was used, it will
be called Aβ42 throughout the manuscript, instead of Aβ1−42,
for clarity.
2. MATERIALS AND METHODS
2.1. Generation of Initial Structures. To enhance the
sampling of configuration space, we used various structures as
the initial conformations for the UNRES REMD simulation.
They were obtained using ClusPro 2.0 webserver (https://
cluspro.bu.edu/), which is designed for protein−protein
docking with high reliable results,63 with the default scoring
function used for docking simulations.64 In the first step, 24
trimeric structures were obtained from the docking simulations
using nine monomers taken from the study of Yang and
Teplow,36 and the dimer was taken from the study of Zhang et
al.40 In the second step, 24 trimeric structures obtained from
docking and nine monomeric structures from the study of
Yang and Teplow36 were used to generate Aβ42 tetramers,
from which 24 lowest energy structures of tetramers out of 216
generated and were used as initial structures in REMD
simulation (Figure S1 in the Supporting Information) with 24
replicas.
Root-mean-square deviation (rmsd) of the docked structures
was in the range from 9 to 24 Å from model 1 providing
satisfactory diversity of initial models. The rmsd of the initial
structures shows that these conformations are distinct and that
they are located in very different points of the phase space. The
initial tetrameric structures are dominated by statistical coil
(Table 1), indicating that these structures are in unordered
conformations. The helix propensity is rich and higher than the
beta content (Table 1).
2.2. UNRES Coarse-Grained Model. In the UNRES
model, the polypeptide chain is represented by a sequence of
α-carbons (Cα’s) linked by virtual bonds with attached united
B
DOI: 10.1021/acs.jpcb.9b04208
J. Phys. Chem. B XXXX, XXX, XXX−XXX
Article
The Journal of Physical Chemistry B
structures, which were used as initial conformations for allatom simulations (Figure 1).
Table 1. Secondary Structure Content (%) of the Initial
Structures Used for the REMD Simulation and the
Structures from Two Periods of the REMD Run: 200−800
and 200−2000 ns at 296 K
structure
initial
200−800 ns
200−2000 ns
β
α
coil + turn
10.6 ± 2.1
20.0 ± 2.8
69.4 ± 6.5
19.5 ± 1.4
3.6 ± 1.1
76.9 ± 4.5
18.5 ± 2.7
2.7 ± 1.1
78.8 ± 7.1
side chains (SCs) and united peptide groups (p’s) located in
the middle between the consecutive α-carbons.65 The united
peptide groups and united side chains serve as interaction sites,
while α-carbons assist the definition of geometry.55 UNRES is
a physics-based force field, in which most of the potentials of
mean force were obtained not by statistical analysis of the pdb
database but by ab initio and semiempirical calculations.66 The
newest version of the UNRES force field, optimized for protein
structure folding67 with periodic boundary conditions,68
included in the UNRES package (), was used
to perform REMD simulation. Because the UNRES force field
does not require any structural restraints in simulations, it can
be used to study large conformational changes, such as protein
folding and assembly of protein complexes.69 The UNRES
force field was found to be able to predict structures of the
small and average-size proteins with good quality70 and
accurate enough to predict correctly structures and melting
temperatures of the fibril-like protein with single amino-acid
residue substitutions,71 while older versions of the UNRES
force field were successfully used to study the Aβ aggregation
process.72,73
2.3. Replica Exchange Method. In this paper, 24 replicas
with temperatures from 292 to 462 K were used. Each
trajectory consisted 409 000 000 steps, each of 0.1 molecular
time unit56 (4.89 fs, which is a natural time unit if energy is
expressed in kcal/mol, mass in g/mol, and distance in Å),
providing 2000 ns. Replica exchanges were attempted every
1000 steps, and snapshots and other information were saved
every 1000 steps. The dimensions of the cubic periodic box
were set to 20 × 20 × 20 nm, which allows four Aβ42 chains to
dissociate and associate during simulations to limit the bias
coming from the initial structure but do not slow down the
simulation due to the long binding time, resulting in Aβ42
concentration of 830 μM, which is higher than in the brain.74
Simplification of the protein representation in coarse-grained
models is the reason of smoothing the free energy landscape
what leads to a much faster rate of observed phenomena
comparing to all-atom methods.75 Therefore, 1 ns of UNRES
time corresponds to approximately 1−10 μs of real time.56
However, for clarity, UNRES time is used in the rest of the
manuscript. Twenty four tetramer structures obtained from
docking were used for initial conformations (Figure S1) in
REMD runs. The structures were sorted from the lowest
docking energy to the highest which corresponded to the
lowest and the highest temperature replicas.
2.4. Weighted Histogram Analysis Method. The
weighted histogram analysis method (WHAM)76 method,
implemented in the UNRES package, was used to obtain
structures of the Aβ42 tetramer at distinct temperatures77 from
the last 1800 ns of the REMD simulation. Subsequently, the
tetramer structure ensemble corresponding to 295 K was
clustered using Ward’s minimum variance method78 with rmsd
cutoff between clusters set to 10 Å, to get representative
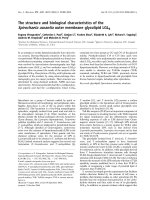
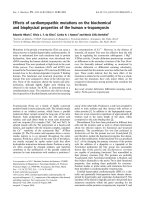
Figure 1. Cartoon representations of the reconstructed representative
structures for five clusters obtained from UNRES REMD simulation.
Cyan balls represent the N-termini, and orange balls represent the Ctermini.
2.5. All-Atom MD Simulation. To investigate the stability
of representative Aβ42 tetramer conformations, obtained in the
coarse-grained REMD simulation, we analyzed these structures
in all-atom force fields with the explicit solvent model. The
MD simulations were carried out by the GROMACS 2016
package.79 The leaf-frog algorithm was used to integrate the
equations of motion with a time step of 2 fs. A cutoff of 1.0 nm
was applied to electrostatic and van der Waals (vdW) forces,
and the particle mesh Ewald method was used to calculate the
long-range electrostatic interactions.80 The covalent bonds
were constrained by the LINCS algorithm.81 Because the
structures obtained from REMD simulation are coarse-grained
conformations, pulchra software was used to reconstruct allatom conformations from UNRES model structures.82
Subsequently, the scwrl4 program was used to optimize side
chains in the obtained all-atom models.83 Then, MD
simulations were run for these optimized structures with two
setups: the tetramer is parameterized by AMBER99SB-ILDN84
and OPLS-AA/L85 force fields and then solvated in a cubic box
by TIP3P86 and TIP4P86 water models, respectively. The
simulation study suggests that these force fields provide the
agreement between the secondary structure of the Aβ42 dimer
and CD data.87 The OPLS-AA/L force field produced results
for monomer Aβ40 that agree with experimental data.88
Furthermore, AMBER99SB-ILDN shows that this force field
can successfully reproduce NMR results of Aβ40.89,90 To
neutralize the charge of the systems, 12 Na+ counter ions were
added. The systems were minimized by the steepest descent
algorithm and equilibrated for 500 ps in the NVT ensemble at
300 K kept by the v-rescale algorithm91 followed by 10 ns in
the NPT ensemble at 300 K and 1 bar. Finally, the production
MD simulations were performed for 200 ns at constant
temperature and pressure conditions. For each representative
structure from REMD, five independent MD trajectories were
conducted.
The equilibrium procedure for four chains extracted from
the Aβ42 fibril structure (PDB code 2NAO27) was the same as
C
DOI: 10.1021/acs.jpcb.9b04208
J. Phys. Chem. B XXXX, XXX, XXX−XXX
Article
The Journal of Physical Chemistry B
for our tetrameric models. Then, five independent trajectories
of production MD simulations were carried out for 20 ns with
restraints placed on Cα atoms with a spring constant of 1000
kJ/mol/nm to preserve the fibril structure and allow water
molecules to equilibrate and properly solvate the system.
Simulations were run at the constant temperature and pressure
conditions, and snapshots from last 10 ns were used for data
analysis.
2.6. Tools for Data Analysis. 2.6.1. rmsd and RMSF.
Structural changes and dynamics of the Aβ42 tetramer were
studied using the rmsd and root-mean-square fluctuations
(RMSF). The initial conformations from MD runs were used
as references to calculate both rmsd and RMSF. The
fluctuation of the atom j is given by the following equation
tetramer from canonical MD simulations, using the GROMACS algorithm96 with a cutoff of 2.5 Å.
2.6.9. Eccentricity. The protein was fitted in the ellipsoid
centered at the center of mass with semiaxes a, b, and c. When
c < a, the ellipsoid is called oblate spheroid and prolate
spheroid when c > a. The eccentricity is calculated as
e=
1
∑ (ri ,j − r0,j)2
n i=1
c2
a2
when c < a and e =
1−
a2
c2
when c > a. The
semiaxes are calculated from moments of inertia I1, I2, and I3
using the following equations
2
2
m(b2 + c 2), I2 = m(c 2 + a 2), and I3
5
5
2
= m (a 2 + b 2 )
5
I1 =
n
RMSFj =
1−
Here, the mass of the tetramer is m = 18.024 kDa. The three
moments of inertia are calculated by diagonalizing the inertial
tensor using the gmx principal tool from the GROMACS
package.
2.6.10. Height of Tetramer. Based on the moments of
inertia I1, I2, and I3, we calculated a, b, and c semiaxes from the
5
5
equations: a 2 = 4m (I2 + I3 − I1), b2 = 4m (I1 + I3 − I2), and
(1)
where n is the number of analyzed snapshots, ri,j is the position
of atom j in snapshot i, and r0,j is the position of atom j in the
initial structure.
2.6.2. Secondary Structures. The STRIDE algorithm92 was
used to calculate the propensity of secondary structures of the
tetramer. Based on both dihedral angles and hydrogen bond, it
is less sensitive to imperfections resulting from conversion of
coarse-grained models to all-atom structures.
2.6.3. Interchain Contacts and Oligomer Size. Interchain
contacts were examined by calculating the distance between
side chain centers of mass of two residues from different
monomers, and the contact was detected if it was less than 6.5
Å. To determine the size of the oligomer, we used the criterion
that two chains are considered as part of an oligomer if they
have at least five interchain contacts, which allows to exclude
contribution of the weak interactions between chains due to
their accidental proximity during simulations. The structures
from coarse-grained REMD simulation are used to assess
number of interchain contacts.
2.6.4. Hydropathy. We used the hydropathy indexes from
the study of Kyte and Doolittle.93 The total hydropathy is the
total value of hydropathy of residues which form contacts. In
this work, if one residue forms multiple contacts, its
hydropathy contribution is proportional to the number of
contacts.
2.6.5. Residues Binding New Chains to Dimer and Trimer
to Form Tetramer. When the tetramer is formed from smaller
oligomers as two interacting dimers or trimer interacting with
the monomer, the residues of different oligomers forming
interchain contacts are calculated. Then, the population of
contacts is obtained from the ratio between the number of
contacts of these residues and the number of tetramer
formations from different structures.
2.6.6. Radial Distribution. The distances between the
charged atoms and the center of mass of the oligomer are
calculated and histogrammed.
2.6.7. Water Molecules Located inside the Oligomer. To
calculate the number of water molecules in the oligomer, the
quickhull algorithm was utilized to construct the convex hull of
the oligomer.94 Then, the concave hull of the oligomer was
generated using the algorithm proposed by Park and Oh with a
threshold of 5.95 Finally, water molecules which are inside the
concave hull are counted as internal water molecules.
2.6.8. Clustering. The gmx cluster tool from the
GROMACS package was used to cluster structures of the
5
c 2 = 4m (I1 + I2 − I3). The height of the tetramer is the
smallest half-axis multiplied by 2.
2.6.11. Transition Network. Based on the idea of the
transition network from previous studies,51,52,97,98 we constructed the transition network as follows. The state of the
oligomer in all-atom simulations was defined as a combination
of two numbers: shape index of the oligomer (ratio between
the lowest and the highest moment of inertia, Imin/Imax,
multiplied by 10 and rounded to the nearest integer) and the
number of interchain contacts, while in the REMD coarsegrained simulation, the oligomer size was used as an additional
property. For all-atom simulations, the transition matrix was
calculated from all equilibrated parts of the MD trajectories,
whereas for the coarse-grained simulation, whole 24
trajectories were used. First, N states of the oligomer were
determined in the simulations. Then, the N × N matrix was
constructed, in which the value at i row and j column is the
population of transition from state i to j. The data in the rows
of the transition matrix were normalized. On the transition
graph, the color of the nodes represents the state index, and
the color of the edges represents the transition between two
states with a nonzero population. The node area and the edge
thickness correspond to the population of the state and the
transition probability between two states, respectively. The
Gephi visualization and exploration software were used to
visualize the transition network, and the node distribution was
optimized using the Force Atlas algorithm.99
2.6.12. Collision Cross Section. Ion mobility of the Aβ42
systems was estimated by theoretical calculations of collision
cross-section (CCS) values using the trajectory method (TM)
implemented in the Mobcal software100,101 for representative
structures of dominant clusters from all-atom MD simulations.
In the TM model, instead of using hard core radius, other
effects such as ion-induced interactions are included. While
theoretical CCS values are difficult to interpret independently,
they are very useful for the comparison with the experimental
observations.102
2.6.13. Hydrophobic Solvent Accessible Surface Area. The
tool gmx sasa from the GROMACS package was used to
D
DOI: 10.1021/acs.jpcb.9b04208
J. Phys. Chem. B XXXX, XXX, XXX−XXX
Article
The Journal of Physical Chemistry B
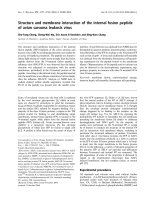
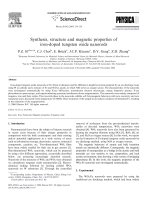
Figure 2. Electrostatic and vdW energy components (kcal/mol) for intermolecular (intermolecular interaction energies between chains of
tetrameric structures) and solute−solvent interactions (intermolecular interaction energies between tetrameric structures and water and ions). For
2NAO, the result was averaged over snapshots for the last 10−20 ns period of MD simulations, whereas for five representative structures for each of
the five trajectories (25 structures in total). Error bars represent standard deviations.
2000 ns, which were subsequently used for WHAM and
clustering analysis. The heat capacity (Cv) obtained from the
WHAM analysis (Figure S4) is virtually identical for these two
time windows, which means that we have at least reached
quasi-equilibrium. In addition, the secondary structures of
reconstructed all-atom representative structures from both
time windows are similar (Table 1), providing additional
support for this conclusion. Therefore, only the 200−2000 ns
time window was used in further analysis.
Note that the heat capacity has a peak at T = 297 K (Figure
S4), which indicates the dissociation temperature of the
tetramer. A similar result was obtained for the dimer of the
acshorter Aβ peptide.105
3.2. Tetramer Structure from REMD Simulation. At
295.6 K, the converged part of the simulation was used for
clustering to obtain five groups of structures, from which
cluster centroids were selected as representative models
(Figure 1). Clustering criteria provided low diversity within
clusters (rmsd below 1.5 Å) with large diversities between
clusters (rmsd in range 6.2−12.0 Å). These models will be
used in all-atom simulation. Clusters 1, 2, 3, 4, and 5 constitute
33.4, 24.7, 16.9, 15.0, and 10.0% of all structures, respectively.
The low propensity of beta strands in tetrameric structures
from REMD simulations (Table 1) shows that they are still in
a disordered state. The short beta strand in monomers form
the parallel beta sheet (Figure 1), but this structure is still
different from fibril structures of Aβ,26,27 in which monomers
form a “cross-beta” structure. There are multiple suggested
structures of Aβ oligomers (e.g., barrel-like); however, most of
them are constructed using truncated parts of Aβ,106−108 and
there is no experimental evidence that such conformations can
be present in nature for a full sequence of Aβ42. The all-atom
calculate hydrophobic solvent accessible surface area
(hSASA).103 In this work, residues treated as hydrophobic
are as follows: glycine (Gly), alanine (Ala), valine (Val),
leucine (Leu), isoleucine (Ile), proline (Pro), phenylalanine
(Phe), methionine (Met), and tryptophan (Trp).
2.6.14. Dipole Moment. Dipole moment of the system μ⃗ is
defined as follows
N
μ⃗ =
∑ qi→ri
i=1
where qi and r⃗i are charge and position vectors of atom i, and N
is the total number of atoms.
3. RESULTS AND DISCUSSION
3.1. Convergence of Coarse-Grained Simulations.
Coarse-grained simulation was performed using the REMD
method starting from 20 different orientations of chains to
enhance sampling. The acceptance ratio between replicas was
above 31% between any pair of neighboring replicas providing
good exchanges between temperatures. This is also evident
from the random work in the replica space (Figure S2),
showing that the exchange occurred between any pair of
neighbored replicas.
Cα-rmsd at 296 K (Figure S3) shows that the system is
stable from approximately 200 ns, so the first 200 ns was
discarded in further analysis. However, based on rmsd, we
cannot be sure of achieving equilibrium because in REMD
simulations, chains can switch places and conformations in the
oligomer,42,104 making the rmsd definition ambiguous. Therefore, to examine if the simulation converged, the trajectory at
296 K was split into two time windows, 200−1100 and 200−
E
DOI: 10.1021/acs.jpcb.9b04208
J. Phys. Chem. B XXXX, XXX, XXX−XXX
Article
The Journal of Physical Chemistry B
Table 2. Secondary Structure Content (%) Averaged over the Snapshots Collected from 100−200 ns Period of all MD
Simulations for five Representative Structuresa
structure
force field
beta
AMBER
OPLS
AMBER
OPLS
AMBER
OPLS
AMBER
OPLS
helix
turn
coil
cluster 1
16.8
21.9
4.7
3.2
35.9
41.5
42.6
33.4
±
±
±
±
±
±
±
±
1.9
2.4
0.7
0.9
2.1
2.4
2.2
2.3
cluster 2
18.2
21.0
2.4
2.0
41.4
39.3
38.0
37.7
±
±
±
±
±
±
±
±
cluster 3
1.8
2.1
0.5
0.6
2.1
2.3
1.9
2.1
21.1
19.8
1.0
0.5
37.1
43.2
40.8
36.5
±
±
±
±
±
±
±
±
1.9
1.9
0.2
0.1
1.9
2.0
1.9
2.0
cluster 4
19.3
12.7
1.1
1.1
36.8
40.0
42.8
46.2
±
±
±
±
±
±
±
±
2.2
1.7
0.3
0.3
2.2
2.4
2.1
2.2
cluster 5
21.9
20.3
2.0
0.2
40.2
38.4
35.9
41.1
±
±
±
±
±
±
±
±
2.1
2.2
0.3
0.0
2.2
2.2
2.1
2.4
2NAO
40.0
34.7
0.0
0.0
26.7
30.0
33.3
35.3
±
±
±
±
±
±
±
±
1.1
0.8
0.0
0.0
0.8
1.7
1.0
1.0
a
For 2NAO, the results were obtained using snapshots collected for 10−20 ns period of MD simulation. Error bars represent standard deviations.
structures of the five clusters in the PDB file format are
attached in the Supporting Information.
3.3. Distribution of Interchain Contacts and
Oligomers in UNRES. We calculated the number of side
chain contacts between chains in the oligomer. The histograms
of interchain contacts (Figure S5) show that the interactions
between different pairs differ significantly from each other. The
population of interchain contacts between chains A and B is
the smallest, and at temperatures around 300 K, the average
number of contacts is 5. Therefore, in this work, we used five
contacts as the criterion to determine whether two chains are
in the same oligomer or not. Using this criterion we obtained
the distribution of oligomer size showing that at high
temperatures, the tetramer decomposes into monomers,
dimersm and trimers due to the significant populations of
these molecules at high-temperature replicas (results not
shown). At lower temperatures, the monomers cannot
decompose leading to the stable structure of the tetramer.
This result shows that the Aβ42 tetrameric structures are
formed by two processes: addition of the monomer to the
seeds at high temperature and the structural rearrangement at
low temperature replicas. These processes eliminate any bias
coming from the initial structures from docking as well as
speed up the tetramer formation because the distance between
the monomers is small enough.
3.4. All-Atom Simulations. In the next step, conventional
all-atom MD simulations were performed at 300 K with
AMBER99SB-ILDN and OPLS-AA/L force fields using
reconstructed coarse-grained models (Figure 1) as the initial
conformations. All MD trajectories are stable from about 100
ns (Figure S6), so snapshots from 100−200 ns range were used
for clustering and further analysis.
To compare the obtained tetrameric structures with the
more organized fibril-like structure, four chains from the Aβ42
fibril (PDB code: 2NAO27) were extracted and used to
perform five MD trajectories of 20 ns in two all-atom force
fields. Because Cα atoms were restrained, rmsd with respect to
the 2NAO structure is small (about 0.47−0.61 Å).
3.5. Representative Structures in All-Atom Simulations. Similar to coarse-grained simulations, five representative
structures were obtained, which are cluster centroids of the
largest clusters from all trajectories starting from coarsegrained models (Figures S7). In total, we have 50
representative structures for Amber and OPLS force fields.
By clustering the snapshots obtained in the last 10 ns of the
simulation which started with the 2NAO PDB structure, we
obtained the two most populated structures for these force
fields (Figure S7).
3.6. Analysis of the Energy Components. The
intermolecular interaction energy was calculated for the
representative structures of the first clusters from MD
trajectories (Figure S7) starting from coarse-grained models
and compared to the analogous simulations starting from the
tetrameric structure from the 2NAO pdb file (Figure S7). In
the case of 2NAO, the impact of the force field on the energy is
strong (Figure 2). The electrostatic component is positive in
both force fields AMBER99SB-ILDN and OPLS-AA/L, and
their values in these force fields are substantially different. In
the AMBER force field, UNRES cluster 2 has a slightly higher
electrostatic energy compared to 2NAO leading to the fact that
its total interaction energy exceeds other clusters (Figure 2).
All clusters, in particular cluster 3, have less energy than
2NAO. Therefore, in terms of the solute energy, representative
compact structures, obtained by UNRES and all-atom
simulations, are more favorable than fibril-like structure 2NAO.
In the OPLS-AA/L force field, cluster 1 has equivalent
energy with 2NAO within the error range. Similar to the
AMBER force field, cluster 2 has higher electrostatic energy
than 2NAO, while others have lower energy than 2NAO
(Figure 2).
In the case of electrostatic energy, the difference between the
clusters is significant in both force fields (Figure 2). The
electrostatic energy of 2NAO and our tetramer structures in
the OPLS-AA/L force field is lower than in AMBER99SBILDN. The difference in electrostatic energy between the
clusters indicates that the structures of the tetramer are
polymorphic because electrostatic energy is sensitive to
conformation. In terms of vdW energy, the difference between
the UNRES clusters is insignificant. Except cluster 1, this
energy component in OPLS-AA/L is lower than in
AMBER99SB-ILDN, suggesting a denser tetramer package
than in the AMBER99SB-ILDN force field. This situation is
similar to the case of 2NAO, where the vdW energy in OPLSAA/L is lower than in AMBER99SB-ILDN.
In all our tetrameric structures and structures of 2NAO, the
vdW component prevails in the nonbonded energy, and it is
significantly larger than the electrostatic component (Figure
2). Furthermore, the difference between the nonbonded
molecular interaction energies of 2NAO and our tetrameric
structures is very sensitive to the structure indicating that the
potential barrier for conversion of our tetramer to fibril is
significantly diverse. This result suggests the existence of
multiple oligomerization pathways and that the tetramer can
easily form fibrils or must rearrange the conformation or favor
the oligomer state due to the strong nonbonded interaction
energy.
F
DOI: 10.1021/acs.jpcb.9b04208
J. Phys. Chem. B XXXX, XXX, XXX−XXX
Article
The Journal of Physical Chemistry B
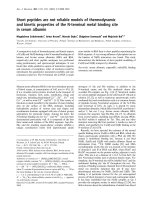
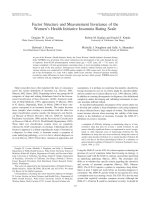
Figure 3. Distribution of average secondary structures calculated using all snapshots from 100−200 ns period of all-atom MD simulations.
structure is rarely observed in the N-terminus and 20−30
residue range, with insignificant population.
The secondary structures, obtained for each chain in MD
simulations, show the difference between two force fields
(Table S1). In AMBER99SB-ILDN, four chains have
equivalent beta propensity in clusters 3 and 4 within the
error range. The distribution of secondary structures for each
chain (Figure S8) is distinct from others, especially turn and
coil structures. In OPLS-AA, the chains have various average
beta populations, and other secondary structure propensities of
residues are also different (data not shown), similar to the
AMBER99SB-ILDN force field. These results indicate a
distinct character of the chains in the oligomeric tetramer as
it differs from fibril structures, in which properties of chains are
homogenous. The difference may be due to the different
exposition of the chains to the solvent in the tetrameric
structures.
3.8. Chains Display Different Flexibilities. In coarsegrained simulations, the RMSF of the chains in the tetramer
(Figure S9) shows that in chains 2, 3, and 4, the N-terminus
and region 20−30 are more flexible than 10−20 and 30−40
regions. In the case of chain 1, the N- and C-terminal residues
are more flexible than others. In all-atom simulations (Figure
S10), regions 20−30 and C-terminus are more flexible than
other domains. In case of chain 2 and 3, regions 10−20 and Cterminus are more flexible than other regions in the
AMBER99SB-ILDN force field (Figure S10). However, in
OPLS, the difference is not that pronounced as in the
AMBER99SB-ILDN force field. The region close to the Cterminus is significantly more flexible in OPLS (Figure S10).
These results show the different impact of force fields on
dynamics of the amino-acid residues.
3.9. Shape of Aβ42 Tetramer. To determine the
compactness of the Aβ42 tetrameric structure, we calculated
RIthe ratio of the smallest component of the moment of
inertia and the largest one for the structures in the equilibrated
part of MD trajectories. This quantity is similar to parameter
N4 used by Barz et al52 For direct comparison with results of
Barz et al.52 RI is multiplied by 10 and rounded to the nearest
integer. The tetramer conformation is called “compact” when
RI is larger than 5 and “extended” with the ratio less or equal to
5. The population of “compact” and “extended” conformations
of the Aβ42 tetramer from two force fields is similar. In both
force fields, the tetramer favors the “compact” structure;
however, OPLS-AA/L preserves “compact” conformation
stronger than AMBER99SB-ILDN.
On the other hand, the tetrameric Aβ42 interaction with a
solvent is approximately an order of magnitude higher than the
internal energy of the tetramer (Figure 2). These interactions
are dominated by the electrostatic component, which suggests
that oligomers tend to form a hydrophobic core. In OPLS, the
nonbonded interaction energy between our models and the
solvent is lower than that of 2NAO solvent, implying that the
extended fibril structure is less favorable.
3.7. Secondary Structures of Representative Structures. The secondary structure content of representative
structures of the five clusters from all-atom simulation (Table
2) shows that in both force fields, tetrameric Aβ42 is
dominated by turn and coil, indicating the disordered state,
which is consistent with experimental observations.3 The
percentage of beta structures in both force fields is equivalent
to REMD simulation (Table 1). However, the beta propensity
of REMD cluster 1 in the OPLS-AA/L force field is higher
than AMBER99SB-ILDN, but cluster 4 has lower beta in
OPLS-AA/L. The beta population of other clusters in both
force fields is equivalent (Table 2). With the exception of
cluster 1, in MD simulations, the helix structure is lower than
in REMD, and in both cases, the propensities are low (Tables
1 and 2). For 2NAO, the beta content is about 40 and 35% in
Amber and OPLS, respectively (Table 2), and these values, as
expected, are higher than those of the five REMD clusters. The
helix structure did not occur in 2NAO, while the turn is lower
than the coil, but they vary between 27 and 33% depending on
the force fields.
The distribution of secondary structures of the Aβ42
tetramer (Figure 3) is similar in both force fields. The beta
structure concentrates in residues 9−14, 17−21, and 30−40
are in agreement with experimental data on the Aβ40 oligomer
(regions 7−12, 17−26, and 30−39).109 The region of 11−21
residues has the highest beta propensity (Figure 3) which is
consistent with simulation results of Brown and Bevan
(residues 17−21).49 The C-terminus has a lower beta
propensity than these residues, and it is slightly higher in
OPLS-AA/L than in the AMBER99SB-ILDN force field (17.7
and 14.2%, respectively). The concentration of the beta
structure in the residues 11−21 and the C-terminus is also in
agreement with previously theoretical studies of the Aβ42
monomer39,110,111 and experimental data of the Aβ42
fibril.27,28 However, the average level of beta is lower than
that of oligomers (44%),112 but this result is reasonable
because oligomers studied by studied by Ahmed et al.,112 have
more chains than tetramers. On the other hand, the obtained
beta content is lower than in monomers.113 The short α-helix
G
DOI: 10.1021/acs.jpcb.9b04208
J. Phys. Chem. B XXXX, XXX, XXX−XXX
Article
The Journal of Physical Chemistry B
force fields is small, indicating that the shape of the tetramer in
both force fields is the same that is consistent with eccentricity
results. In general, the structures in AMBER99SB-ILDN are
slightly less compact; therefore, their eccentricity and CCSs are
slightly higher than in the OPLS force field. Our values (Table
4) are lower than experimental data of Bernstein et al.115 which
is 2332 Å2. However, the CCSs are consistent with the result
from Zheng et al.116 Using the TM, Barz and coworkers
obtained 2109 ± 3 and 1978 ± 9 Å2 for CCS of Aβ42 from
MD simulation with implicit solvent which is not far from our
results.52 This result also indicates that the Aβ42 tetramer is in
disc-like conformation because the CCS values are equivalent
to packed model in Bernstein et al., which is 2135 Å2.115
Overall, in terms of CCS, cluster 3 agrees with the
experiment115 better than other models. The CCS value for
2NAO is significantly higher than any experimental and
computational values, confirming our conclusion that the fibril
is less compact than oligomers. However, it should be noted
that CCSs values are just rough estimated, subjected to
uncertainty of the prediction tool, and they do not take into
account the ionization and gas phase, respectively, for
theoretical and experimental methods.
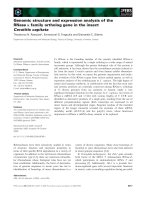
3.11. Hydrophobic Solvent Accessible Surface Area.
The solvent accessible surface area for hydrophobic residues
was calculated for the equilibrated part of the MD trajectories
(Figure 4). The average hSASA values in the OPLS-AA/L
In the study of Barz et al.,52 the Aβ42 tetramer structures
exist in extended conformation or compact conformation
which have a prolate or oblate spheroid shape, respectively. For
more detailed information on the shape of the Aβ42 tetramer,
the eccentricity of structures obtained from MD simulation
was calculated. The semiaxes show that the structures are in
the oblate spheroid state (c < a); the eccentricity values (Table
3) indicate that the tetramer structures are in the disc-like
Table 3. Eccentricity of Aβ42 Calculated Using the
Snapshots from 100−200 ns Period of all MD Simulationsa
REMD cluster
AMBER99SB-ILDN
1
2
3
4
5
2NAO
0.67
0.75
0.82
0.73
0.71
0.98
±
±
±
±
±
±
0.07
0.09
0.05
0.06
0.08
0.01
OPLS-AA/L
0.59
0.68
0.71
0.67
0.67
0.98
±
±
±
±
±
±
0.05
0.05
0.07
0.07
0.05
0.01
a
For 2NAO, we used the snapshots from the 10−20 ns period of
simulation.
state, which is consistent with Aβ42 oligomers described by the
experiment of Ahmed et al.112 Brown and Bevan49 also
obtained an oblate spheroid in all-atom simulations, in which
ratio RI is 6, and the eccentricity is 0.79 ± 0.03. The oblate
spheroid state of the Aβ42 tetramer in this work is also
consistent with the Aβ18−41 tetramer structure from Streltsov et
al.114 in which the eccentricity value is ∼0.8 (c < a). However,
using mass spectrometry, being an in vacuo technique,
Bernstein and coworkers115 found that the Aβ42 tetramer
comprises two dimer subunits making an angle of 120° a
planar plane. The effect of the solvent may be responsible for
the difference between our results and Bernstein et al.115
We have calculated the height of oligomers and 2NAO using
the definition given in Materials and Methods and snapshots
collected from the 100−200 and 10−20 ns period of all-atom
MD simulations for five clusters and 2NAO, respectively. The
height of the tetramer models was in the range of 2.0−2.2 nm,
in contrast to the 0.98−1.0 for four chains of 2NAO. Our
result is in agreement with Ahmed et al.112 who reported that
the height of oligomers of different sizes varies from ≈2 to 5
nm.
3.10. Collison Cross Section of Tetrameric Aβ42. The
results of CCSs of the Aβ42 tetramer (Table 4) show that all
REMD clusters have similar cross-section values within error
ranges, except cluster 3. The difference between two all-atom
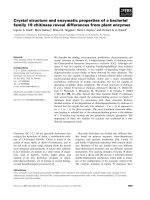
Figure 4. hSASA of the Aβ42 tetramer calculated using all snapshots
from the 100−200 ns period of all-atom MD simulations.
force field are smaller than in AMBER99SB-ILDN (Table 5),
which is consistent with the result of compact conformation
population in force fields. The areas in the OPLS-AA/L force
field are also smaller than results from Barz et al.52 (4833 and
5027 Å2) and Brown and Bevan49 (∼5400 Å2). In the case of
the AMBER99SB-ILDN force field, clusters 2 and 3 have
consistent values with the compact structure (4833 Å2) and
extended structure (5027 Å2) from Barz et al.,52 respectively.
As shown above, our tetrameric structures favor a compact
state.
Although our cluster 3 is compact, its hSASA is close to that
of the extended structure reported earlier.52 This can come
from the solvent model, which is an implicit solvent in the
previous study,52 while we used an explicit solvent. This is also
supported by the result obtained for hSASA of the compact
structure with an explicit solvent,49 which is close to the value
of cluster 3. The hSASA values of other clusters in the
AMBER99SB-ILDN force field are smaller than results from
Table 4. CCSs for Aβ42 Tetramer Clusters Calculated Using
Snapshots Collected from the 100−200 ns Period of AllAtom MD Simulationsa
collision cross section (Å2)
AMBER99SB-ILDN
UNRES cluster
2NAO
1
2
3
4
5
2029.6
2084.7
2159.1
2034.2
2038.2
2649.1
±
±
±
±
±
±
48.6
60.4
86.2
44.8
62.7
46.4
OPLS-AA/L
1946.6
2009.2
1988.8
1997.8
2002.1
2656.4
±
±
±
±
±
±
27.4
46.7
37.9
35.7
42.4
36.0
a
Result for 2NAO was obtained using snapshots from the 10−20 ns
period.
H
DOI: 10.1021/acs.jpcb.9b04208
J. Phys. Chem. B XXXX, XXX, XXX−XXX
Article
The Journal of Physical Chemistry B
Table 5. hSASA of the Aβ42 Tetramer, Total Hydropathy Index93 of the Residues That Have Interchain Contacts, and Number
of Water Molecules in the Polyhedrons Built From Tetramer Structuresa
hSASA (Å2)
UNRES
cluster
1
2
3
4
5
2NAO
AMBER99SB-ILDN
4074.9
4530.7
5117.3
4117.1
4280.8
5355.1
±
±
±
±
±
±
88.7
183.2
190.8
247.8
172.9
34.9
total hydropathy
OPLS-AA/L
3516.5
3899.5
4039.6
3731.3
4013.9
5354.9
±
±
±
±
±
±
178.7
235.4
151.4
142.1
156.6
30.6
AMBER99SB-ILDN
390.8
293.3
240.5
395.5
287.1
192.3
±
±
±
±
±
±
20.2
19.2
19.6
22.3
19.4
16.7
AMBER99SB-ILDN
OPLS-AA/L
420.3
331.2
300.9
432.8
329.2
192.9
±
±
±
±
±
±
21.2
19.4
20.0
22.2
20.0
17.1
number of
waters
158
179
150
137
147
65
±
±
±
±
±
±
40
63
48
37
42
4
molar
concentration
[M]
2.7
2.7
2.2
2.3
2.5
0.8
±
±
±
±
±
±
0.4
0.4
0.5
0.4
0.4
0.1
OPLS-AA/L
number of
waters
120
144
178
123
163
68
±
±
±
±
±
±
34
34
44
33
40
11
molar
concentration
[M]
2.2
2.3
2.7
2.15
2.7
0.9
±
±
±
±
±
±
0.4
0.4
0.5
0.4
0.5
0.1
a
These results are calculated using all snapshots from 100−200 and 10−20 ns periods of all-atom MD simulation for our tetrameric models and
four chains of 2NAO, respectively.
Figure 5. Intermolecular (upper part) and intramolecular (lower part) contact maps averaged over all snapshots from the 100−200 ns period of allatom MD simulations.
previous studies49,52 (Table 5). Therefore, the estimation of
hSASA supports the observation that our tetrameric structures
are in a compact state. The hSASA of four chains of 2NAO is
larger than all clusters in the AMBER force field, except cluster
3 (Table 5). However, in OPLS-AA/L, all our tetrameric
structures have lower hSASA than 2NAO (Table 5) because
the 2NAO structure is more extended.
3.12. Contact Maps of Aβ42 Tetramer. The intermolecular contact maps for five MD trajectories of two clusters
from REMD show a high propensity to form interactions in
regions (30−42)−(30−42) in both force fields (Figure 5).
This result indicates that the C-terminus plays an important
role in stabilization of the Aβ42 tetramer. In addition, strong
contacts in the C-terminal region of a small oligomer as a
tetramer indicates the seeding role of this region in Aβ42 selfassembly, which is consistent with results from discrete MD of
Urbanc et al.117 Interchain contacts between residues (10−
25)−(10−25) and (30−42)−(1−20) also have significant
populations, which are in agreement with the results of Barz et
al.52 However, the population in our contact maps is higher,
suggesting that the tetramer structures in our work are more
rigid than Barz’s conformations.
To explore the different behaviors of each chain in the
tetramer, we separated the contact map for each of the chains
(Figure S11). Chains B and D have the strongest contact,
indicating that they are located in the tetramer core. The
contacts of these chains are concentrated in areas (15−25)−
(15−25) and (30−42)−(30−42). Because these chains are in
I
DOI: 10.1021/acs.jpcb.9b04208
J. Phys. Chem. B XXXX, XXX, XXX−XXX
Article
The Journal of Physical Chemistry B
polymorphic, and this is due to the fact that the Aβ peptide is
intrinsically disordered. States, separated by a large distance of
shape index, are metastable because the transition between
them is practically forbidden.
3.14. Most Probable Structure of Aβ42 Tetramer.
Based on the above results, we now study the most probable
structure from five clusters, obtained from UNRES REMD
simulation. Experimental studies have shown that the Aβ42
oligomer has turns at residues 24−27,118 25−28,119 13−15,
25−29, and 37−38.112 These turns connect β-strand at regions
13−23, 28−42,118 15−24, 29−42,119 17−21, and 31−36.112
Furthermore, Streltsov et al. showed that the Aβ18−41 tetramer
comprises turns at residues 24−26, β-elements in the region
18−21, and a β-hairpin at residues 32−41.114 In our tetrameric
structures, all clusters have high β-propensity at residues 10−
15, 16−19, 30−34, and 38−40 (Figure 3). However, cluster 4
has a β-strand in residues 25−28 which is inconsistent with
experiments, while other clusters have a rich turn propensity in
regions 5−9, 13−15, 23−27, and 34−38. This result indicates
that secondary structure elements of clusters 1, 2, 3, and 5 are
consistent with experimental data.
As shown above, the CCS values of all clusters are lower
than the experimental value of Bernstein115 but consistent with
Zheng et al.116 (2172 Å2). Cluster 3 (2159.1 ± 86.2 Å2) is best
consistent with the result of Zheng et al. in the AMBER99SBILDN force field. In the case of hSASA results, clusters 2 and 3
have consistent results with other studies. Ahmed et al. have
shown that residue Phe19 has intramolecular contact with
Leu34,112 and the region 17−21 has an interaction with 31−
36. The results for intramolecular contacts of all clusters
(Figure 5) indicate that clusters 3 and 5 form contacts between
residues 15−20 and 30−35, while others have a weak contact
propensity in this region. We can show that the population of
the Phe19−Leu34 intramonomer contact is ≈36% for cluster 3
in OPLS, while it is very poorly populated in other clusters
(less than 11%). From this point of view, cluster 3 is in better
agreement with the experiment112 than other clusters.
Ahmed et al. also showed that the C-termini are buried
inside the oligomer. Moreover, the Aβ18−41 tetramer structure
obtained from a study by Streltsov et al. indicates that the Ctermini constitute the core of the oligomer due to
intermolecular contacts.114 In our MD simulations, all clusters
have a high intermolecular contact propensity at C-terminal
residues (Figure 5). This result indicates the C-termini in our
simulations located close to each other, which is consistent
with experimental data.
Clusters 3 and 5 have lower nonbonded energy than 2NAO
in both force fields. However, in the AMBER99SB-ILDN force
field, the energy of cluster 5 is higher than cluster 3 (Figure 2).
Therefore, cluster 3 is the most energetically stable in both
force fields. Based on this result, cluster 3 seems to be the most
probable structure of the Aβ42 tetramer because of its stability,
and properties are in best agreement with experimental studies.
Representative structures of the largest cluster, obtained in allatom MD trajectories at equilibrium for cluster 3, are shown in
Figure 7. These structures have three C-termini located close
to each other, and they have a spheroid state but not rodlike
shape.
3.15. Reasons why Tetramer Structure is Different
from Fibril. Because the characteristics of the structure and
arrangement of monomers in our tetramer models are different
from four 2NAO chains, we investigated the total hydropathy
index of residues forming interchain contacts in all-atom MD
the tetramer core, this result strengthens the conclusion that
these regions play an important role in stabilizing the tetramer.
Chain A and C have lowest number of contacts suggesting that
they are in the outer shell of the tetramer (Figure S11).
Although these chains form weak contacts, they are also
concentrated in regions (15−25)−(15−25). Consequently, all
tetramer chains have the same contact motif, but water
molecules act on the outer shell chains leading to weaker
contacts in these chains.
3.13. Transition Network. The population of the states
determined by the oligomer size (Figure 6) from the coarse-
Figure 6. Coarse-grained transition network from UNRES REMD
simulation averaged over all replicas. Oligomer size is shown as a label
on each node, while the area of nodes corresponds to the population
of each state, which is also shown in brackets. Colors of the lines with
arrows and their labels represent exchange rates between nodes
(different oligomer sizes).
grained REMD simulation shows that the tetrameric structure
has the highest propensity (76%), implying that the system still
retains tetramer conformation in the REMD simulation. The
probability of a process 2 + 2 → 4 (83.8%) is higher than 3 + 1
→ 4 (73.7%), which suggests that the tetramer is more likely to
be formed from two dimers than from a trimer and monomer
and from four monomers (50.6%). Furthermore, the
population of dimers is larger than the trimers, and the
probability of 4 → 2 + 2 is higher than the 4 → 3 + 1 process
(Figure 6), confirming the observation that the tetramer is
formed from the dimer−dimer association more often than
from the trimer−monomer. This result is consistent with Barz
et al.52 who observed the critical role of the dimer in the
formation of higher order oligomers. The probability of 3 + 1
→ 2 + 2 is higher than 2 + 2 → 3 + 1 (Figure 6), which shows
that the complex of the trimer and monomer is less stable than
two dimers. The full transition network (Figure S12) also
shows that the tetramer states are located closer to the two
dimer state than the trimer−monomer state, which indicates
that the transition between these states is easier and more
frequent than the trimer−monomer to tetramer.
Transition networks for the tetramer in all-atom simulations
are divided into distinct regions (Figure S13), showing that the
tetramer can exist in states with different shapes. Moreover, the
large distance between states with a big difference in the shape
index indicates that the free energy barrier between these states
may be high. Consequently, the tetramer conformation is
J
DOI: 10.1021/acs.jpcb.9b04208
J. Phys. Chem. B XXXX, XXX, XXX−XXX
Article
The Journal of Physical Chemistry B
contacts. The number of residue pairs that form interchain
contacts in our tetrameric structures (Figure 5) is larger than
in the case of 2NAO (Figure S11). However, the interchain
contact populations in our models are lower than in 2NAO.
Because of the ordered structure, the interchain contact maps
of 2NAO have high propensities along the diagonal elements,
which are low in our tetrameric models. In 2NAO regions
(30−42)−(30−42) and (13−20)−(30−42), there are significant populations of contacts, which is similar to our tetrameric
models (Figure 5). These results suggest that in the beginning
of the aggregation, the C-termini of monomers bind to each
other and are located at or near the oligomer surface, while
during the formation of the mature fibril, the monomers are
aligned in the cross-beta structure with the C-termini out of
the core.
Results, obtained for the interface hydrophobicity, prompted
us to calculate the radial distribution of charged atoms in
tetrameric models and 2NAO to explore the charge
distribution in the fibril formation. In both force fields,
charged fragments of tetrameric structures are located closer to
the center of mass than in 2NAO (Figure 9) because the radial
Figure 7. Representative structures of cluster 3 from UNRES REMD
simulation and the largest cluster from five trajectories of all-atom MD
simulations. Cyan balls represent the N-termini, and the orange balls
represent the C-termini. The Cα-rmsd of structures from the MD
simulation in AMBER99SB-ILDN and OPLS-AA/L force fields is 7.6
Å.
simulation, which allows us to estimate the hydropathy of the
interface between monomers. In both AMBER and OPLS
force fields, all clusters are more hydrophobic at the interface
between monomers than 2NAO (Table 5) because of the
larger values of the hydropathy index. Interestingly, cluster 3,
which is the most probable structure of the Aβ42 tetramer, has
the closest hydropathy to 2NAO than any other cluster in both
force fields. This result is consistent with the hSASA values
(Table 5) because cluster 3 has the largest hSASA value
compared to other clusters. In addition, in AMBER, hSASA of
cluster 3 is equivalent to 2NAO. The fact that the most
probable tetrameric and fibril structures have low hydropathy
of the contact interfaces between monomers indicates that a
decrease in hydrophobic interactions at the interfaces of
monomers may be a mechanism in the formation of fibril
structures from oligomers.
Higher hydropathy values for our tetrameric structures than
for 2NAO indicate which areas of the oligomer play an
important role in the formation of tetramers and fibrils. The
population of residues that form contacts during tetramer
formation shows that in both tetramer formation processes 2 +
2 → 4 and 3 + 1 → 4, the C-terminus dominates the binding of
monomers to a dimer or trimer to form a tetramer (Figure 8).
This result is consistent with interchain contact results (Figure
5), in which the C-terminal region has high propensity to
Figure 9. Distribution of distances between charged atoms and the
center of mass of the tetramer from all-atom MD simulations.
distributions of charge are shifted to the lower values
compared to 2NAO. This suggests that in tetrameric
structures, charges are more focused inside, whereas in
2NAO, they are located near the surface of the fibrils.
Therefore, the presence of repulsion forces between negatively
charged monomers (−3e) leads to stretching the oligomer to
keep the charges away from each other.
To better understand the role of the charge, we calculated
the distribution of angles between the dipole moment and the
principal inertia axes of tetramers and 2NAO (Figure S14). As
evident from Figure 10, the distribution of three angles of
2NAO has a sharp peak in both force fields, while wide peaks
occur in the case of five clusters. Cluster 1 even has two peaks
in AMBER. Thus, the distribution of dipoles in tetrameric
structures is more isotropic than in fibrils, which can be
explained by the fact that the 2NAO structure is ordered,
whereas our tetrameric structures are partially disordered.
The fibril formation changes not only the arrangement of
hydrophobic residues and charges but also the number of
water molecules located inside the tetramer. Therefore, we
constructed concave hulls for the tetramers and counted the
number of water molecules present in the resulting
polyhedrons (Figure 11). The number of water molecules in
Figure 8. Population of interchain contacts between residues of
dimer−dimer and trimer−monomer complexes, when a tetramer is
formed from binding of two dimers or a trimer and a monomer. The
result is obtained from all replicas of REMD simulation.
K
DOI: 10.1021/acs.jpcb.9b04208
J. Phys. Chem. B XXXX, XXX, XXX−XXX
Article
The Journal of Physical Chemistry B
small size of the oligomer, only weak repulsive electrostatic
interactions exist between Aβ42 chains (Figure 2) at this stage,
and the charges can be distributed almost randomly. Because
the interactions at this stage are mainly hydrophobic, which is
manifested in the decisive contribution of vdW interactions to
the total nonbonded energy of tetrameric structures (Figure 2),
oligomers tend to form spheroid structures to minimize the
solvent accessible area, which is reflected in hSASA results
(Table 5). However, when the number of monomers in the
aggregation state is large, the repulsive energy of long-range
electrostatic interactions prevails over short-range vdW
interactions of the hydrophobic interface between chains,
which cause the structures to adopt unstable states. The
monomers in the core of the spheroid oligomer will repel the
monomers in the shell because the vdW interaction energy
between them is small due to the large distance. Consequently,
the spheroid shape of oligomers should change to minimize
repulsion and optimize hydrophobic interactions in mature
forms of aggregates. The charged residues move to the
oligomer shell to reduce the internal repulsion energy, and the
hydrophobic regions are more exposed to the solvent than to
the oligomer to attract more monomers. This hypothesis is
supported by the radial distribution of charges (Figure 9) and
the higher hSASA values for 2NAO than for our models
(Table 5). This statement is also confirmed by the analysis of
the nonbonded energy components, which indicates that the
fibril structure has more unfavorable internal Aβ interactions
compared to our tetrameric models (Figure 2), while the
solute−solvent interactions are more favorable for fibrils than
oligomers in the AMBER force field, except cluster 1 (Figure
2). Moreover, fewer internal water molecules in four chains of
2NAO than in oligomer models (Table 5) indicate the
movement of hydrophobic regions from the interior of the
complex to the shell in the fibril formation.
Because the spheroid shape can compensate the repulsion
between the core and the shell of the oligomer, as well as the
binding of new Aβ chains to the oligomer, we hypothesize that
the oligomers will be organized in lower dimensions to form
mature fibrils. Monomers in the spheroid oligomer can repel
new monomers from three dimensions (Figure 12) due to
unfavorable electrostatic interactions. If the oligomers are
arranged in the disc shape, the repulsive force acting on new
monomers may decrease compared to three dimensions
because the monomers in the oligomer are organized along
the x and y axes (Figure 12). Finally, if the oligomers are
organized in rodlike shape, new monomers are repelled only
along one direction, namely, the x-axis (Figure 12), but they
are strongly attracted by monomers at the end of the rodlike
oligomer because of the vdW interactions. The electrostatic
repulsion between monomers in the oligomer can be easily
compensated by attractive vdW interactions between adjacent
monomers. These interactions can be increased if the
hydrophobic surface area at the interface of the aggregate is
large, which attracts additional monomers to bind. Therefore,
during the fibril formation, the monomers are regrouped to
obtain a conformation in which hSASA is large and the
electrostatic repulsion is weak. The energy required to
increasing hSASA and the entropy contribution for the
arrangement of monomers is positive, but they can be
compensated for by reducing the electrostatic repulsion and
increasing the water entropy due to the larger number of free
water molecules. We assume that with an increase in the
oligomer size, Aβ chains are organized in quasi-one dimension
Figure 10. Distribution of angles between the dipole moment and
three principal axes (major, middle, and minor) of inertial moment in
AMBER99SB-ILDN (A) and OPLS/AA-L (B) force fields.
Figure 11. Schematic representation of the tetrameric Aβ42
structures with marked internal water molecules fitted into the
constructed polyhedron.
2NAO is less than in our tetrameric models (Table 5).
Therefore, the fibril is drier than the oligomer, implying that
water molecules are ejected during the fibril formation process.
Reddy and coworkers showed that water molecules are
expulsed in the formation of the fibril of the Aβ C-terminal,120
which is consistent with our results. Because the number of
free water molecules in the solvent is increased with the fibril
formation compared to oligomers, the water entropy is higher,
which can compensate for the free energy required to form a
fibril.
Based on abovementioned results, we propose that the fibril
formation proceeds as follows: At the beginning, the
hydrophobic region of the monomers will be tightly packed
with each other forming a hydrophobic core. Because of the
L
DOI: 10.1021/acs.jpcb.9b04208
J. Phys. Chem. B XXXX, XXX, XXX−XXX
Article
The Journal of Physical Chemistry B
Figure 12. Schematic representation of fibril formation in 3, 2, and 1 dimensions in the left, middle, and right panel, respectively. In the 3D case,
new monomers are under forces acted by monomers inside the oligomer along three directions x, y, and z because monomers are arranged in Ox,
Oy, and Oz axes. Because the electrostatic interaction has a longer range than vdW interaction, the electrostatic interaction pushes new monomers
out of oligomers before the attractive effect of vdW interaction begins to become significant. If the aggregate has a disc-like shape (2D), the
electrostatic repulsion from the monomers inside the mature aggregate is reduced because it lacks monomers on the Oz axis. Then, if the aggregate
has a rodlike shape, the repulsion is minimal, and the vdW interaction can attract new monomers more easily than in the 3D and 2D cases.
■
(e.g., in the form of a rod) and not in three dimensions (like a
sphere), as in the case of small oligomers. Such a quasi-onedimensional structure is consistent with many fibrillary
structures reported in the literature.27,29,30,32
ASSOCIATED CONTENT
S Supporting Information
*
The Supporting Information is available free of charge on the
ACS Publications website at DOI: 10.1021/acs.jpcb.9b04208.
4. CONCLUSIONS
Using REMD simulation with a coarse-grained UNRES force
field, we obtained five Aβ42 tetrameric structures, which were
subsequently refined using MD simulations in two popular allatom force fields. The most probable tetramer structures have
a disc-like shape without a cross-beta structure. Moreover, the
four chains in the tetramer are not equivalent to each other,
most of the time two of them form the core, while other two
are a shell that interacts weakly with other chains but much
stronger with water molecules. For this reason, the observed βcontent is lower for the oligomer than for fibrils. Our results
indicate that structural rearrangement of the tetramer is
necessary for the formation of higher order oligomers and
fibril. The refined structures of cluster 3, obtained in this work,
are in good agreement with experimental data, as well as with
theoretical expectations and can be used, for example, as initial
structures for constructing higher order oligomers or as targets
for the development of AD medicines.
The charge distribution in our tetrameric models is more
isotropic than in four chains taken from the fibril (PDB code:
2NAO). Furthermore, the hydrophobic regions in the fibril are
more exposed to the solvent than in the oligomer.
Consequently, the water density inside the oligomer is higher
than in fibrils, and this may be related to the enhanced toxicity
of oligomers. Based on the difference between our tetrameric
models and the 2NAO structure, we hypothesize that during
the fibril formation, the repulsion between monomers in the
core of spheroid oligomers is the main cause of the lower
stability of oligomeric conformations. Therefore, upon fibril
formation, they reorganize the structure to adopt a quasi-onedimensional or rodlike shape in order to minimize the
repulsion of the Aβ42 chains and optimize the attraction
between neighboring chains.
It has to be noted that results presented in this work are
valid only for water environment and Aβ structures and
dynamics can significantly vary in different environments (e.g.,
SDS)121 or water−lipid interface.122 The latter seems to play
an important role in AD development,123 and such studies are
currently undergoing in our lab.
■
All-atom structures of five clusters (ZIP)
rmsd of docking structures with structure 1 is the
reference structure; Cα-rmsd (Å) between representative structures from all-atom MD simulations and the
representative structures from coarse-grained REMD
simulation; average secondary structure of all chains in
MD simulations; initial structures in UNRES REMD
simulation; walk of replica 1 and 24 in REMD
simulation; number of interchain contact histogram in
REMD simulation; distribution of oligomer size in
UNRES REMD simulation; Cα-rmsd of all-atom MD
trajectories; representative structures from all-atom MD
simulations starting from the structures obtained in the
UNRES REMD simulation; secondary structure distributions from all-atom MD simulations starting from
UNRES structures with AMBER99SB-ILDN and OPLS
force fields presented separately for each chain; RMSF of
the tetramer from all-atom MD simulations starting from
UNRES structures with the AMBER99-ILDN force field
presented separately for each chain; initial structure for
each simulation was used as the reference; contact map
(distance of center of mass between two side chains
below 6.5 Å) within each chain, calculated from all-atom
MD simulations in AMBER99-ILDN and OPLS force
fields starting from UNRES structures; transition
networks of REMD coarse-grained and conventional
all-atom simulations; interchain contact map of 2NAO
from all-atom MD simulation; schematic plot for dipole
moment and inertia principal axes (PDF)
AUTHOR INFORMATION
Corresponding Author
*E-mail: Phone: +48 22 843 66 01.
ORCID
Mai Suan Li: 0000-0001-7021-7916
Author Contributions
M.S.L. conceived the experiments. N.H.L., P.K., and N.M.H.
conducted the experiment. N.H.L., P.K., N.M.H., and M.S.L.
analyzed the results. M.S.L., P.K., and N.H.L. wrote the paper.
All the authors reviewed the manuscript.
M
DOI: 10.1021/acs.jpcb.9b04208
J. Phys. Chem. B XXXX, XXX, XXX−XXX
Article
The Journal of Physical Chemistry B
Funding
(15) Cappai, R.; Barnham, K. J. Delineating the Mechanism of
Alzheimer’s Disease Aβ Peptide Neurotoxicity. Neurochem. Res. 2008,
33, 526−532.
(16) Baglioni, S.; Casamenti, F.; Bucciantini, M.; Luheshi, L. M.;
Taddei, N.; Chiti, F.; Dobson, C. M.; Stefani, M. Prefibrillar Amyloid
Aggregates Could Be Generic Toxins in Higher Organisms. J.
Neurosci. 2006, 26, 8160−8167.
(17) Haass, C.; Selkoe, D. J. Soluble protein oligomers in
neurodegeneration: lessons from the Alzheimer’s amyloid β-peptide.
Nat. Rev. Mol. Cell Biol. 2007, 8, 101.
(18) McLean, C. A.; Cherny, R. A.; Fraser, F. W.; Fuller, S. J.; Smith,
M. J.; Konrad Vbeyreuther, A. I.; Bush, A. I.; Masters, C. L. Soluble
pool of A beta amyloid as a determinant of severity of neurodegeneration in Alzheimer’s disease. Ann. Neurol. 1999, 46, 860−866.
(19) Cleary, J. P.; Walsh, D. M.; Hofmeister, J. J.; Shankar, G. M.;
Kuskowski, M. A.; Selkoe, D. J.; Ashe, K. H. Natural oligomers of the
amyloid-β protein specifically disrupt cognitive function. Nat.
Neurosci. 2005, 8, 79.
(20) Serra-Batiste, M.; Ninot-Pedrosa, M.; Bayoumi, M.; Gairí, M.;
Maglia, G.; Carulla, N. Aβ42 assembles into specific β-barrel poreforming oligomers in membrane-mimicking environments. Proc. Natl.
Acad. Sci. U.S.A. 2016, 113, 10866−10871.
(21) Lee, J.; Kim, Y. H.; Arce, F. T.; Gillman, A. L.; Jang, H.; Kagan,
B. L.; Nussinov, R.; Yang, J.; Lal, R. Amyloid β Ion Channels in a
Membrane Comprising Brain Total Lipid Extracts. ACS Chem.
Neurosci. 2017, 8, 1348−1357.
(22) Drews, A.; Flint, J.; Shivji, N.; Jönsson, P.; Wirthensohn, D.; De
Genst, E.; Vincke, C.; Muyldermans, S.; Dobson, C.; Klenerman, D.
Individual Aggregates of Amyloid Beta Induce Temporary Calcium
Influx through the Cell Membrane of Neuronal Cells. Sci. Rep. 2016,
6, 31910.
(23) Yang, T.; Li, S.; Xu, H.; Walsh, D. M.; Selkoe, D. J. Large
Soluble Oligomers of Amyloid β-Protein from Alzheimer Brain Are
Far Less Neuroactive Than the Smaller Oligomers to Which They
Dissociate. J. Neurosci. 2017, 37, 152−163.
(24) Jana, M. K.; Cappai, R.; Pham, C. L. L.; Ciccotosto, G. D.
Membrane-bound tetramer and trimer Aβ oligomeric species
correlate with toxicity towards cultured neurons. J. Neurochem.
2016, 136, 594−608.
(25) Ono, K.; Condron, M. M.; Teplow, D. B. Structureneurotoxicity relationships of amyloid -protein oligomers. Proc. Natl.
Acad. Sci. U.S.A. 2009, 106, 14745−14750.
(26) Xiao, Y.; Ma, B.; McElheny, D.; Parthasarathy, S.; Long, F.;
Hoshi, M.; Nussinov, R.; Ishii, Y. Aβ(1-42) fibril structure illuminates
self-recognition and replication of amyloid in Alzheimer’s disease. Nat.
Struct. Mol. Biol. 2015, 22, 499.
(27) Wälti, M. A.; Ravotti, F.; Arai, H.; Glabe, C. G.; Wall, J. S.;
Böckmann, A.; Güntert, P.; Meier, B. H.; Riek, R. Atomic-resolution
structure of a disease-relevant Aβ(1-42) amyloid fibril. Proc. Natl.
Acad. Sci. U.S.A. 2016, 113, E4976−E4984.
(28) Colvin, M. T.; Silvers, R.; Ni, Q. Z.; Can, T. V.; Sergeyev, I.;
Rosay, M.; Donovan, K. J.; Michael, B.; Wall, J.; Linse, S.; Griffin, R.
G. Atomic Resolution Structure of Monomorphic Aβ42 Amyloid
Fibrils. J. Am. Chem. Soc. 2016, 138, 9663−9674.
(29) Gremer, L.; Schölzel, D.; Schenk, C.; Reinartz, E.; Labahn, J.;
Ravelli, R. B. G.; Tusche, M.; Lopez-Iglesias, C.; Hoyer, W.; Heise,
H.; Willbold, D.; Schröder, G. F. Fibril structure of amyloid-β(1-42)
by cryo-electron microscopy. Science 2017, 358, 116−119.
(30) Lu, J.-X.; Qiang, W.; Yau, W.-M.; Schwieters, C. D.; Meredith,
S. C.; Tycko, R. Molecular Structure of β-Amyloid Fibrils in
Alzheimer’s Disease Brain Tissue. Cell 2013, 154, 1257−1268.
(31) Nasica-Labouze, J.; Nguyen, P. H.; Sterpone, F.; Berthoumieu,
O.; Buchete, N.-V.; Coté, S.; De Simone, A.; Doig, A. J.; Faller, P.;
Garcia, A.; Laio, A.; Li, M. S.; Melchionna, S.; Mousseau, N.; Mu, Y.;
Paravastu, A.; Pasquali, S.; Rosenman, D. J.; Strodel, B.; Tarus, B.;
Viles, J. H.; Zhang, T.; Wang, C.; Derreumaux, P. Amyloid β Protein
and Alzheimer’s Disease: When Computer Simulations Complement
Experimental Studies. Chem. Rev. 2015, 115, 3518−3563.
This work was supported by Narodowe Centrum Nauki in
Poland (grant nos. 2015/19/B/ST4/02721 and 2017/27/N/
NZ1/02871) and Department of Science and Technology at
Ho Chi Minh City, Vietnam (grant no. 03/2018/HDKHCNTT). Allocation of CPU time at the supercomputer
center TASK in Gdansk (Poland) is highly appreciated. This
research was also supported in part by PLGrid Infrastructure in
Poland.
Notes
The authors declare no competing financial interest.
■
REFERENCES
(1) Qiu, C.; Kivipelto, M.; von Strauss, E. Epidemiology of
Alzheimer’s disease: occurrence, determinants, and strategies toward
intervention. Dialogues Clin. Neurosci. 2009, 11, 111−128.
(2) Serrano-Pozo, A.; Frosch, M. P.; Masliah, E.; Hyman, B. T.
Neuropathological Alterations in Alzheimer Disease. Cold Spring
Harbor Perspect. Med. 2011, 1, a006189.
(3) Chiti, F.; Dobson, C. M. Protein Misfolding, Amyloid
Formation, and Human Disease: A Summary of Progress over the
Last Decade. Annu. Rev. Biochem. 2017, 86, 27−68.
(4) Braak, H.; Zetterberg, H.; Del Tredici, K.; Blennow, K.
Intraneuronal tau aggregation precedes diffuse plaque deposition,
but amyloid-β changes occur before increases of tau in cerebrospinal
fluid. Acta Neuropathol. 2013, 126, 631−641.
(5) Bloom, G. S. Amyloid-β and Tau. JAMA Neurol. 2014, 71, 505−
508.
(6) Buchhave, P.; Minthon, L.; Zetterberg, H.; Wallin, Å. K.;
Blennow, K.; Hansson, O. Cerebrospinal Fluid Levels of β-Amyloid 142, but Not of Tau, Are Fully Changed Already 5 to 10 Years Before
the Onset of Alzheimer Dementia. Annu. Rev. Biochem. 2012, 69, 98−
106.
(7) Chow, V. W.; Mattson, M. P.; Wong, P. C.; Gleichmann, M. An
Overview of App Processing Enzymes and Products. NeuroMol. Med.
2010, 12, 1−12.
(8) Suzuki, N.; Cheung, T.; Cai, X.; Odaka, A.; Otvos, L., Jr.;
Eckman, C.; Golde, T.; Younkin, S. An increased percentage of long
amyloid beta protein secreted by familial amyloid beta protein
precursor (beta APP717) mutants. Science 1994, 264, 1336−1340.
(9) Jarrett, J. T.; Berger, E. P.; Lansbury, P. T., Jr. The carboxy
terminus of the .beta. amyloid protein is critical for the seeding of
amyloid formation: Implications for the pathogenesis of Alzheimer’s
disease. Biochemistry 1993, 32, 4693−4697.
(10) El-Agnaf, O. M. A.; Mahil, D. S.; Patel, B. P.; Austen, B. M.
Oligomerization and Toxicity of β-Amyloid-42 Implicated in
Alzheimer’s Disease. Biochem. Biophys. Res. Commun. 2000, 273,
1003−1007.
(11) Riek, R.; Güntert, P.; Döbeli, H.; Wipf, B.; Wüthrich, K. NMR
studies in aqueous solution fail to identify significant conformational
differences between the monomeric forms of two Alzheimer peptides
with widely different plaque-competence, Aβ(1-0)(ox) and Aβ(142)(ox). FEBS J. 2001, 268, 5930−5936.
(12) Hou, L.; Shao, H.; Zhang, Y.; Li, H.; Menon, N. K.; Neuhaus,
E. B.; Brewer, J. M.; Byeon, I.-J. L.; Ray, D. G.; Vitek, M. P.; Iwashita,
T.; Makula, R. A.; Przybyla, A. B.; Zagorski, M. G. Solution NMR
Studies of the Aβ(1−40) and Aβ(1−42) Peptides Establish that the
Met35 Oxidation State Affects the Mechanism of Amyloid Formation.
J. Am. Chem. Soc. 2004, 126, 1992−2005.
(13) Aleksis, R.; Oleskovs, F.; Jaudzems, K.; Pahnke, J.; Biverstål, H.
Structural studies of amyloid-β peptides: Unlocking the mechanism of
aggregation and the associated toxicity. Biochimie 2017, 140, 176−
192.
(14) Hardy, J.; Selkoe, D. J. The Amyloid Hypothesis of Alzheimer’s
Disease: Progress and Problems on the Road to Therapeutics. Science
2002, 297, 353−356.
N
DOI: 10.1021/acs.jpcb.9b04208
J. Phys. Chem. B XXXX, XXX, XXX−XXX
Article
The Journal of Physical Chemistry B
(51) Barz, B.; Olubiyi, O. O.; Strodel, B. Early amyloid β-protein
aggregation precedes conformational change. Chem. Commun. 2014,
50, 5373−5375.
(52) Barz, B.; Liao, Q.; Strodel, B. Pathways of Amyloid-β
Aggregation Depend on Oligomer Shape. J. Am. Chem. Soc. 2018,
140, 319−327.
(53) Chebaro, Y.; Jiang, P.; Zang, T.; Mu, Y.; Nguyen, P. H.;
Mousseau, N.; Derreumaux, P. Structures of Aβ17-42 Trimers in
Isolation and with Five Small-Molecule Drugs Using a Hierarchical
Computational Procedure. J. Phys. Chem. B 2012, 116, 8412−8422.
(54) Kim, S.; Takeda, T.; Klimov, D. K. Mapping Conformational
Ensembles of Aβ Oligomers in Molecular Dynamics Simulations.
Biophys. J. 2010, 99, 1949−1958.
(55) Liwo, A.; Ołdziej, S.; Pincus, M. R.; Wawak, R. J.; Rackovsky,
S.; Scheraga, H. A. A united-residue force field for off-lattice proteinstructure simulations. I. Functional forms and parameters of longrange side-chain interaction potentials from protein crystal data. J.
Comput. Chem. 1997, 18, 849−873.
(56) Khalili, M.; Liwo, A.; Jagielska, A.; Scheraga, H. A. Molecular
Dynamics with the United-Residue Model of Polypeptide Chains. II.
Langevin and Berendsen-Bath Dynamics and Tests on Model αHelical Systems. J. Phys. Chem. B 2005, 109, 13798−13810.
(57) Nanias, M.; Czaplewski, C.; Scheraga, H. A. Replica Exchange
and Multicanonical Algorithms with the Coarse-Grained UnitedResidue (Unres) Force Field. J. Chem. Theory Comput. 2006, 2, 513−
528.
(58) Rojas, A. V.; Liwo, A.; Scheraga, H. A. Molecular Dynamics
with the United-Residue Force Field: Ab Initio Folding Simulations of
Multichain Proteins. J. Phys. Chem. B 2007, 111, 293−309.
(59) Petkova, A. T.; Yau, W.-M.; Tycko, R. Experimental
Constraints on Quaternary Structure in Alzheimer’s β-Amyloid
Fibrils†. Biochemistry 2006, 45, 498−512.
(60) Kim, Y. S.; Liu, L.; Axelsen, P. H.; Hochstrasser, R. M. 2D IR
provides evidence for mobile water molecules in -amyloid fibrils. Proc.
Natl. Acad. Sci. U.S.A. 2009, 106, 17751−17756.
(61) Wang, T.; Jo, H.; DeGrado, W. F.; Hong, M. Water
Distribution, Dynamics, and Interactions with Alzheimer’s β-Amyloid
Fibrils Investigated by Solid-State NMR. J. Am. Chem. Soc. 2017, 139,
6242−6252.
(62) Xi, W.; Hansmann, U. H. E. Ring-Like N-Fold Models of a
Beta(42) Fibrils. Sci. Rep. 2017, 7, 6588.
(63) Kozakov, D.; Beglov, D.; Bohnuud, T.; Mottarella, S. E.; Xia, B.;
Hall, D. R.; Vajda, S. How Good Is Automated Protein Docking?
Proteins: Struct., Funct., Bioinf. 2013, 81, 2159−2166.
(64) Kozakov, D.; Hall, D. R.; Xia, B.; Porter, K. A.; Padhorny, D.;
Yueh, C.; Beglov, D.; Vajda, S. The Cluspro Web Server for ProteinProtein Docking. Nat. Protoc. 2017, 12, 255−278.
(65) Liwo, A.; Baranowski, M.; Czaplewski, C.; Gołaś, E.; He, Y.;
Jagieła, D.; Krupa, P.; Maciejczyk, M.; Makowski, M.; Mozolewska, M.
A. A Unified Coarse-Grained Model of Biological Macromolecules
Based on Mean-Field Multipole−Multipole Interactions. J. Mol.
Model. 2014, 20, 2306.
(66) Sieradzan, A. K.; Krupa, P.; Scheraga, H. A.; Liwo, A.;
Czaplewski, C. Physics-Based Potentials for the Coupling between
Backbone- and Side-Chain-Local Conformational States in the United
Residue (UNRES) Force Field for Protein Simulations. J. Chem.
Theory Comput. 2015, 11, 817−831.
(67) Krupa, P.; Hałabis, A.; Ż mudzińska, W.; Ołdziej, S.; Scheraga,
H. A.; Liwo, A. Maximum Likelihood Calibration of the Unres Force
Field for Simulation of Protein Structure and Dynamics. J. Chem. Inf.
Model. 2017, 57, 2364−2377.
(68) Sieradzan, A. K. Introduction of Periodic Boundary Conditions
into Unres Force Field. J. Comput. Chem. 2015, 36, 940−946.
(69) Mozolewska, M. A.; Krupa, P.; Scheraga, H. A.; Liwo, A.
Molecular modeling of the binding modes of the iron-sulfur protein to
the Jac1 co-chaperone fromSaccharomyces cerevisiaeby all-atom and
coarse-grained approaches. Proteins: Struct., Funct., Bioinf. 2015, 83,
1414−1426.
(32) Luhrs, T.; Ritter, C.; Adrian, M.; Riek-Loher, D.; Bohrmann, B.;
Dobeli, H.; Schubert, D.; Riek, R. 3D structure of Alzheimer’s
amyloid- (1-42) fibrils. Proc. Natl. Acad. Sci. U.S.A. 2005, 102, 17342−
17347.
(33) Qiang, W.; Yau, W.-M.; Luo, Y.; Mattson, M. P.; Tycko, R.
Antiparallel -sheet architecture in Iowa-mutant -amyloid fibrils. Proc.
Natl. Acad. Sci. U.S.A. 2012, 109, 4443−4448.
(34) Chandra, B.; Bhowmik, D.; Maity, B. K.; Mote, K. R.; Dhara,
D.; Venkatramani, R.; Maiti, S.; Madhu, P. K. Major Reaction
Coordinates Linking Transient Amyloid-β Oligomers to Fibrils
Measured at Atomic Level. Biophys. J. 2017, 113, 805−816.
(35) Yu, L.; Edalji, R.; Harlan, J. E.; Holzman, T. F.; Lopez, A. P.;
Labkovsky, B.; Hillen, H.; Barghorn, S.; Ebert, U.; Richardson, P. L.;
Miesbauer, L.; Solomon, L.; Bartley, D.; Walter, K.; Johnson, R. W.;
Hajduk, P. J.; Olejniczak, E. T. Structural Characterization of a
Soluble Amyloid β-Peptide Oligomer. Biochemistry 2009, 48, 1870−
1877.
(36) Yang, M.; Teplow, D. B. Amyloid β-Protein Monomer Folding:
Free-Energy Surfaces Reveal Alloform-Specific Differences. J. Mol.
Biol. 2008, 384, 450−464.
(37) Linh, N. H.; Tran, T. T. M.; Tu, L.; Hu, C.-K.; Li, M. S. Impact
of Mutations at C-Terminus on Structures and Dynamics of Aβ40 and
Aβ42: Molecular Simulation Study. J. Phys. Chem. B 2017, 121,
4341−4354.
(38) Truong, P. M.; Viet, M. H.; Nguyen, P. H.; Hu, C.-K.; Li, M. S.
Effect of Taiwan Mutation (D7H) on Structures of Amyloid-β
Peptides: Replica Exchange Molecular Dynamics Study. J. Phys. Chem.
B 2014, 118, 8972−8981.
(39) Nguyen, H. L.; Thi Minh Thu, T.; Truong, P. M.; Lan, P. D.;
Man, V. H.; Nguyen, P. H.; Tu, L. A.; Chen, Y.-C.; Li, M. S. Aβ41
Aggregates More Like Aβ40 than Like Aβ42: In Silico and in Vitro
Study. J. Phys. Chem. B 2016, 120, 7371−7379.
(40) Zhang, Y.; Hashemi, M.; Lv, Z.; Lyubchenko, Y. L. Selfassembly of the full-length amyloid Aβ42 protein in dimers. Nanoscale
2016, 8, 18928−18937.
(41) Liao, Q.; Owen, M. C.; Bali, S.; Barz, B.; Strodel, B. Aβ under
stress: the effects of acidosis, Cu2+-binding, and oxidation on amyloid
β-peptide dimers. Chem. Commun. 2018, 54, 7766−7769.
(42) Cao, Y.; Jiang, X.; Han, W. Self-Assembly Pathways of β-SheetRich Amyloid-β(1-40) Dimers: Markov State Model Analysis on
Millisecond Hybrid-Resolution Simulations. J. Chem. Theory Comput.
2017, 13, 5731−5744.
(43) Zhang, T.; Zhang, J.; Derreumaux, P.; Mu, Y. Molecular
Mechanism of the Inhibition of EGCG on the Alzheimer Aβ1-42
Dimer. J. Phys. Chem. B 2013, 117, 3993−4002.
(44) Zhu, X.; Bora, R. P.; Barman, A.; Singh, R.; Prabhakar, R.
Dimerization of the Full-Length Alzheimer Amyloid β-Peptide
(Aβ42) in Explicit Aqueous Solution: A Molecular Dynamics Study.
J. Phys. Chem. B 2012, 116, 4405−4416.
(45) Chong, S.-H.; Ham, S. Atomic-level investigations on the
amyloid-β dimerization process and its driving forces in water. Phys.
Chem. Chem. Phys. 2012, 14, 1573−1575.
(46) Barz, B.; Urbanc, B. Dimer Formation Enhances Structural
Differences between Amyloid β-Protein (1-40) and (1-42): An
Explicit-Solvent Molecular Dynamics Study. PLoS One 2012, 7,
No. e34345.
(47) Tarus, B.; Tran, T. T.; Nasica-Labouze, J.; Sterpone, F.;
Nguyen, P. H.; Derreumaux, P. Structures of the Alzheimer’s WildType Aβ1-40 Dimer from Atomistic Simulations. J. Phys. Chem. B
2015, 119, 10478−10487.
(48) Nagel-Steger, L.; Owen, M. C.; Strodel, B. An Account of
Amyloid Oligomers: Facts and Figures Obtained from Experiments
and Simulations. ChemBioChem 2016, 17, 657−676.
(49) Brown, A. M.; Bevan, D. R. Molecular Dynamics Simulations of
Amyloid β -Peptide (1-42): Tetramer Formation and Membrane
Interactions. Biophys. J. 2016, 111, 937−949.
(50) Meral, D.; Urbanc, B. Discrete Molecular Dynamics Study of
Oligomer Formation by N-Terminally Truncated Amyloid β-Protein.
J. Mol. Biol. 2013, 425, 2260−2275.
O
DOI: 10.1021/acs.jpcb.9b04208
J. Phys. Chem. B XXXX, XXX, XXX−XXX
Article
The Journal of Physical Chemistry B
(88) Gerben, S. R.; Lemkul, J. A.; Brown, A. M.; Bevan, D. R.
Comparing atomistic molecular mechanics force fields for a difficult
target: a case study on the Alzheimer’s amyloid β-peptide. J. Biomol.
Struct. Dyn. 2014, 32, 1817−1832.
(89) Somavarapu, A. K.; Kepp, K. P. The Dependence of Amyloid-β
Dynamics on Protein Force Fields and Water Models. ChemPhysChem
2015, 16, 3278−3289.
(90) Carballo-Pacheco, M.; Strodel, B. Comparison of Force Fields
for Alzheimer’s A: A Case Study for Intrinsically Disordered Proteins.
Protein Sci. 2017, 26, 174−185.
(91) Bussi, G.; Donadio, D.; Parrinello, M. Canonical Sampling
through Velocity Rescaling. J. Chem. Phys. 2007, 126, 014101.
(92) Frishman, D.; Argos, P. Knowledge-based protein secondary
structure assignment. Proteins: Struct., Funct., Bioinf. 1995, 23, 566−
579.
(93) Kyte, J.; Doolittle, R. F. A Simple Method for Displaying the
Hydropathic Character of a Protein. J. Mol. Biol. 1982, 157, 105−132.
(94) Barber, C. B.; Dobkin, D. P.; Huhdanpaa, H. The Quickhull
Algorithm for Convex Hulls. ACM Trans. Math Software 1996, 22,
469−483.
(95) Park, J.-S.; Oh, S.-J. A New Concave Hull Algorithm and
Concaveness Measure for N-Dimensional Datasets. J. Inf. Sci. Eng.
2012, 28, 587−600.
(96) Daura, X.; Gademann, K.; Jaun, B.; Seebach, D.; van Gunsteren,
W. F.; Mark, A. E. Peptide Folding: When Simulation Meets
Experiment. Angew. Chem., Int. Ed. 1999, 38, 236−240.
(97) Riccardi, L.; Nguyen, P. H.; Stock, G. Construction of the Free
Energy Landscape of Peptide Aggregation from Molecular Dynamics
Simulations. J. Chem. Theory Comput. 2012, 8, 1471−1479.
(98) Barz, B.; Wales, D. J.; Strodel, B. A Kinetic Approach to the
Sequence-Aggregation Relationship in Disease-Related Protein
Assembly. J. Phys. Chem. B 2014, 118, 1003−1011.
(99) Bastian, M.; Heymann, S.; Jacomy, M. Gephi: An Open Source
Software for Exploring and Manipulating Networks; ICWSM, 2009;
Vol. 8, pp 361−362.
(100) Mesleh, M. F.; Hunter, J. M.; Shvartsburg, A. A.; Schatz, G.
C.; Jarrold, M. F. Structural Information from Ion Mobility
Measurements: Effects of the Long-Range Potential. J. Phys. Chem.
1996, 100, 16082−16086.
(101) Shvartsburg, A. A.; Jarrold, M. F. An Exact Hard-Spheres
Scattering Model for the Mobilities of Polyatomic Ions. Chem. Phys.
Lett. 1996, 261, 86−91.
(102) May, J. C.; Morris, C. B.; McLean, J. A. Ion Mobility Collision
Cross Section Compendium. Anal. Chem. 2016, 89, 1032−1044.
(103) Eisenhaber, F.; Lijnzaad, P.; Argos, P.; Sander, C.; Scharf, M.
The Double Cubic Lattice Method: Efficient Approaches to
Numerical Integration of Surface Area and Volume and to Dot
Surface Contouring of Molecular Assemblies. J. Comput. Chem. 1995,
16, 273−284.
(104) Sengupta, U.; Carballo-Pacheco, M.; Strodel, B. Automated
Markov State Models for Molecular Dynamics Simulations of
Aggregation and Self-Assembly. J. Chem. Phys. 2019, 150, 115101.
(105) Strodel, B.; Whittleston, C. S.; Wales, D. J. Thermodynamics
and Kinetics of Aggregation for the Gnnqqny Peptide. J. Am. Chem.
Soc. 2007, 129, 16005−16014.
(106) Pham, J. D.; Chim, N.; Goulding, C. W.; Nowick, J. S.
Structures of Oligomers of a Peptide from β-Amyloid. J. Am. Chem.
Soc. 2013, 135, 12460−12467.
(107) Laganowsky, A.; Liu, C.; Sawaya, M. R.; Whitelegge, J. P.;
Park, J.; Zhao, M.; Pensalfini, A.; Soriaga, A. B.; Landau, M.; Teng, P.
K.; et al. Atomic View of a Toxic Amyloid Small Oligomer. Science
2012, 335, 1228−1231.
(108) Berhanu, W. M.; Hansmann, U. H. E. The stability of
cylindrin β-barrel amyloid oligomer models-A molecular dynamics
study. Proteins: Struct., Funct., Bioinf. 2013, 81, 1542−1555.
(109) Haupt, C.; Leppert, J.; Rönicke, R.; Meinhardt, J.; Yadav, J. K.;
Ramachandran, R.; Ohlenschläger, O.; Reymann, K. G.; Görlach, M.;
Fändrich, M. Structural Basis of β-Amyloid-Dependent Synaptic
Dysfunctions. Angew. Chem., Int. Ed. 2012, 51, 1576−1579.
(70) Krupa, P.; Mozolewska, M. A.; Wiśniewska, M.; Yin, Y.; He, Y.;
Sieradzan, A. K.; Ganzynkowicz, R.; Lipska, A. G.; Karczyńska, A.;
Ślusarz, M.; Ślusarz, R.; Giełdoń, A.; Czaplewski, C.; Jagieła, D.;
Zaborowski, B.; Scheraga, H. A.; Liwo, A. Performance of ProteinStructure Predictions with the Physics-Based Unres Force Field in
Casp11. Bioinformatics 2016, 32, 3270−3278.
(71) Maisuradze, G. G.; Medina, J.; Kachlishvili, K.; Krupa, P.;
Mozolewska, M. A.; Martin-Malpartida, P.; Maisuradze, L.; Macias,
M. J.; Scheraga, H. A. Preventing Fibril Formation of a Protein by
Selective Mutation. Proc. Natl. Acad. Sci. U.S.A. 2015, 112, 13549−
13554.
(72) Rojas, A.; Liwo, A.; Browne, D.; Scheraga, H. A. Mechanism of
Fiber Assembly: Treatment of Aβ Peptide Aggregation with a CoarseGrained United-Residue Force Field. J. Mol. Biol. 2010, 404, 537−
552.
(73) Rojas, A.; Maisuradze, N.; Kachlishvili, K.; Scheraga, H. A.;
Maisuradze, G. G. Elucidating Important Sites and the Mechanism for
Amyloid Fibril Formation by Coarse-Grained Molecular Dynamics.
ACS Chem. Neurosci. 2016, 8, 201−209.
(74) Doig, A. J.; del Castillo-Frias, M. P.; Berthoumieu, O.; Tarus,
B.; Nasica-Labouze, J.; Sterpone, F.; Nguyen, P. H.; Hooper, N. M.;
Faller, P.; Derreumaux, P. Why Is Research on Amyloid-β Failing to
Give New Drugs for Alzheimer’s Disease? ACS Chem. Neurosci. 2017,
8, 1435−1437.
(75) Kmiecik, S.; Gront, D.; Kolinski, M.; Wieteska, L.; Dawid, A. E.;
Kolinski, A. Coarse-Grained Protein Models and Their Applications.
Chem. Rev. 2016, 116, 7898−7936.
(76) Kumar, S.; Rosenberg, J. M.; Bouzida, D.; Swendsen, R. H.;
Kollman, P. A. THE weighted histogram analysis method for freeenergy calculations on biomolecules. I. The method. J. Comput. Chem.
1992, 13, 1011−1021.
(77) Liwo, A.; Khalili, M.; Czaplewski, C.; Kalinowski, S.; Ołdziej, S.;
Wachucik, K.; Scheraga, H. A. Modification and Optimization of the
United-Residue (Unres) Potential Energy Function for Canonical
Simulations. I. Temperature Dependence of the Effective Energy
Function and Tests of the Optimization Method with Single Training
Proteins. J. Phys. Chem. B 2007, 111, 260−285.
(78) Murtagh, F.; Heck, A. Book Review: Multivariate Data Analysis;
Kluwer Academic, 1986; Observatory 1987, Vol. 107, p 227.
(79) Abraham, M. J.; Murtola, T.; Schulz, R.; Páll, S.; Smith, J. C.;
Hess, B.; Lindahl, E. Gromacs: High Performance Molecular
Simulations through Multi-Level Parallelism from Laptops to
Supercomputers. SoftwareX 2015, 1-2, 19−25.
(80) Darden, T.; York, D.; Pedersen, L. Particle mesh Ewald: An N·
log(N) method for Ewald sums in large systems. J. Chem. Phys. 1993,
98, 10089−10092.
(81) Hess, B.; Bekker, H.; Berendsen, H. J. C.; Fraaije, J. G. E. M.
Lincs: A Linear Constraint Solver for Molecular Simulations. J.
Comput. Chem. 1997, 18, 1463−1472.
(82) Rotkiewicz, P.; Skolnick, J. Fast procedure for reconstruction of
full-atom protein models from reduced representations. J. Comput.
Chem. 2008, 29, 1460−1465.
(83) Krivov, G. G.; Shapovalov, M. V.; Dunbrack, R. L. Improved
prediction of protein side-chain conformations with SCWRL4.
Proteins: Struct., Funct., Bioinf. 2009, 77, 778−795.
(84) Lindorff-Larsen, K.; Piana, S.; Palmo, K.; Maragakis, P.; Klepeis,
J. L.; Dror, R. O.; Shaw, D. E. Improved Side-Chain Torsion
Potentials for the Amber Ff99sb Protein Force Field. Proteins: Struct.,
Funct., Bioinf. 2010, 78, 1950−1958.
(85) Kaminski, G. A.; Friesner, R. A.; Tirado-Rives, J.; Jorgensen, W.
L. Evaluation and Reparametrization of the OPLS-AA Force Field for
Proteins via Comparison with Accurate Quantum Chemical
Calculations on Peptides†. J. Phys. Chem. B 2001, 105, 6474−6487.
(86) Jorgensen, W. L.; Chandrasekhar, J.; Madura, J. D.; Impey, R.
W.; Klein, M. L. Comparison of Simple Potential Functions for
Simulating Liquid Water. J. Chem. Phys. 1983, 79, 926−935.
(87) Man, V. H.; Nguyen, P. H.; Derreumaux, P. High-Resolution
Structures of the Amyloid-β 1-42 Dimers from the Comparison of
Four Atomistic Force Fields. J. Phys. Chem. B 2017, 121, 5977−5987.
P
DOI: 10.1021/acs.jpcb.9b04208
J. Phys. Chem. B XXXX, XXX, XXX−XXX
Article
The Journal of Physical Chemistry B
(110) Rosenman, D. J.; Connors, C. R.; Chen, W.; Wang, C.; García,
A. E. Aβ Monomers Transiently Sample Oligomer and Fibril-Like
Configurations: Ensemble Characterization Using a Combined MD/
NMR Approach. J. Mol. Biol. 2013, 425, 3338−3359.
(111) Ball, K. A.; Phillips, A. H.; Wemmer, D. E.; Head-Gordon, T.
Differences in β-strand Populations of Monomeric Aβ40 and Aβ42.
Biophys. J. 2013, 104, 2714−2724.
(112) Ahmed, M.; Davis, J.; Aucoin, D.; Sato, T.; Ahuja, S.; Aimoto,
S.; Elliott, J. I.; Van Nostrand, W. E.; Smith, S. O. Structural
conversion of neurotoxic amyloid-β1-42 oligomers to fibrils. Nat.
Struct. Mol. Biol. 2010, 17, 561.
(113) Huy, P. D. Q.; Vuong, Q. V.; La Penna, G.; Faller, P.; Li, M. S.
Impact of Cu(II) Binding on Structures and Dynamics of Aβ42
Monomer and Dimer: Molecular Dynamics Study. ACS Chem.
Neurosci. 2016, 7, 1348−1363.
(114) Streltsov, V. A.; Varghese, J. N.; Masters, C. L.; Nuttall, S. D.
Crystal Structure of the Amyloid- p3 Fragment Provides a Model for
Oligomer Formation in Alzheimer’s Disease. J. Neurosci. 2011, 31,
1419−1426.
(115) Bernstein, S. L.; Dupuis, N. F.; Lazo, N. D.; Wyttenbach, T.;
Condron, M. M.; Bitan, G.; Teplow, D. B.; Shea, J.-E.; Ruotolo, B. T.;
Robinson, C. V.; Bowers, M. T. Amyloid-β protein oligomerization
and the importance of tetramers and dodecamers in the aetiology of
Alzheimer’s disease. Nat. Chem. 2009, 1, 326−331.
(116) Zheng, X.; Liu, D.; Roychaudhuri, R.; Teplow, D. B.; Bowers,
M. T. Amyloid β-Protein Assembly: Differential Effects of the
Protective A2T Mutation and Recessive A2V Familial Alzheimer’s
Disease Mutation. ACS Chem. Neurosci. 2015, 6, 1732−1740.
(117) Urbanc, B.; Betnel, M.; Cruz, L.; Bitan, G.; Teplow, D. B.
Elucidation of Amyloid β-Protein Oligomerization Mechanisms:
Discrete Molecular Dynamics Study. J. Am. Chem. Soc. 2010, 132,
4266−4280.
(118) Gu, L.; Liu, C.; Stroud, J. C.; Ngo, S.; Jiang, L.; Guo, Z.
Antiparallel Triple-Strand Architecture for Prefibrillar Aβ42
Oligomers. J. Biol. Chem. 2014, 289, 27300.
(119) Pan, J.; Han, J.; Borchers, C. H.; Konermann, L. ConformerSpecific Hydrogen Exchange Analysis of Aβ(1-42) Oligomers by TopDown Electron Capture Dissociation Mass Spectrometry. Anal. Chem.
2011, 83, 5386−5393.
(120) Reddy, G.; Straub, J. E.; Thirumalai, D. Dry Amyloid Fibril
Assembly in a Yeast Prion Peptide Is Mediated by Long-Lived
Structures Containing Water Wires. Proc. Natl. Acad. Sci. U.S.A. 2010,
107, 21459−21464.
(121) Rangachari, V.; Moore, B. D.; Reed, D. K.; Sonoda, L. K.;
Bridges, A. W.; Conboy, E.; Hartigan, D.; Rosenberry, T. L. Amyloidβ(1−42) Rapidly Forms Protofibrils and Oligomers by Distinct
Pathways in Low Concentrations of Sodium Dodecylsulfate†.
Biochemistry 2007, 46, 12451−12462.
(122) Terzi, E.; Hölzemann, G.; Seelig, J. Interaction of Alzheimer βAmyloid Peptide(1−40) with Lipid Membranes†. Biochemistry 1997,
36, 14845−14852.
(123) Rangachari, V.; Dean, D. N.; Rana, P.; Vaidya, A.; Ghosh, P.
Cause and consequence of Aβ - Lipid interactions in Alzheimer
disease pathogenesis. Biochim. Biophys. Acta, Biomembr. 2018, 1860,
1652−1662.
Q
DOI: 10.1021/acs.jpcb.9b04208
J. Phys. Chem. B XXXX, XXX, XXX−XXX