Accounting undergraduate Honors theses: A brighter future - The impact of charter school attendance on student achievement in little rock
Bạn đang xem bản rút gọn của tài liệu. Xem và tải ngay bản đầy đủ của tài liệu tại đây (779.61 KB, 27 trang )
University of Arkansas, Fayetteville
ScholarWorks@UARK
Economics Undergraduate Honors Theses
Economics
5-2012
A Brighter Future: The Impact of Charter School
Attendance on Student Achievement in Little Rock
Karen Brown
University of Arkansas, Fayetteville
Follow this and additional works at: />Part of the Economics Commons, Education Commons, and the Education Policy Commons
Recommended Citation
Brown, Karen, "A Brighter Future: The Impact of Charter School Attendance on Student Achievement in Little Rock" (2012).
Economics Undergraduate Honors Theses. 2.
/>
This Thesis is brought to you for free and open access by the Economics at ScholarWorks@UARK. It has been accepted for inclusion in Economics
Undergraduate Honors Theses by an authorized administrator of ScholarWorks@UARK. For more information, please contact ,
A Brighter Future:
The Impact of Charter School Attendance on Student Achievement in the Little Rock Area
By
Karen Marie Brown
Advisor: Dr. Amy Farmer
An Honors Thesis in partial fulfillment of the requirements for the degree Bachelor of
Science in International Business with a concentration in Economics.
Sam M. Walton College of Business
University of Arkansas
Fayetteville, AR
May 11, 2012
1
Table of Contents
I. Introduction……………………………………………………………………………….…....3
II. Charter Schools: An Overview………………………………………………………………...3
III: Literature Review……………………………………………………………………………..3
IV: Data and Methodology………………………………………………………………………..6
V: Results………………………………………………………………………………………...13
VI. Policy Implications…………………………………………………………………………..18
VII. Avenues for Further Research……………………………………………………...……….19
VIII. Conclusion……………………………………………………………………...………….19
IX: References…………………………………………………………………………..……….20
2
I. Introduction
School choice aims to enhance educational quality and to create opportunities for
students who would otherwise be deprived of a better education. Originally introduced by
economist Milton Friedman, this idea creates an educational market of public and charter
schools. Market forces will, theoretically, increase the quality of public schools because of
competition. As school choice becomes more and more popular, pressure is being exerted on the
public school system to increase quality so that the best students will not leave their schools for
private or charter institutions. This paper will narrow the field of school choice and will examine
the impact of charter schools on National Percentile Rankings (NPR) from standardized test
scores of charter and public schools in the Little Rock, Arkansas area. The study hypothesizes
that charter attendance positively impacts test score NPRs for both elementary and middle school
students. It will open with a brief introduction of charter schools and the literature surrounding
them. Then, the data and methodology used in this study will be discussed, followed by the
results. Lastly, this paper will include suggestions on charter policy based on the outcome as
well as avenues for further research.
II. Charter Schools: An Overview
The two main forms of school choice are voucher programs and charter schools.
Vouchers award a specific amount of money to successful applicants to cover all or some of the
cost of private school tuition. When the income variable is less of a consideration for parents,
economics tells us that they will choose to send their student to the best school, usually a private
school. Vouchers are considered to be the more controversial of the two forms because public
funds are used to pay student’s tuition to private, often religious schools. Private schools, in
turn, also fear that this paves the way for the government to control their curriculum. Charter
schools, or “charters”, are “publically funded, privately operated schools that families can select
outside of their zoned schools. They promise greater school-level autonomy in exchange for
greater accountability” (Loeb, Valant, Kasman, 2011). Charters are less controversial than
voucher programs because operate under a management contract in which the authorization
agency may revoke the charter and close the school if at any time it doesn’t meet its
requirements and obligations (Scholmer, Shober, Weimer, Witte, 2007).
There are two types of charter schools: conversion schools and startup schools.
Conversions initially start out as public schools and usually retain existing faculty and students.
The motivation to convert is explained by either a need to escape bureaucracy from the public
school districts or because the school does not like its mandated curriculum. Conversely, startup
charter schools are entirely new schools that “acquire facilities, faculty, and students at their
inception.” The motivation for a startup usually derives from the need to create a new “holistic
approach to schools”. Because startups tend to be more radical than their conversion
counterparts, there is a greater expected difference between startup charters and public schools
than conversions and public schools (Buddin, Zimmer, 2005).
III. Review of Literature
There is an abundance of literature on the impact of charter schools not only on student
test scores, but also the test scores of public schools, minority student, and student behavior.
Since test score gains are the most direct indicator of educational improvements, the majority of
3
research has been conducted using samples of public and charter schools. A number of studies
conclude that charter school attendance leads to some degree of positive test score gains. Studies
in Arizona (Nelson, Hollenbeck, 2001) and Boston (Abdulkadiroglu, Angrist, Dynarski, Kane,
Pathak, 2011) school districts have determined that charter attendance is positively correlated
with an increase in test scores. Another study conducted by renowned school choice researcher,
Dr. John Witte, and his colleagues which looks at longitudinal data from schools in the
Milwaukee area draws the same conclusion (Witte, Weimer, Shober, Schlomer, 2007).
Grosskopf, Hayes, and Taylor (2009) found that Texas schools have positive gains in Math and
Reading scores, in which they measured the “value added” to standardized test scores. MacIver
and Farley-Ripple declare strong support for the charter school system in Baltimore and say that
the city’s Knowledge is Power Program (KIPP) charter schools have shown high achievement
levels that have greatly surpassed their Baltimore City Public School System (BCPSS)
counterparts. Lastly, Curto and Fryer (2011) found that attendance of SEED schools (a
combination of a charter school and a five-day-a-week boarding school) increase achievement by
0.189 standard deviations in Reading test scores and 0.230 in Math test scores per attendance
with over an 18% return on investment. It is also important to note that SEED schools have a
lottery-based admissions system and are therefore less susceptible to selection bias.
Despite the plethora of studies which conclude that charter attendance leads to positive
test scores gains, there have also been a significant amount of studies which have concluded just
the opposite. Two separate analyses of Michigan charter schools found that students do not
reach the same level of achievement as their public school counterparts by 2-9% in Reading,
Writing, Math, and Science standardized test scores. In their models, the researchers controlled
for student, building, and district characteristics. However, they note that they did not account
for selection bias in their study (Eberts, Hollenbeck, 2001). Bettinger (2005) also uses schoollevel data from Michigan to conclude that test scores are negatively affected. In a paper titled
“Explaining Charter School Effectiveness”, the authors go as far as to generalize that all nonurban charters are ultimately ineffective because of school-level homogeneity (Angrist, Pathak,
Walters, 2011).
Given that economists have drawn conclusions on both sides of the spectrum, declaring that
charters lead to positive and negative test scores effects, it would be logical to assume that there
are a number of “mixed effects” conclusions, which several do. In the paper “Student
Achievement in Charter Schools in San Diego”, Tang (2007) finds that charter attendance results
in the same gains as public schools overall with the exception of elementary charter Math and
Reading score, which drop significantly. Another group of researchers believe that test score
gains are possible, but only over a certain period of time. Studies conducted in Wisconsin, New
Jersey, and Florida have all suggested that although charter scores may start off lower than or
equal to public scores, “performance improves as the charter schools gain experience” (Barr,
2007). When analyzing Florida schools, Sass (2006) supports this claim and found that
achievement for charters improves after five years and proposes that market forces due to
competition may lead to these gains.
If charter schools do in fact have a positive impact on test scores, it seems to be most
observable in an urban setting. Several studies suggest that urban areas are the only place which
charters can make a significant positive impact. The paper “Explaining Charter School
Effectiveness” states “estimates using admissions lotteries suggest that urban charter school
boost student achievement, while charters in other setting do not.” Angrist, Pathak and Walters
reach also this conclusion after studying student and school-level data from schools throughout
4
Michigan. Zimmer and Buddin propose that this might be the case simply because of
demographics. Urban charters tend to serve the most “disadvantaged students” and therefore are
more effective because of their impact on below-average achievers.
The objective of charter schools in not only to provide an alternative means of a quality
education, but to service those who have less access to it. In “Are High Quality Schools Enough
to Increase Achievement Among the Poor?” Dobbie and Fryer use data from Harlem Children’s
Zone, an experimental program which combines community programs and charter schools. They
find that achievement effects are large enough to close the racial gap in elementary, middle, and
high schools and believe that “high quality schools are enough to significantly increase academic
achievement among the poor”. In another study by Fryer, he urges policy-makers to “take these
examples to scale” so that they may have a significant positive impact on the disadvantaged
communities throughout the country. Just as with overall charter achievement, there are skeptics
who believe charters actually increase the racial gap between whites and minorities. In a
scathing paper titled “No Excuses: A Critique of the Knowledge is Power Program (KIPP)
within Charter Schools in the USA”, the author Brian Lack argues that KIPP fosters capitalistic
and militaristic ideals that preserve the “status quo” and “institutionalized racism” (Lack). North
Carolina charter schools are shown to further segregate white and black students. Bifulco and
Ladd used time-series data to track the test scores of individual students and find that charter
schools “increase racial isolation for both black and whites…and [widen] the achievement gap”.
They believe this may be because of asymmetric preferences of each race to attend the charter
school where they are the majority. This may explain why there are so few racially balanced
charter schools (Bifulco, Ladd). Enrollment of minorities in charters is also the main subject of
many other research papers. Along the same lines as the study of North Carolina charter schools,
data from 1,006 charter schools households in Texas find that race is a good predictor of parents
choose to send their students to a charter school or not. Tedin and Weiher support this argument
and say that “Whites, African-Americans, and Latinos transfer into charters schools where there
is a 11-14% more of that ethnic group in the student body”. One paper pushes the segregation
issue even further and proposes that black enrollment in charters is a function of public school
district segregation and state policy which determines school choice legislation. In “Choice,
Charter Schools, and Household Preferences”, Kleitz and Bretten point out that although there
are differences in school choice among races and socio-economic strata, they do not show a
difference in the concern for academic excellence.
While most researchers of charter schools focus on more debated topics such as
achievement gains, others concentrate on the externalities of these schools. Impacts on the
surrounding public schools and student behavior are the most discussed externalities. Renowned
economist Milton Friedman believed that the introduction of school choice will create a market
for education and competitive pressures will force public schools to increase their quality.
Numerous studies have shown that charter schools have a positive impact on the test scores of
public schools in surrounding areas (Booker, Gilpatric, Gronberg, Jansen). North Carolina
public school test scores are shown to have increased by 1% after the introduction of charters
(Holmes, DeSimone, Rupp). Evidence from Michigan and Arizon has also found that charters
may lead to the same effect. Nevertheless, other researchers have concluded that charters may
cause public school test scores to decline because they drain resources. In Arizona, the studentteacher ratio increased by 6% after charters enticed teachers to work in the more flexible charter
environment (Dee, Fu). One paper proposes that public schools become less efficient as
resources and taken away (Ni).
5
IV. Data and Methodology
To determine if charter attendance has a significant impact of test score NPRs for both
elementary and middle school students, I employ the Ordinary Least Squares (OLS) estimation
procedure. The intercept parameter “β1” denotes that the dependent variable “Test Score” will
not take a value of zero if all other independent variables are controlled for. The charter dummy
variable is used as an intercept dummy variable where:
Regression 1:
E(Test Score NPR)i = (β1 + δ) + β2(%FLP)i + β3(%White)i + β4(%Black)i + β5(%Other
Minority)i + β6(School English Language Learner) + β7(School Poverty Index) + εi, when C=1
and,
E(Test Score NPR)i = β1 + β2(%FLP)i + β3(%White)i + β4(%Black)i + β5(%Other
Minority)i + β6(School English Language Learner)i + β7(School Poverty Index) + εi, when C=0.
When C=0, it will denote that a particular school is a public school (or a “non-charter”)
and will be the base group for the models, while a C=1 will denote that a school is a “charter”
school. Therefore if δ is significant, it will offer evidence that charter schools to have an impact
on the test score NPR of a given subject. It is important to note that the Least Squares
Estimator’s properties are not affected by the intercept dummy variable. Because “School
Percent White”, “School Percent Black” and “School Percent Hispanic” and “Percent Other
Minority” would all equal to one and “Percent Overall School Minority” would be equal to 1“School Percent White”, I omitted the “School Percent Hispanic” and “School Percent Overall
Minority” variables in each of the equations to mitigate multi-collinearity. Collinearity is where
economic variables move together in systematic ways. To compensate for this, any significance
in “School Percent Hispanic” will be present in the β1 intercept variable.
Next, I use a more refined regression to determine if poverty significantly impacts test
score NPRs in all subjects. These two models throw out all race independent variables as well as
“School English Language Learner”, only using “School Poverty Index” and “Percent Free
Lunch Program”. The two did not show signs of collinearity, so they are both used in the model.
Regression 2:
E(Test Score NPR)i = (β1 + δ) + β2(%FLP)i + β3(School Poverty Index) + εi, when C=1
and,
E(Test Score NPR)i = β1 + β2(%FLP)i + β3(School Poverty Index) + εi, when C=0.
Thirdly, this study uses two other models to determine if being a minority significantly
impacts test score NPRs in all subjects. The use of “Overall Minority” as a collective group can
point towards selection bias in charter schools, which will be discussed in more detail later in
this section.
6
Regression 3:
E(Test Score NPR)i = (β1 + δ) + β2(%Overall Minority)i + εi, when C=1 and,
E(Test Score NPR)i = β1 + β2(%Overall Minority)i + εi, when C=0.
The final two models employed in this study take into account both poverty and overall
minority variables. Unlike the previous regressions, the charter data for both of these models are
separated into “poor-performing charters” (Regression 4) and “well-performing charters”
(Regression 5). If all other independent variables are controlled for, these models determine how
the charter variable impacts these charter categories.
Regressions 4 and 5:
E(Test Score NPR)i = (β1 + δ) + β2(%FLP)i + β3(%Overall Minority)i + β4(School
Poverty Index) + εi, when C=1 and,
E(Test Score NPR)i = β1 + β2(%FLP)i + β3(%Overall Minority)i + β4(School Poverty
Index) + εi, when C=0.
The school-level data used for this analysis is provided by the University of Arkansas
Office for Educational Policy. The data set includes all public and charter schools in the Little
Rock, North Little Rock, and Pulaski school districts for the 2010-2011 academic year. The “test
score NPR” data used in the study is taken from the Iowa Test of Basic Skills (ITBS) exam as a
Norm-Reference Test for all of the schools used in the data set. The ITBS is administered in
conjunction with the Arkansas Criterion-Referenced Exam (CRT) to form the augmented
benchmark examination. The ITBS contains subtests in Reading, Mathematics, Language, and
Science. Table 1 shows all of the variables used in this paper.
Table 1: Definitions of all Variables
Variable
School Name
District Name
Charter
Reading NPR
Math NPR
Description
School name
School district name
A value of “1” denotes that a school is a
Charter and a value of “0” denotes that a
school is a public school.
School National Percentile Rank (NPR) on the
reading subject area of the Iowa Test of Basic
Skills (ITBS).
School National Percentile Rank (NPR) on the
math subject area of the Iowa Test of Basic
Skills (ITBS).
7
Language NPR
Science NPR
Overall NPR
% FRL
School Poverty Index
% White
% Hispanic
% Black
% Other Races
% Overall Minority
% English Language
Learner
School National Percentile Rank (NPR) on the
language subject area of the Iowa Test of Basic
Skills (ITBS).
School National Percentile Rank (NPR) on the
science subject area of the Iowa Test of Basic
Skills (ITBS).
Overall School National Percentile Rank
(NPR) is the average of the Normal Curve
Equivalent for each ITBS Subtest (Reading,
Math, Language, and Science).
The actual percentage of students in each
school who qualify for the Free and Reduced
School Lunch Program.
The Poverty Index Range is a poverty indicator
which gives a greater weight to students with
greater need.
Percent of students who identify as White.
Percent of students who identify as Hispanic.
Percent of student who identify as Black.
Percentage of students who identify by another
race that is not stated above.
Percent of overall minority (non-white)
students.
Percent of students who identify as English
Language Learner.
Charter students are not a random sample of public school students. They usually enroll
as disproportionate amount of either low-achieving and at-risk student or more astute students
who seek the freedom or rigorous environment of charter schools (Buddin, Zimmer, 2005).
Therefore a difference in test score NPRs may largely be attributed to selection bias within
charters. This model will control for “% FLP”, “School Poverty Index”, “% White”, “Percent
Black”, “% Other Minority, “% English Language Learner” in order to determine if the
“Charter” variable significantly impacts test scores. This paper hypothesizes that attendance of a
charter significantly impacts student test score NPRs due to selection bias. An initial comparison
shows that charter schools have significantly different demographics, which suggests that
selection bias is occurring. Tables 2, 3, and 4 below are the charter’s standard deviations for
each racial variable:
Table 2: Elementary Charter School Standard Deviation for Race Variables
Elementary School
Name
Arkansas Virtual
Academy
Standard
Deviation of
“% White”
2.07
Standard
Deviation of
“% Black”
-1.92
8
Standard
Deviation of “%
Hispanic”
-0.69
Standard
Deviation of “%
Overall
Minority”
-2.07
Dreamland Academy
eStem Elementary
Charter
Lisa Academy
-1.14
0.41
1.33
-0.45
-0.08
-0.32
1.14
-0.41
0.86
-0.93
-0.32
-0.86
Table 3: Middle Charter School Standard Deviation for Race Variables
Middle School Name
Arkansas Virtual
Academy
Cloverdale
Aerospace
Covenant Keepers
Charter
eStem Middle
Charter
Lisa Academy
Ridgeroad Charter
Standard
Deviation of
“% White”
2.74
Standard
Deviation of
“% Black”
-2.46
Standard
Deviation of “%
Hispanic”
-0.63
Standard
Deviation of “%
Overall Minority
-2.74
-1.08
-0.75
1.78
1.08
-1.16
0.32
3.70
1.16
0.45
-0.45
-0.31
-0.45
-0.02
-0.78
-1.44
0.79
0.17
0.49
0.02
0.78
Table 4: Elementary and Middle Public School Standard Deviation for Race Variables
Public
Schools
Standard
Deviation of “%
White”
0.26
Elementary
Middle
0.20
Standard
Deviation of “%
Black”
0.25
0.20
Standard
Deviation of “%
Hispanic”
0.08
Standard Deviation
of “% Overall
Minority”
0.26
0.03
0.20
The standard deviations for each race variable disproportionately high for both
elementary charters and middle school charters. The highest standard deviation for public
elementary and middle schools are only 0.26 and 0.20, respectively. This is in complete contrast
to charter schools, which have standard deviations up to 2.74. Although almost all of the
charters have high standard deviations in all race variables, eStem Elementary and Middle
schools have consistently low deviations. These values, however, are not as low as the highest
public school standard deviation. Lisa Academy also has particularly low standard deviations for
“% White”, ‘% Hispanic”, and “% Overall Minority”. We can conclude then that public schools
have consistent demographics and charter schools tend to have skewed demographics.
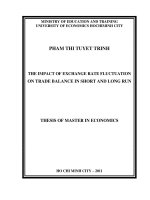
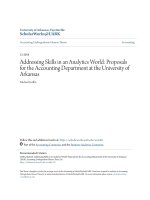
In an initial comparison of charter and non-charter mean Subtest NPRs, elementary and
middle school charter students consistently surpass their non-charter counterparts (Figures 1 and
2). The exception to this trend is the mean NPR of the Language Subtest in which the non-
9
charter elementary students outperformed the elementary charters by 2 percentage points, as
shown by Figure 1.
Figure 1: Elementary School Charter vs. Non-Charter Mean NPR Scores
National Percentile Score
60
56
50
51 50
50
55
48 50
52 50
45
40
30
Charter
20
Non-charter
10
0
Reading
Math Language Science Overall
Subtest
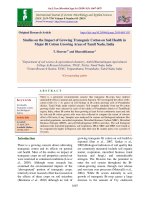
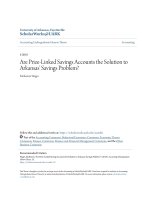
Figure 2: Middle School Charter vs. Non-Charter Mean NPR Scores
National Percentile Score
60
50
40
44
37
46
42
42
38
48
44
44
39
30
20
Middle Charter
10
Middle Non-charter
0
Subtest
The mean test score NPR between charters and non-charters above demonstrate their
marked difference as a collective group. Statistical analysis shows that each charter schools has
a significantly variance from the mean, the most extreme standard deviation being -2.01 and the
least being -0.56. The chart below gives these values for each charter school:
10
Table 5: Elementary Charter School Test Score NPR Standard Deviation
Elementary Charter School
Arkansas Virtual Academy
Dreamland Academy
eStem Elementary School
Test Score NPR Standard Deviation
0.95
-2.01
0.88
Table 6: Middle Charter School Test Score NPR Standard Deviation
Middle Charter School
Arkansas Virtual Academy
Cloverdale Aerospace
Covenant Keepers
eStem Middle School
Lisa Academy
Little Rock Prep
Ridgeroad Middle
Test Score Standard Deviation
1.70
-1.02
-0.69
0.91
1.37
-0.69
-0.56
A deeper look into specific schools in the Little Rock area shed light on the magnitude of
their selection bias. A total of eight different charter school systems were used in this data set:
Arkansas Virtual Academy, Cloverdale Aerospace, Covenant Keepers Schools, Dreamland
Academy, eStem Schools, Lisa Academy, Little Rock Preparatory Academy, and Rigdewood
Charter. Some of these schools contained different schooling cohorts within them, such as the
Arkansas Virtual Academy Elementary School and the Arkansas Virtual Academy Middle
School. This paper will look for specifically at Arkansas Virtual Academy Middle School,
Dreamland Academy, and eStem Schools to point out selection bias in the charter school system.
Arkansas Virtual Academy (ARVA) is a particularly unusual case because it is an online
charter school which serves grades K-8. The school has a first-come, first-serve policy for open
enrollment. When there are more applications than slots available for the year, they use a lottery
system to determine who will be admitted. Attendance, daily lessons, and interaction with
teacher are all online. ARVA stresses its flexibility because students set their own pace. Below
are individual statistics for Arkansas Virtual Academy Middle School:
Table 7: Arkansas Virtual Academy Statistics
Reading NPR
Math NPR
Language NPR
Science NPR
Overall NPR
Overall NCE
75
62
58
76
67
59.2
% FLP
School Poverty Index
% White
% Hispanic
% Black
% Overall Minority
11
0%
0%
94%
3%
3%
6%
Arkansas Virtual Academy distinguishes itself from other public charters in the Little
Rock area because of the exceptional test score NPRs its students receive on all subjects. The
school has an overall NPR score of 67 while the mean NPR score of all middle schools in the
Little Rock area is 41, lying at 1.70 standard deviations away from the mean.
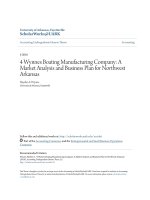
Figure 3: Overall NPR Score Distribution for Middle School
7
6
ARVA
Frequency
5
4
3
2
1
0
-2
-1.5
-1
-0.5
0
0.5
1
1.5
2
Standard Deviation from the Mean
ARVA not only has outlying test score NPRs, but demographics as well. For the 20102011 school year, 94% of the 67 students enrolled were White, where as only 6% of the student
body identified as being a minority (3% Black and 3% Hispanic). This figure is far from the
mean overall minority statistic in the other charter and non-charters. The mean percentage
minority within middle schools in the area is 72% and the mean percentage White is 28%. No
students attending ARVA during the 2010-2011 were eligible for the Free Lunch Program, in
direct contrast to other schools, whose mean percentage of student eligible for the Program was
67%. Similarly, the School Poverty Index at Arkansas Virtual Academy was 0% while other
schools have a mean of 126%. ARVA’s Index is 2.51 standard deviations from the mean.
Dreamland Academy of Performing and Communication Arts is another example of an
outlying school. Contrary to ARVA however, Dreamland Academy has exceptionally poor
scores in all subject areas and has an overwhelmingly minority population. The school serves K5 and enrolled 264 students for the 2010-2011 school year. Below are individual statistics for
Dreamland Academy:
Table 8: Dreamland Academy Statistics
Reading NPR
Math NPR
Language NPR
Science NPR
Overall NPR
Overall NCE
19
20
17
22
19
31.5
% FLP
School Poverty Index
% White
% Hispanic
% Black
% Overall Minority
12
98%
188%
3%
8%
89%
97%
Dreamland Academy lags far behind both non-charter and charter elementary schools in
all test subjects. It has an overall NPR score 19 and is -2.01 standard deviations away from the
mean test score of 47.
Frequency
Figure 4: Overall NPR Score Distribution for Elementary School
20
18
16
14
12
10
8
6
4
2
0
Dreamland
-2
-1.5
-1
-0.5
0
0.5
1
1.5
2
Standard Deviation from the Mean
Dreamland’s School Poverty Index and percentage of students who quality for the Free
Lunch Program are overwhelmingly high, at 188% and 98% respectively. Like ARVA, the
school also has skewed demographics, but in the opposite direction. 97% of the school is
minority students, which is 25% higher than the mean.
This initial analysis of the data now shows us that charter schools have skewed
demographics and social-economic data as compared to their public school counterparts,
pointing to selection bias. Their mean test score NPRs also have a tendency to be higher. Now
the question is: Does charter attendance have a positive significant impact on both disadvantaged
and well-performing students?
V. Results
The most desired outcome is one in which the significant charter variables have a positive
coefficient for all regressions, ceteris paribus. Below are the results for each of the Regressions
and broken up my elementary and middle school cohorts. The values contain the coefficient as
well as the t-statistic in parenthesis for each variable.
13
Table 9: Regression Results for Reading Subtest
Regression 1
Elem. Middle
-11.65 3.42
(3.57) (4.85)
Regression 2
Elem. Middle
-12.29 1.36
(3.2)
(13.5)
Regression 3
Elem. Middle
-1.06
8.55
(5.4)
(4.1)
Regression 4
Elem. Middle
-17.29 5.19
(6.0)
(4.4)
Regression 5
Elem. Middle
-10.64 -6.55
(3.9)
(7.2)
% FLP
5.01
(39.1)
60.70
(89.2)
-3.95
(36.5)
6.97
(78.8)
-
-
-16.2
(38.4)
3.07
(91.7)
-2.31
(36.7)
37.50
(89.2)
% School
Poverty
Index
% White
-29.31
(19.8)
-50.90
(44.0)
-25.69
(18.2)
-33.55
(40.1)
-
-
-20.24
(19.3)
-31.00
(45.8)
-27.28
(18.4)
-57.77
(45.5)
23.64
(30.8)
174.88
(84.4)
-
-
-
-
-
-
-
-
% Black
25.58
(28.8)
148.77
(80.0)
-
-
-
-
-
-
-
-
% Other
Races
40.51
(39.0)
213.65
(95.0)
-
-
-
-
-
-
-
-
% Overall
Minority
-
-
-
-
-44.17
(4.7)
-55.21
(7.8)
2.067
(4.8)
-9.39
(17.0)
2.83
(4.8)
7.27
(13.7)
% English
Language
Learner
Intercept
13.19
(30.1)
219.08
(91.0)
-
-
-
-
-
-
-
-
62.52
(30.3)
-96.25
(85.0)
88.09
(2.6)
76.06
(4.7)
79.94
(3.4)
76.46
(5.9)
88.11
(2.8)
82.12
(7.7)
87.14
(2.7)
81.09
(6.7)
Variable
Charter
Table 10: Regression Results for Math Subtest
Regression 1
Variables Elem. Middle
-14.44 -0.32
Charter
(3.06) (7.6)
Regression 2
Regression 3
Regression 4
Elem. Middle Elem. Middle Elem. Middle
-16.54 1.12
-5.92 6.17
-15.25
7.22
(2.7)
(4.6)
(4.6)
(4.8)
(4.9)
(5.7)
Regression 5
Elem.
Middle
-16.09 -12.18
(3.3)
(10.5)
% FLP
-16.35
(33.5)
172.09
(139.0)
-17.24
(31.5)
58.05
(114)
-
-
-41.69
(31.6)
4.26
(120.0)
-17.3
(31.6)
94.94
(131.0)
% School
Poverty
Index
-13.56
(17.0)
-91.47
(68.6)
-18.36
(15.7)
-53.90
(58.0)
-
-
-3.851
(15.9)
-24.46
(59.7)
-16.21
(15.9)
-88.59
(66.9)
14
% White
26.23
(26.4)
284.08
(131.4)
-
-
-
-
-
-
-
-
% Black
17.59
(24.7)
227.85
(125.8)
-
-
-
-
-
-
-
-
% Other
Races
47.52
(33.4)
253.08
(148.0)
-
-
-
-
-
-
-
-
%
Overall
Minority
%
English
Language
Learner
Intercept
-
-
-
-
-45.60 -44.41
(4.0)
(9.1)
-6.512
(3.9)
-21.04
(22.2)
-5.158
(4.1)
16.42
(20.2)
16.04
(25.7)
367.37
(141.7)
-
-
-
-
-
-
-
-
59.60
(26.8)
202.61
(134.4)
87.58
(2.2)
71.14
(6.9)
80.79
(2.9)
73.04
(6.9)
89.85
(2.3)
85.27
(10.1)
88.16
(2.3)
78.84
(9.8)
Table 11: Regression Results for Language Subtest
Variable
Charter
Regression 1
Regression 2
Regression 3
Regression 4
Regression 5
Elem. Middle Elem. Middle Elem. Middle Elem. Middle Elem. Middle
-20.4 -0.98
-19.9 -0.01
-8.29 5.70
-17.72 2.82
-21.5 -14.7
(3.74) (4.5)
(3.3) (3.0)
(5.5) (4.2)
(6.1)
(3.6)
(4.1) (5.6)
% FLP
-54.9 18.38
(40.9) (82.5)
-57.2 -7.71
(38.4) (75.0)
-
-
-88.48
(39.0)
-62.15
(73.7)
-58.1 -25.3
(38.8) (70.8)
% School
Poverty
Index
% White
-0.53 -32.64
(20.7) (40.7)
0.56
-18.42
(19.2) (38.2)
-
-
14.425 -5.09
(19.0) (36.7)
-0.93 -31.9
(19.5) (36.0)
3.77
118.45
(32.3) (78.3)
-
-
-
-
-
-
-
-
% Black
8.12
117.51
(30.1) (74.6)
-
-
-
-
-
-
-
-
% Other
Races
27.93 172.27
(40.8) (88.1)
-
-
-
-
-
-
-
-
% Overall
Minority
-
-
-
-44.3
(4.9)
-36.90
(8.2)
2.4911 17.89
(4.9)
(14.1)
4.119
(5.1)
34.15
(10.9)
-
15
% English
Language
Learner
Intercept
-9.16 178.02
(31.4) (85.4)
-
-
-
-
-
-
84.21 -51.78
(32.7) (78.7)
90.24
(2.7)
66.88
(4.5)
79.48
(3.5)
63.60
(6.1)
92.248 74.83
(2.8)
(6.2)
-
-
90.15
(2.9)
72.49
(5.3)
Table 12: Regression Results for Science Subtest
Variable
Charter
Regression 1
Regression 2
Regression 3
Regression 4
Regression 5
Elem. Middle Elem. Middle Elem. Middle Elem. Middle Elem. Middle
-9.77
-1.78
-7.07 1.13
1.33
8.18
-7.254 6.37
-5.09 -13.58
(3.99) (5.62) (3.9) (3.5)
(5.5) (5.0)
(6.3)
(4.5)
(4.9) (7.3)
% FLP
8.37
(39.8)
21.22
30.76 30.83
(105.0) (40.5) (87.8)
-
-
22.137 -20.85
(40.1) (93.4)
30.76 9.7412
(39.3) (96.1)
% School
Poverty
Index
% White
-30.21
(20.2)
-39.64
(52.0)
-44.5 -46.81
(20.2) (44.7)
-
-
-34.38
(20.1)
-31.12
(46.9)
-38.7 -54.54
(19.7) (49.3)
-54.26
(30.9)
97.36
(96.8)
-
-
-
-
-
-
-
-
% Black
-61.80
(28.9)
84.27
(92.3)
-
-
-
-
-
-
-
-
% Other
Races
-58.51
(39.3)
137.15 (109.0)
-
-
-
-
-
-
-
-
-
-
-51.9
(4.3)
-55.48
(9.7)
-13.83
(5.1)
5.93
(17.5)
-13.3
(5.1)
22.895
(14.4)
174.53 (106.0)
-
-
-
-
-
-
-
82.27
(5.2)
80.35
(3.1)
82.33
(7.2)
85.604 93.59
(2.9)
(7.7)
85.0
(2.9)
90.66
(6.9)
% Overall
Minority
% English
Language
Learner
Intercept
-78.39
(30.3)
139.72 -11.13
(31.4) (97.4)
83.82
(2.8)
16
Table 13: Regression Results for Overall NPRs
Variable
Charter
Regression 1
Regression 2
Regression 3
Regression 4
Regression 5
Elem. Middle Elem. Middle Elem. Middle Elem. Middle Elem. Middle
-15.1 0.535
-15.7 1.24
-4.57 7.38
-16.19 6.045
-14.9 -10.6
(3.19) (5.5)
(2.8) (3.7)
(5.0) (4.4)
(5.2)
(4.9)
(3.5) (8.5)
% FLP
-21.2 55.57
-24.3 29.52
(34.9) (101.0) (32.0) (92.2)
-
-
-46.84
(33.0)
-7.31
-28.3 44.33
(102.0) (33.1) (106.0)
% School
Poverty
Index
% White
-14.9 -46.54
(17.7) (50.0)
-15.5 -42.05
(16.0) (46.9)
-
-
-4.124
(17.0)
-25.7
(51.0)
-12.6 -64
(16.6) (54.0)
16.33 166.62
(27.5) (95.8)
-
-
-
-
-
-
-
-
% Black
15.04 141.25
(25.7) (91.7)
-
-
-
-
-
-
-
-
% Other
Races
36.53 220.65 (34.8) (108.0)
-
-
-
-
-
-
-
% Overall
Minority
-
-
-
-45.2
(4.4)
-48.59
(8.4)
-1.255
(4.2)
-8.25
(18.9)
-1.41
(4.4)
16.03
(16.3)
% English
Language
Learner
Intercept
4.85
238.73 (26.8) (103.0)
-
-
-
-
-
-
-
70.37 -90.37
(27.9) (96.4)
72.91
(5.6)
80.18
(3.2)
73.29
(6.4)
90.068 83.14
(2.4)
(8.6)
88.27
(2.4)
79.72
(7.9)
-
88.59
(2.3)
The first regression takes all independent variables into account: the “Charter” dummy
variable, “% FLP”, “School Poverty Index”, “% White”, “% Black”, “%Other Race”, and “%
English Language Learner”. When controlling for all variables besides the dummy variable,
“Charter” is significant in elementary schools. All test subject NPRs for elementary, however,
have a negative coefficient, suggesting that the charter variable has a negative impact on test
score NPRs. None of the middle school charter coefficients for any subject are significant.
However the race variables are significant and positive in the middle school model and
particularly in Reading, Math, and Overall NPR. This suggests that race is positively correlated
to test scores in middle. This is explored further in the following paragraphs.
The second regression analyzes what affect the poverty variables, “%FLP” and “School
Poverty Index”, have on test score NPRs. As with Regression 1, the Regression 2 elementary
school charter variable is significant but negative, meaning that attending a charter negatively
17
impacts test scores when controlling for poverty measures. The Regression 2 middle school
charter variable is positively correlated to test scores in all subjects, but none are significant at a
0.05 alpha level.
The third regression uses only the “Charter” dummy and “% Overall Minority” as
independent variables. Controlling for “% Overall Minority”, the Charter variables are
insignificant for both elementary and middle. However, with the exception of Science test score
NPRs elementary charter variables have negative coefficients and middle charter variables have
positive coefficients. That is to say that charter attendance has a positive impact on test scores
when being a minority is taken into account. This is consistent with finds in Regression 1 middle
school which suggest that race and test scores are positively correlated.
Regressions 4 and 5 use “Charter”, “% FLP”, “School Poverty Index”, and “% Overall
Minority” as independent variables. Regression 4 elementary and middle use charter data only
from the poorer performing charters: Dreamland Elementary School, Cloverdale Aerospace
Middle School, Covenant Keepers Middle School, and Ridgeroad Middle School. Regression 5
uses charter data only from the better performing charters: Arkansas Virtual Academy
elementary and middle Schools, eStem Elementary and Middle Schools, and Lisa Academy
elementary and middle Schools. Given that Regression 4 takes data from the poorer performing
schools, we would expect the Charter independent variable to have a large significant impact on
test scores, relative to the better performing schools. Similarly, we would expect the charter
variable to positively impact test scores in the better performing schools, but to a lesser degree.
All Regression 4 and 5 elementary charter variables are significant, expect for Science. The
coefficients are negative however, meaning that for elementary schools, charter attendance has a
bad impact on test scores regardless of whether the school performs well or not. All but one of
the middle school charter variables is significant. It is important to note that the charter
coefficients for poorer performing Middle schools are positive and have an impact on test score
NPRs. Conversely, the middle school charter variable has a negative impact on test scores in
better performing schools.
All of the regressions as a whole point to the fact that charter attendance negatively
impacts all test score performance in elementary schools. Middle school charters have a positive
impact on test score NPRs when using poverty and minority variables, as demonstrated by
Regressions 2 and 3. Regressions 4 and 5 show that charters have a greater impact on test scores
in poorer performing schools and a negative impact on schools that perform better.
VI. Policy Implications
The results from this study have vastly different policy implication for elementary and
middle school students. Given that charters have a negative impact on test score NPRs for
elementary students, these charters must be either improved upon or shut down, depending on
the specific school. As discussed in the Literature Review section, some researchers believe that
charters experience an initially drop in test scores and then bounce back after a few years.
Although this may be the case for some elementary schools, other may need to revise their
curriculum on implement drastic changes to improve result.
The outcome from the previous section tells a vastly different story for middle school
charter students. Regressions show that charter attendance has a positive impact on test scores of
this cohort in poor performing schools and a negative impact in good performing schools.
Charter policy should therefore be aimed at “low-achieving” or “at-risk” students and not toward
students that are “high-achieving”. As demonstrated earlier in the “Data and Methodology
18
section”, the poorer performing charters have a disproportionally high poverty and minority
levels. Charter resources should be channeled to meet their needs and that provide this group
with more equal and better educational opportunities, just as Milton Friedman had intended.
VII. Avenues for Further Research
As is always the case with research, there are numerous areas to improve this study to
generate more accurate results. The data set used in the paper only contains variables for the
2010-2011 academic year. To further assess the impact of charters on test scores, future research
should use longitudinal data over as long of a period of time as possible. The use of long-term
data will help researchers better determine the long-term effects of charter schools. As stated in
the Literature Review section, some studies conclude that charter’s test scores initially drop
when the school is opened, but then improve over time as the school “learns”. Analyses about
charters over time may have an impact on policy decisions. The findings may have an effect on
curriculum, student admissions, location, resources available, etc.
Other researches on this topic may also consider including other independent variables
that impact test scores such as student background, building characteristics including its location
within the city, and whether the charter is a start-up or a conversion. Witte and Weimer’s (2007)
analysis of Wisconsin charter schools takes student-teacher ratios and percent of disabled
students, and an indicator if the schools itself is “at-risk”. The use of these variables will create a
more accurate model and results.
The model would be greatly improved if the sample size of charters in Little Rock was
greater. The number of charters has not increased rapidly, but increasing the size of the area the
samples are taken from was expanded, more charter data could be available. Another option is to
take charter school data from other large and similar cities within Arkansas. If the study were to
control for location, there will be more charter data. More data will also mitigate variances.
Lastly, this study only takes into account the direct impact charter attendance has on test
scores. More in-depth studies have the potential to analyze the externalities cause by charter
policy. This can include impact on public school test scores, student teacher-ratio, resources and
budgets as well as charter student behavior and attendance. Charter may also have an indirect
impact on the economy of the area around the school, both immediately and over the decades.
VIII. Conclusion
Charter schools, as a form of school choice, are a gateway to better educational quality
and equality. An analysis of the data shows that charters have a wider variance of poverty and
minority demographics than their public school counterparts, pointing to selection bias. This
study of charter and public schools in the Little Rock area concluded that charter attendance
negatively impacts elementary test scores and middle school scores in charter that serve higherachieving students. However, charter attendance has a positive impact on middle schools with
disadvantaged students. This implies that charter policy should be shaped towards serving “atrisk” students in more racially diverse communities. It is worth noting that although charter
schools as a form of school choice does not positively impact all students, it impacts those who
might not have an equal opportunity for a better education. The results demonstrate that charters
are an endeavor worth pursuing for those in need.
19
References
Abdulkadiroglu, A., Angrist, J. D., Dynarski, S. M., Kane, T. J., & Pathak, P. A. (2011).
Accountability and flexibility in public schools: Evidence from boston's charters and pilots.
Quarterly Journal of Economics, 126(2), 699-748.
Abdulkadiroglu, A., Angrist, J., Dynarski, S., Kane, T. J., & Pathak, P. (2009). Accountability
and flexibility in public schools: Evidence from boston's charters and pilots. Unpublished
manuscript.
Angrist, J. D., Pathak, P. A., & Walters, C. R. (2011). Explaining charter school effectiveness.
Unpublished manuscript.
Angrist, J. D., Pathak, P. A., & Walters, C. R. (2011). Explaining charter school effectiveness.
Unpublished manuscript.
Barr, J. (2007). Charter school performance in new jersey. Unpublished manuscript.
Bettinger, E. P. (2005). The effect of charter schools on charter students and public schools.
Economics of Education Review, 24(2), 133-147.
Bifulco, R., & Ladd, H. F. (2007). School choice, racial segregation, and test-score gaps:
Evidence from north carolina's charter school program. Journal of Policy Analysis and
Management, 26(1), 31-56.
Bifulco, R., & Ladd, H. F. (2007). School choice, racial segregation, and test-score gaps:
Evidence from north carolina's charter school program. Journal of Policy Analysis and
Management, 26(1), 31-56.
20
Booker, K., Gilpatric, S. M., Gronberg, T., & Jansen, D. (2007). The impact of charter school
attendance on student performance. Journal of Public Economics, 91(5-6), 849-876.
Booker, K., Gilpatric, S. M., Gronberg, T., & Jansen, D. (2008). The effect of charter schools on
traditional public school students in texas: Are children who stay behind left behind?
Journal of Urban Economics, 64(1), 123-145.
Buddin, R., & Zimmer, R. (2005). Student achievement in charter schools: A complex picture.
Journal of Policy Analysis and Management, 24(2), 351-371.
Carpenter,Dick M.,,II, & Noller, S. L. (2010). Measuring charter school efficiency: An early
appraisal. Journal of Education Finance, 35(4), 397-415.
Curto, V. E., & Fryer, R. G., Jr. (2011). Estimating the returns to urban boarding schools:
Evidence from SEED. Unpublished manuscript.
Dee, T. S., & Fu, H. (2004). Do charter schools skim students or drain resources? Economics of
Education Review, 23(3), 259-271.
Dobbie, W., & Fryer, R. G., Jr. (2011). Are high-quality schools enough to increase achievement
among the poor? evidence from the harlem children's zone. American Economic Journal:
Applied Economics, 3(3), 158-187.
Dobbie, W., & Fryer, R. G., Jr. (2011). Are high-quality schools enough to increase achievement
among the poor? evidence from the harlem children's zone. American Economic Journal:
Applied Economics, 3(3), 158-187.
21
Eberts, R. W., & Hollenbeck, K. (2001). An examination of student achievement in michigan
charter schools. Unpublished manuscript.
Eberts, R. W., & Hollenbeck, K. (2002). Impact of charter school attendance on student
achievement in michigan. Unpublished manuscript.
Fryer, R. G., Jr. (2010). Racial inequality in the 21st century: The declining significance of
discrimination. Unpublished manuscript.
Garcia, D. R., McIlroy, L., & Barber, R. T. (2008). Starting behind: A comparative analysis of
the academic standing of students entering charter schools. Social Science Quarterly, 89(1),
199-216.
Glomm, G., Harris, D., & Lo, T. (2005). Charter school location. Economics of Education
Review, 24(4), 451-457.
Grosskopf, S., Hayes, K. J., & Taylor, L. L. (2009). The relative efficiency of charter schools.
Annals of Public and Cooperative Economics, 80(1), 67-87.
Hill, C. D., & Welsch, D. M. (2009). For-profit versus not-for-profit charter schools: An
examination of michigan student test scores. Education Economics, 17(2), 147-166.
Holmes, G. M., DeSimone, J., & Rupp, N. G. (2003). Does school choice increase school
quality? Unpublished manuscript.
Hoxby, C. M. (2002). School choice and school productivity (or could school choice be a tide
that lifts all boats?). Unpublished manuscript.
22
Hoxby, C. M., & Murarka, S. (2009). Charter schools in new york city: Who enrolls and how
they affect their students' achievement. Unpublished manuscript.
Imberman, S. (2008). Achievement and behavior in charter schools: Drawing a more complete
picture. Unpublished manuscript.
Imberman, S. (2009). The effect of charter schools on achievement and behaviorof public school
students. Unpublished manuscript.
Imberman, S. A. (2011). Achievement and behavior in charter schools: Drawing a more
complete picture. Review of Economics and Statistics, 93(2), 416-435.
Imberman, S. A. (2011). The effect of charter schools on achievement and behavior of public
school students. Journal of Public Economics, 95(7-8), 850-863.
King, K. A. (2005). The impacts of school choice on regional economic growth. Review of
Regional Studies, 35(3), 356-368.
Kipps, P. H., Wilhelm, H. M., & Hall, D. R. (1976). A note on the use of multiple regression
analysis in studies of achievement in economics. Journal of Economic Education, 7(2), 130132.
Kleitz, B. a. (2000). Choice, charter schools, and household preferences. Social Science
Quarterly, 81(3), 846-854.
Lack, B. (2009). No excuses: A critique of the knowledge is power program (KIPP) within
charter schools in the USA. Journal for Critical Education Policy Studies, 7(2), 126-153.
23
Lovett, S., Sauceda, M. J., & Essayyad, M. (2010). Investigating the financial and socioeconomic determinants of student learning at US charter and public schools: The texas
experience. International Journal of Monetary Economics and Finance, 3(2), 126-139.
Mac Iver, M. A., Farley-Ripple, E., & Johns Hopkins University, Center for Social
Organization,of Schools. (2007). The baltimore KIPP ujima village academy, 2002-2006: A
longitudinal analysis of student outcomesCenter for Social Organization of Schools, Johns
Hopkins University.
Macey, E., Decker, J., & Eckes, S. (2009). The knowledge is power program (KIPP): An
analysis of one model's efforts to promote achievement in underserved communities.
Journal of School Choice, 3(3), 212-241.
Mathews, J. (2009). Work hard. be nice. Education Next, 9(2), 29-35.
Ni, Y. (2009). The impact of charter schools on the efficiency of traditional public schools:
Evidence from michigan. Economics of Education Review, 28(5), 571-584.
Renzulli, L. A. (2006). District segregation, race legislation, and black enrollment in charter
schools. Social Science Quarterly, 87(3), 618-637.
Renzulli, L. A. (2006). District segregation, race legislation, and black enrollment in charter
schools. Social Science Quarterly, 87(3), 618-637.
Sass, T. R. (2006). Charter schools and student achievement in florida. Education Finance and
Policy, 1(1), 91-122.
24