Photoluminescence emission and raman vibration properties of asymmetric nanoparticle ZnO doped Mn2+ fabricated by a solvothermal method
Bạn đang xem bản rút gọn của tài liệu. Xem và tải ngay bản đầy đủ của tài liệu tại đây (569.78 KB, 8 trang )
VNU Journal of Science: Mathematics – Physics, Vol. 35, No. 3 (2019) 69-79
Original Article
Photoluminescence Emission and Raman Vibration Properties
of Asymmetric Nanoparticle ZnO Doped Mn2+ Fabricated
by a Solvothermal Method
Nguyen Xuan Sang1,*, Nguyen Thi Phuong Anh2, Nguyen Duy Dung2,
Nguyen Hoang Cao Huy2, Luu Thi Lan Anh3, Nguyen Huu Tho2
1
Department of Electronics and Telecommunication, Saigon University, 273 An Duong Vuong,
District 5, Ho Chi Minh City, Vietnam
2
Department of Natural Sciences Education, Saigon University, 273 An Duong Vuong, District 5,
Ho Chi Minh City, Vietnam
3
School of Engineering Physics, Hanoi University of Science and Technology,
1 Dai Co Viet, Hanoi, Vietnam
Received 28 June 2019, Accepted 06 August 2019
Abstract: In this study, ZnO doped Mn2+ nanoparticle with hexagonal wurtzite phase was
fabricated by a solvothermal method where various contents of Mn ion were in situ doped in ZnO
nanostructure. The crystal structure and morphological properties were investigated by X-ray
diffractometry, Raman spectroscopy and transmission electron microscopy. The
photoluminescence (PL) was measured at room temperature showed red-shift of near-band-to-band
emission and the evolution of visible emissions in the doped samples. This work analyzed the PL
characteristics of synthesized samples and revealed the role of the dopant Mn2+ on defect states of ZnO.
Keywords: Mn ion, ZnO, solvothermal synthesis, nanoparticle, photoluminescence.
1. Introduction
Zinc oxide (ZnO), a wide and direct bandgap (~3.37 eV) with large exciton binding energy (60
meV) at room temperature, has been attracted a huge interest from scientists worldwide as a promising
material for optoelectronic and photocatalytic applications [1, 2]. Recently, due to its availability, eco________
Corresponding author.
Email address:
https//doi.org/ 10.25073/2588-1124/vnumap.4344
69
70
N.X. Sang et al. / VNU Journal of Science: Mathematics – Physics, Vol. 35, No. 3 (2019) 69-79
friendly environment, safety, stability, ZnO material has been got attention as an excellent
photocatalyst [3, 4]. There are several problems needed to solve in advance for practical application of
the material. Firstly, ZnO has a large exciton binding energy, so excited carrier lifetime is not long
enough to degrade organic compounds. Secondly, the large bandgap means the working irradiation
light for photocatalytic activity must be in the range of ultra-violet. However, in the natural sunlight,
there is a small amount of UV-light ~3%. Hence the bandgap engineering of ZnO has been intensively
investigated such as doping ZnO with other elements [5-9], coating ZnO with other materials [10, 11].
Recently, S. Choi et al. [7] found that when ZnO doped with transition metal ion Cu2+, the
photocatalytic activity of ZnO was improved thank to the excited carriers separation. Recently, we
have showed that the Cr3+ could be play as an electron trap center in the hydrothermal ZnO doped Cr
samples [5]. It means that the photoelectrons were trapped then would leave holes without
recombination.
In this work, we fabricated ZnO doped Mn2+ by a facile solvothermal method. Crystal structure
and morphological properties were characterized by D8 Advance X-ray diffractometry (XRD,
Bruker), tranmission electron microscopy (TEM, Jeol 1600) and Raman spectroscopy (533 nm,
Renishaw). The optical properties were investigated by room temperature photoluminescence system
(Horiba Nanolog) with an excited source of 325 nm wavelength from Xe lamp. The revolution of PL
emission was analyzed by deconvolution the emission spectra, and then the role of ion Mn 2+ was
inferred.
2. Experimental
ZnO materials were synthesized by a solvothermal method. Zinc acetate dihydrate
Zn(CH3COO)2.2H2O (≥ 99%) and triethanoldiamin (TEA) – C6H15NO3 (≥ 99%) was supplied by
Xilong, China; whereas Ethanol – C2H5OH (≥ 99%) and Mn(CH3COO)2.4H2O (≥ 99%) were
purchased from Merck and Kanto, respectively. All the chemicals was purchased and used as received
without further purification. The synthesis procedures are as follows: 0.07 mol Zn(CH 3COO)2.2H2O
was dissolved in 70 mL of ethanol under magnetic stirring at room temperature (RT). Then, an amount
of TEA was added and stirred in 1 h at 60 ℃. In the synthesis process, Mn(CH3COO)2.4H2O was
added dropwise to obtain proper molar concentration of Mn2+ ions in ZnO: 1.0 and 3.0 at.%, were
named as ZnO:Mn1 and ZnO:Mn3, respectively. After that, the solution was poured in a teflon-lined
autoclave and treated at 150 ℃ in 18 h. The autoclave is cooled naturally to room temperature (RT)
and the white precipitate was washed with distilled water until pH reach 7. Finally, the powder was
dried at 100 ℃ for 5h.
3. Results and discussion
3.1. XRD patterns
In order to investigate the crystalline structure of ZnO materials, X-ray diffraction (XRD) pattern
was carried out at RT. The results are shown in Figure 1. The lattice parameters (a, c) were obtained
by Bragg’s law:
(1)
n 2d sin
(n=1, λ is the wavelength of incident X-ray used, 0.15418 nm) and the following evaluation, which
is defined for hexagonal phase:
N.X. Sang et al. / VNU Journal of Science: Mathematics – Physics, Vol. 35, No. 3 (2019) 69-79
1
𝑑2
4 ℎ2 +ℎ𝑘+𝑘 2
]
𝑎2
= 3[
𝑙2
+ 𝑐2
71
(2)
Where d is the distance between two consecutive parallel planes and (hkl) are the Miller indexes.
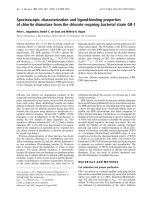
Figure 1. XRD patterns of as-prepared ZnO and Mn doped ZnO.
In the pure ZnO pattern, all the expectable Bragg angles for wurtzite phase at faces of (100), (002),
(101), (102), (110), (103), (200), (112) and (201) were observed at approximately 2 = 31.77°; 34.43°;
36.27°; 47.58°; 56.65°; 62.91°; 67.97°; 68.08° and 69.13°. The calculated lattice parameters of pure
ZnO are a = 0.3252 and c = 0.5206 which are in fine agreement with JCPDS No.36-1451 card.
There was no extra peak from secondary phases in doped samples, ZnO:Mn1 and ZnO:Mn3, indicated
that materials obtained in this study were highly single phase hexagonal wurtzite. The XRD patterns of
doped samples were identical to the pure ZnO indicating the average crystal size of ZnO:Mn1 and
ZnO:Mn3 are the same in comparison to as-prepared ZnO. We assumed that the nanoparticle of ZnO
itself has an excellent doping efficiency although the dopant ion (0.083 nm in radius) is larger than the
host ion Zn2+ (0.074 nm) [12].
3.2. Transmission Electron Microscope (TEM) analysis
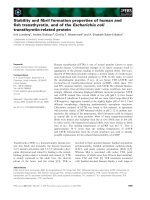
Figure 2. TEM images of as-prepared ZnO.
72
N.X. Sang et al. / VNU Journal of Science: Mathematics – Physics, Vol. 35, No. 3 (2019) 69-79
The morphology of ZnO nanostructured was characterized by TEM micrographs, as shown in fig.
2. TEM images showed that ZnO nanoparticles were mainly asymmetric and formed in different
shapes. In general, the particles were both in spherical and capsule-like shapes with the size of ~50 nm
in width and ~100 nm.
3.3. Raman spectra
To investigate the information of structure disorder and dopant in crystalline materials, Raman
spectra was carried out at RT. Furthermore, Raman is a nondestructive and superior method for
detecting the diffusion of dopant ions into the host lattice. Figure 3 shows Raman spectra of asprepared ZnO, ZnO:Mn1 and ZnO:Mn3 samples. ZnO wurtzite was classified in space group P63mc.
The zone center optical phonons are following the equation: Γ𝑜𝑝𝑡 = 𝐴1 + 𝐸1 + 2𝐸2 + 2𝐵1 , where 𝐵1
modes are silent; 𝐴1 and 𝐸1 are polar modes and splitted into TO and LO phonons, both Raman and
ℎ𝑖𝑔ℎ
infrared active; whereas 𝐸2 modes (𝐸2
and 𝐸2𝑙𝑜𝑤 ) are non-polar and Raman active only[13]. The
presence of impurities and/or defects could have an effect on both 𝐴1 (LO) and 𝐸1 (LO). Particularly,
𝐸1 (LO) is affected strongly[14]. The assignation and wavenumbers (based on study by R.Cuscó et
al.[14]) of the first and second-order are listed in Table 1.
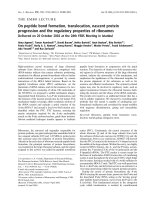
Figure 3. Raman spectra of as-prepared ZnO and Mn-doped ZnO samples.
In general, Raman vibration modes were sharper and more intensive when Mn content increased.
ℎ𝑖𝑔ℎ
According to Fig. 3, the most intensive peak in the Raman spectra was 𝐸2
at ~ 436 cm-1 which
ℎ𝑖𝑔ℎ
assigned to the oxygen vibration [14]. When Mn2+ ions introduced, the 𝐸2
increased but remained
the same position along with the absence of 𝐸1 (LO) modes which related to oxygen vacancies[15],
suggested that defects due to oxygen, such as excess oxygen and/or interstitial oxygen (Oi) were
increased. In addition, there was a weak peak at approximately 660 cm-1 which related to the vibration
of bonding between Mn and O in the crystal lattice was observed in Raman spectra of ZnO:Mn1 and
ZnO:Mn3. It is worth to note that the XRD results indicated no secondary phase observed, we
assumed that the Mn2+ ions could successfully substitute Zn2+ in the crystal.
N.X. Sang et al. / VNU Journal of Science: Mathematics – Physics, Vol. 35, No. 3 (2019) 69-79
73
Table 1. The wavenumbers (in cm-1) of the 1st and 2nd order Raman spectra found in pure ZnO and Mn-doped
samples.
Mode
ℎ𝑖𝑔ℎ
𝐸2
- 𝐸2𝑙𝑜𝑤
𝐴1 (TO)
𝐸1 (TO)
ℎ𝑖𝑔ℎ
𝐸2
𝐴1 (LO)
𝐸1 (LO)
Wavenumber (cm-1)
Ref.[14]
333
378
410
438
574
590
Pure ZnO
333
385
418
436
ZnO:Mn1
329
378
ZnO:Mn3
332
383
436
436
3.4. Photoluminescence (PL) study
To study the optical properties and defects that exist in the band gap of the materials, we measured
photoluminescence spectra at room temperature. In principle, the UV peak in the PL spectra is
associated to the near band-to-band emission (NBE), while the visible emission originates from the
defect levels, which includes zinc vacancies (VZn), interstitial zinc (Zni), interstitial oxygen (Oi) and
lattice defects relating to oxygen and zinc.
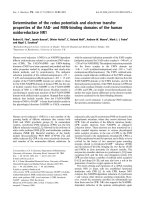
Figure 4. Room temperature photoluminescence spectra of synthesized samples.
Figure 4 illustrates the PL spectra of as-prepared and doped ZnO samples. As shown in Fig. 4, the
PL spectra of as-prepared ZnO, ZnO:Mn1 and ZnO:Mn3 showed not only an NBE emission centered
at 387 nm (3.20 eV), 385 nm (3.22 eV) and 384 nm (3.23 eV), respectively; but also a broad intense
deep-level (DL) at 589 nm (2.11 eV) in as-synthesized ZnO, 591 nm (2.10 eV) in ZnO:Mn1, 596 nm
(2.08 eV) and 647 nm (1.92 eV). When Mn2+ ions was introduced, the NBE emissions were slightly
red-shifted, which revealed that the crystallinity was improved. In addition, at 1.0 at.% Mn 2+
concentration, the intensity of UV peak decreased and that of the DL emission increased. This could
be resulted from Mn2+ ions acting as trapped centers in the bandgap of ZnO nanostructure. Moreover,
when Mn2+ concentration was increased to 3.0 at.%, both NBE and DL emissions decreased. This
luminescence quenching might due to the outside covering of the ZnO nanoparticles. We assumed that
Mn 1.0 at.% concentration is the best doping yield.
N.X. Sang et al. / VNU Journal of Science: Mathematics – Physics, Vol. 35, No. 3 (2019) 69-79
74
b)
a)
Figure 5. Photoluminescence spectra of: a) as-synthesized ZnO and b) ZnO:Mn1
In order to study bandgap structure, deep-level emissions in PL spectra of ZnO were Gaussianresolved into four emissions, which belong to green luminescence: 523 nm (2.37 eV) in ZnO sample
and 521 nm (2.38 eV) in ZnO:Mn1 sample; yellow – red regions: ZnO at 576 nm (2.15 eV), 636 nm
(1.95 eV); and ZnO:Mn1 at 567 nm (2.19 eV), 645 nm (1.92 eV); and infrared radiation (IR) at 801
nm (1.55 eV) in ZnO, 847 nm (1.46 eV) in ZnO:Mn1, as shown in Fig. 5. Firstly, according to studies
by Vanheusden et al.[16],[17], correlation between the intensity of the green luminescence and the
concentration of VO based on the observation of a line with g ~ 1.96 in EPR measurement proposed
for green emission. In addition, Leiter et al.[18] [19] reported the green band around 2.45 eV with
oxygen vacancies based on optically detected magnetic resonance experiments. Still in debate,
Reynolds et al.[20] and Kohan et al.[21] have suggested that transitions between the conduction band
(or shallow donor) and the VZn are the source of green band. Based on Janotti et al.[22] calculation,
this transition would give rise to luminescence around 2.4 – 2.5 eV. Moreover, a strong argument in
favor of zinc vacancies had been provided by strong passivation of the green emission by hydrogen
plasma treatment in experiments of Sekiguchi et al.[23] and Lavrov et al.[24] whose works
simultaneously observed an increase in vibrational modes associated with hydrogenated zinc
vacancies. In this study, it could possibly concluded that the green luminescence was originated from
VZn. When the dopant ions diffused into wurtzite lattice, VZn in unit cells were substituted by Mn2+,
which resulted in the intensity of emission centered in green region decreased. Secondly, peaks at
yellow region, which centered at 576 nm (2.15 eV) in pure ZnO and 567 nm (2.19 eV) in ZnO:Mn1,
might be contributed to Oi or other defect complexes[25, 26]. Thirdly, the dominant emission peaks
appeared in ZnO and 1.0 at.% Mn doped ZnO samples were in red region at 636 nm (1.95 eV) and 645
nm (1.92 eV), respectively, would possibly contributed to Oi (oct)2- defect[22]. Finally, in this study, we
also obtained an infrared emissions centered at 801 nm (1.55 eV), 847 nm (1.46 eV) in ZnO,
ZnO:Mn1 PL spectra, respectively. These emissions are from radiative transitions of intrinsic defects.
4. Conclusions
In conclusion, the asymmetrical ZnO nanoparticles doped and undoped with Mn 2+ were
successfully prepared by a simple sovolthermal method. The doping efficiency with ion Mn2+ was
N.X. Sang et al. / VNU Journal of Science: Mathematics – Physics, Vol. 35, No. 3 (2019) 69-79
75
high then the crystalline structure of the doped samples was not significantly changed. The
photoluminescence of synthesized samples were investigated and showed the effect of Mn content in
the ZnO matrix. In general, the UV emission intensity of ZnO was decreased when the content of the
dopant Mn2+ increased. The red-shift of the UV emission when introducing Mn2+ in the ZnO matrix
indicated that the electrons in the conduction band or near deep donor level of ZnO were captured by
the dopant ions. Hence the conduction band would be up-shifted.
Acknowledgements
This research is funded by Saigon University for basic research under grant number CS2019-46
References
[1] J. Miao, B. Liu, II–VI semiconductor nanowires, Semiconductor Nanowires, Woodhead Publishing, London
(2015) 3-28. />[2] M. Samadi, M. Zirak, A. Naseri, E. Khorashadizade, A.Z. Moshfegh, Recent progress on doped ZnO
nanostructures for visible-light photocatalysis, Thin Solid Films, 605 (2016) 2-19.
/>[3] M.R.D. Khaki, M.S. Shafeeyan, A.A.A. Raman, W. Daud, Application of doped photocatalysts for organic
pollutant degradation - A review, Journal of Environmental Management, 198 (2017) 78-94.
/>[4] K.M. Lee, C.W. Lai, K.S. Ngai, J.C. Juan, Recent developments of zinc oxide based photocatalyst in water
treatment technology: A review, Water Research, 88 (2016) 428-448.
/>[5] N. X. Sang, N. M. Quan, N. H. Tho, N. T. Tuan, T. T. Tung, Mechanism of enhanced photocatalytic activity of
Cr-doped ZnO nanoparticles revealed by photoluminescence emission and electron spin resonance,
Semiconductor Science and Technology, 34 (2019) 025013. />[6] F. Achouri, S. Corbel, L. Balan, K. Mozet, E. Girot, G. Medjahdi, M.B. Said, A. Ghrabi, R. Schneider, Porous
Mn-doped ZnO nanoparticles for enhanced solar and visible light photocatalysis, Materials & Design, 101 (2016)
309-316. />[7] S. Choi, J.Y. Do, J.H. Lee, C.S. Ra, S.K. Kim, M. Kang, Optical properties of Cu-incorporated ZnO (Cu x Zn y
O) nanoparticles and their photocatalytic hydrogen production performances, Materials Chemistry and Physics,
205 (2018) 206-209. />[8] Y. Liu, J. Yang, Q. Guan, L. Yang, Y. Zhang, Y. Wang, B. Feng, J. Cao, X. Liu, Y. Yang, M. Wei, Effects of Crdoping on the optical and magnetic properties in ZnO nanoparticles prepared by sol–gel method, Journal of
Alloys and Compounds, 486 (2009) 835-838. />[9] H. Luo, P. Dorenbos, The dual role of Cr3+ in trapping holes and electrons in lanthanide co-doped GdAlO3 and
LaAlO3, Journal of Materials Chemistry C, 6 (2018) 4977-4984. />[10] D. Schelonka, M. Slušná, J. Tolasz, D. Popelková, P. Ecorchard, ZnO-GO Composite with for Photocatalytic
Applications, Materials Today: Proceedings, 3 (2016) 2679-2687.
/>[11] P.S. Chauhan, R. Kant, A. Rai, A. Gupta, S. Bhattacharya, Facile synthesis of ZnO/GO nanoflowers over Si
substrate for improved photocatalytic decolorization of MB dye and industrial wastewater under solar irradiation,
Materials Science in Semiconductor Processing, 89 (2019) 6-17.
/>[12] N.A. Putri, Y. Febrianti, I. Sugihartono, V. Fauzia, D. Handoko, Effects of Mn dope on morphological, structural
and optical properties of ZnO nanorods grown by a hydrothermal method, AIP Conference Proceedings, 1862
(2017) 030046. />
76
N.X. Sang et al. / VNU Journal of Science: Mathematics – Physics, Vol. 35, No. 3 (2019) 69-79
[13] S. Maja J Scepanovic, Raman Study of Structural Disorder in ZnO Nanopowders, Journal of Raman
Spectroscopy, 41 (2010) 914-921. />[14] L.R. Cuscó, J. Ibáñez, L. Artús, Temperature dependence of Raman scattering in ZnO, Physical Review B, 75
(2007). />[15] X.L. Xu, J.S. Chen, G.Y. Chen, B.K. Tay, Polycrystalline ZnO thin films on Si (1 0 0) deposited by filtered
cathodic vacuum arc, Crystal Growth, 223 (2001) 201-205. />[16] K. Vanheusden, W.L. Warren, D.R. Tallant, and J. A. Voigt, Correlation between photoluminescence and oxygen
vacancies in ZnO phosphors, Applied Physics Letters, 68 (1996).
/>[17] K. Vanheusden, W.L. Warren, D.R. Tallant, J. Caruso, M.J. Hampden-Smith and T.T. Kodas, Green
photoluminescence efficiency and free-carrier density in ZnO phosphor powders prepared by spray pyrolysis,
Journal of luminescence, 75 (1997) 11-16. />[18] F.H. Leiter, A. Hofstaetter, D.M. Hofmann and B.K. Meyer, The Oxygen Vacancy as the Origin of a Green
Emission in Undoped ZnO, Physica status solidi (b), 226 (2001) R4-R5.
[19] [19] F. Leiter, D. Pfisterer, N.G. Romanov, D.M. Hofmann and B.K. Meyera, Oxygen vacancies in ZnO, Physica
B: Condensed Matter, 340-342 (2003) 201-204. />[20] D.C. Reynolds, B. Jogai, J.E. Van Nostrand, R. Jonesb and J. Jennyb, Source of the yellow luminescence band in
GaN grown by gas-source molecular beam epitaxy and the green luminescence band in single crystal ZnO, Solid
State Communications, 106 (1998) 701-704.
[21] A. F. Kohan, D. Morgan, and Chris G. Van de Walle, First-principles study of native point defects in ZnO,
Physical Review B, 61 (2000). />[22] W. Anderson Janotti, Native point defects in ZnO, Physical Review B, 76 (2007) 165202.
[23] T. Sekiguchi, N. Ohashi, Y. Terada, Effect of Hydrogenation on ZnO Luminescence, Japanese Journal of Applied
Physics, 36 (1997) 289-291. />[24] J.W. E. V. Lavrov, F. Börrnert, Chris G. Van de Walle, and R. Helbig, Hydrogen-related defects in ZnO studied
by infrared absorption spectroscopy, Physical Review B, 66 (2002).
/>[25] S. Ramanachalam, W. B. Carter, J. P. Schaffer, T. K. Gupta, Photoluminescence study of ZnO varistor stability,
Journal of Electronic Materials, 24 (1995) 413-419.
[26] A.B. Djurisic, X.Y. Chen, Y.H. Leung. "Recent Progress in Hydrothermal Synthesis of Zinc Oxide
Nanomaterials", Recent Patents on Nanotechnology, 6 (2012) 124-134.
DOI: 10.2174/187221012800270180