Effect of applying static electric field on the physical parameters and dynamics of laser-induced plasma
Bạn đang xem bản rút gọn của tài liệu. Xem và tải ngay bản đầy đủ của tài liệu tại đây (993.84 KB, 8 trang )
Journal of Advanced Research (2010) 1, 129–136
Cairo University
Journal of Advanced Research
ORIGINAL ARTICLE
Effect of applying static electric field on the physical
parameters and dynamics of laser-induced plasma
Asmaa Elhassan a , Hussein M. Abd Elmoniem b , Arafa K. Kassem a ,
Mohamed A. Hairth a,∗
a
b
National Institute of Laser Enhanced Sciences (NILES), Cairo University, Egypt
Department of Physics, Faculty of Science, Cairo University, Egypt
Available online 6 March 2010
KEYWORDS
Laser-induced plasma;
Static electric field;
Shock waves;
Plasma dynamics
Abstract In order to improve the performance of the LIBS technique – in particular its sensitivity, reproducibility and limit of detection – we studied the effect of applying a static electric field with different
polarities on the emission spectra obtained in a typical LIBS set-up. The physical parameters of the laserinduced plasma, namely the electron density Ne and the plasma temperature Te , were studied under such
circumstances. In addition to the spectroscopic analysis of the plasma plume emission, the laser-induced
shock waves were exploited to monitor the probable changes in the plasma plume dynamics due to the application of the electric field. The study showed a pronounced enhancement in the signal-to-noise (S/N) ratio
of different Al, neutral and ionic lines under forward biasing voltage (negative target and positive electrode).
On the other hand, a clear deterioration of the emission line intensities was observed under conditions of
reversed polarity. This negative effect may be attributed to the reduction in electron-ion recombinations due
to the stretched plasma plume. The plasma temperature showed a constant value in the average with the
increasing electric field in both directions. This effect may be due to the fact that the measured values of
Te were averaged over the whole plasma emission volume. The electron density was observed to decrease
slightly in the case of forward biasing while no significant effect was noticed in the case of reversed biasing.
This slight decrease in Ne can be interpreted in view of the increase in the rate of electron–ion recombinations due to the presence of the electric field. No appreciable effects of the applied electric field on the
plasma dynamics were noticed.
© 2010 Cairo University. All rights reserved.
Introduction
∗
Corresponding author. Tel.: +20 2 35675335; fax: +20 2 35675335.
E-mail address: (M.A. Hairth).
2090-1232 © 2010 Cairo University. Production and hosting by Elsevier. All
rights reserved. Peer review under responsibility of Cairo University.
Production and hosting by Elsevier
doi:10.1016/j.jare.2010.03.004
Laser Induced Breakdown Spectroscopy (LIBS) is a simple analytical technique which has been utilised in the analysis of solid [1],
liquid [2] and gaseous [3] samples. In the LIBS technique an intense
laser pulse is focused onto a material target, and identification of the
material’s elemental composition can then be made by measuring
lines of emission from ions and excited neutral atoms in a transient
laser produced plasma. The great appeal of LIBS lies in the fact that
little or no sample preparation is required to obtain useful results and
the technique is readily portable to the field. The technique and its
applications have been thoroughly discussed in a number of review
books [4,5].
130
Despite its advantages, the LIBS technique does, however, have
a number of limitations, including self-absorption of emissions, line
broadening, and continuum background [6]. These limitations may
be minimised by optimal time gating. Another limitation is the sensitivity of the system. In this, the detection sensitivity of the system
can be significantly enhanced through the optimisation of several
critical parameters. Here the plasma production is influenced by
laser parameters (intensity, pulse duration, and wavelength) [7–9],
the physical properties of the target material (z-number, ionisation
potential, reflectivity and thermal conductivity), and by the ambient conditions. There are several ways to improve the performance
of LIBS. These include the use of multiple laser pulses [10,11], the
introduction of buffer gas around the plasma [12] and the application
of a magnetic field [13]. Since plasma is a high energy electrically
charged mixture of ions and electrons, it is expected to respond to
electric fields. By applying a static electric field on the laser-induced
plasma, it is possible to produce more intense spectral lines and sustain the emission for longer periods of time. Here Hontzopoulos et
al. [14] have reported that the laser plasma emission from a gold
target in the ultraviolet spectral region was enhanced by more than
one order of magnitude in the presence of a high negative static
electric field. Their results suggest that the laser plasma creation in
the presence of a high static electric field may provide a convenient
method for the development of a high brightness, point like UV light
source even at relatively low laser intensities.
The aim of the present work was to investigate the effect of
applying a static electric field of relatively low strength on the
laser-induced plasma parameters. Using an echelle spectrometer
facilitated the study of a broad spectral range covering emission
lines in the UV, visible and near-IR regions. The effect of the electric field on the plasma plume dynamics was studied by monitoring
the laser-induced shock waves.
Methodology
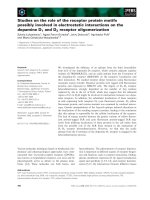
Fig. 1 shows the schematic diagram of the experimental setup. Laserinduced plasma was obtained using a Q-switched Nd:YAG laser
(Continuum NY81.30, USA) delivering laser pulses of 60 mJ/pulse,
with pulse duration of 7 ns at its fundamental wavelength (1064 nm)
with adjustable repetition rate up to 30 Hz. The laser pulse energy
was adjusted by a suitable combination of beam splitters at constant operating high voltage (1.3 kV) and delay (1.5 s) to ensure
spatial and temporal beam profile stability. An energy meter (Nova,
Ophir Optronics Ltd., USA) was employed to monitor the shot to
shot laser pulse energy. The laser beam was focused onto the aluminium target surface via a quartz plano-convex lens of 50 mm
focal length. The emission light from the plasma plume was collected using a telescopic optical system of two lenses (not shown
in the figure). The collected light was fed to the free terminal of
a one-meter length wide-band fused-silica optical fibre (600 m)
connected at its other end to an echelle spectrometer (Mechelle
7500, Multichannel Instruments, Sweden). This spectrometer provides a constant spectral resolution of 7500 corresponding to 4 pixels
FWHM, over a wavelength range 200–1000 nm displayable in a single spectrum. A gateable, intensified CCD camera, (DiCAM-Pro,
PCO Computer Optics, Germany) coupled to the spectrometer was
used for detection of the dispersed plasma emission light. The overall linear dispersion of the spectrometer-camera system ranged from
0.006 nm/pixel (at 200 nm) to 0.033 nm/pixel (at 1000 nm). To avoid
electronic interference and jitters, the CCD intensifier high voltage
was triggered optically. Special Multichannel Instruments software
A. Elhassan et al.
Figure 1
Schematic diagram of the experimental setup.
was used to control the ICCD camera parameters. The emission
spectra display, processing and analysis were performed using 2Dand 3D-Gram/32 software programs (National Instruments, USA).
In addition to the atomic database used by the mentioned software,
spectral lines identification was checked against the most up-to-date
electronically published database [15].
The gate width and delay time were chosen after performing
systematic experimental optimisation of two important parameters.
To optimise the signal-to-noise ratio and spectra reproducibility, the
detection of spectra was carried out by averaging 10 single accumulations collected from 10 fresh target positions. The plasma emission
spectra were collected under the effect of different values and polarities of electric field varying from 0 to 10 kV at atmospheric pressure.
To ensure the reproducibility of the obtained results, the experiment
was repeated several times.
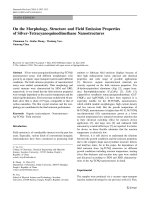
The laser-induced shock waves (SWs) were probed following
the method described in Azzeer et al. [16]. Using two corner tubes,
a He–Ne laser beam was used to probe the propagating shock wave
front at 3 consecutive positions as shown in Fig. 2(a). A fast photodiode was used to detect the deflection (refraction) of the probe
beam at each intersection giving rise to a corresponding negative
pulse of the oscilloscope trace as shown in Fig. 2(b). Knowing the
distance between the two He–Ne beams and the corresponding time
intervals between the CRO signals, the velocity of the propagating
SW could be determined for the two successive time intervals.
Two polished parallel copper plates, 1.9 cm apart, were used as
the electrodes for the application of the high voltage. The electrodes
were both 60 mm diameter and 8 mm thick. One of the electrodes
had a 5 mm diameter hole in its centre to permit focusing of the
laser light on to the surface of the aluminium target impeded on
the other electrode. Through the connection of the two electrodes
with the high voltage (HV) power supply it was possible to reverse
their polarity in order to study such effect. The target was a 5 mm
polished high purity aluminium plate (99.9999%), with its surface
facing the laser on the same level of the copper electrode surface
to avoid any probable edge discharges. The target electrode holder
Electric field assisted laser induced plasma
Figure 2
131
The propagating shock wave (SW) front at 3 consecutive positions (a); the corresponding negative pulses of the oscilloscope trace (b).
was fixed on a micro-translation stage facilitating fresh location for
the laser focusing onto the Al surface.
466.4 nm for ionic aluminium (Al II). Such lines and their physical parameters are listed in Table 1. The spectroscopic data were
retrieved from Reader et al. [19].
Results and discussion
Influence of electric field on the Al spectra
Optimisation of experimental parameters
For the spectral analysis of the laser-induced plasma, we followed
the spectral lines evolution under different experimental conditions.
The emission spectrum was recorded at different delay times (τ d )
and gate widths (Δt ) in order to select the optimal signal-to-noise
ratio (S/N) [17]. Here it must be noted that it was impossible to
perform the measurements without delaying the measurement time
with respect to the firing time of the laser as it was necessary to get
rid of the overwhelming bright continuum at the early times of the
plasma evolution [18]. Accordingly, in order to obtain a good S/N
ratio, i.e. an optimum value of the emission intensity with respect
to the background, a proper choice of the delay time was required
for the measurement of both ionic and neutral spectral lines. To perform such optimisation, delay time was changed in the time interval
between 50 ns to 5 s at constant gate width (2.5 s). The same
procedure was performed to optimise the gate width at constant
delay time (1.5 s). Fig. 3 depicts the optimisation process of the
delay time, revealing an optimum value τ d = 1.5 s for both ionic
and atomic emission lines. The obtained optimum values for Δt and
τ d were 2.5 and 1.5 s respectively. It is worth mentioning here that
both Δt and τ d are functions of the other experimental parameters,
such as the laser pulse energy, laser wavelength, and target characteristics. All these parameters were fixed throughout the experimental
measurements to the values used during the optimisation of both Δt
and τ d .
Fig. 4 shows a typical three-dimensional panoramic LIBS spectra
of a pure Al target (99.999%) at 1.5 s delay time and 2.5 s gate
width for different values of the applied electric field. The laser
pulse energy was 60 mJ and the alignment of the optical fibre was
such that it collected the light emission from the central part of
the plasma plume. The figure reflects the wide spectral range and
the high resolution furnished by the echelle spectroscopic system
used. Data reproducibility can be enhanced through the accumulation of consecutive measured spectra. The spectra shown in Fig. 4
are the average of accumulating 10 single shot spectra. This figure
also depicts the difference between the positive and negative biasing voltage cases. A careful investigation of the obtained spectra
revealed that both the ionic and atomic spectral lines were affected
(though differently) by the application of the electric field.
Normalisation of the spectra to background
Normalisation of the maximum line intensities was exploited to
avoid any unwanted experimental fluctuations by dividing each
spectrum with their own background value.
The aluminium spectral lines used in the analysis throughout
the present work were: 256.78, 266.5, 305.02, 309.3, 394.4 and
396.15 nm for atomic aluminium (Al I), and 281.64, 358.6 and
Figure 3 Optimisation of the delay time (τ d ) of the ionic lines and
the atomic lines at constant gate width of 2.5 s.
132
Table 1
A. Elhassan et al.
Aluminium spectral emission atomic and ionic lines used in the present work and their physical parameters.
Species
λ (nm)
Configuration
Terms
Al
I
256.8
266.0
305.0
308.2
309.2
394.4
396.6
3s2 3p–3s2 (1 S)nd
3s2 3p–3s2 5s
3s3p2 –3s3p(3 P◦ )4s
3s2 3p–3s2 3d
3s2 3p–3s2 3d
3s2 3p–3s2 4s
3s2 3p–3s2 4s
2 P◦ –y 2 D
Al
II
281.6
358.6
466.4
(2 S)
3s3p–3s
3s3d–3s4f
3p2 –3s4p
4s
2 P◦ –2 S
4P–4P◦
2 P◦ –2 D
2 P◦ –2 D
2 P◦ –2 S
2 P◦ –2 S
1 P◦ –1 S
3 D–3 F◦
1 D–1 p◦
Ji − Jk
A (s−1 ) ×108
Ei (cm−1 )
Ek (cm−1 )
gi
gk
1/2–3/2
3/2–1/2
3/2–5/2
1/2–3/2
3/2–5/2
1/2–1/2
3/2–1/2
0.22
0.264
0.053
0.61
0.12
0.493
0.98
0.0
112
29,067
0.0
112
0.0
112
38,929
37,689
29,067
32,435
32,435
25,348
25,348
2
4
4
2
4
2
4
4
2
6
4
4
2
2
1–0
3–4
2–1
3.83
2.45
0.53
59,850
95,549
85,479
95,348
123,423
106,918
3
7
5
1
9
3
Figure 4 Typical 3D LIBS spectra of pure Al in the presence of a static electric field at various voltages. The laser pulse energy was 60 mJ, plasma
emission was accumulated with a delay time 1.5 s and gate width of 2.5 s.
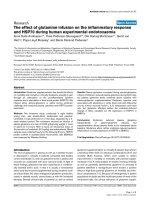
Influence of electric field on the Al II lines
As shown in the 3D map in Fig. 5, enhancement took place in the S/N
ratio of ionic lines 281.63 as a consequence of the forward biasing
of the electrodes, i.e. negative target and positive front electrode.
Reversing the polarity resulted in a clear deterioration of S/N ratio.
The experimental points are plotted in the histogram shown in
Fig. 6. This shows that a growth was obtained in the intensity (nor-
malised to the background) of both aluminium ionic lines in the
case of forward biasing. A doubling in the radiation intensity of
the 281.63 nm spectral line was obtained at −10 kV biasing voltage
compared with the zero voltage value. At reversed polarity, the line
intensity deteriorated by 0.8 times at 10 kV with respect to the zero
field value.
Figure 5 3D map for the influence of application of the high voltage
with different polarities on the Al ionic spectral lines (281.64 nm).
Figure 6 The biasing voltage dependence of the Al (281.63 nm) ionic
line intensity normalised to the background.
Electric field assisted laser induced plasma
133
where Aki is the transition probability, gk is the statistical weight for
the upper level, Ek is the excited level energy, Te is the temperature,
k is Boltzmann’s constant, Us (Te ) is the partition function of the
species and F is an experimental factor.
There are two main factors influencing the emitted line intensity.
The first is the number density of the atoms and the second is the
temperature of the plasma. Reformulating Eq. (1) gives
ln
Figure 7 The biasing voltage dependence of the Al (308.2 nm) atomic
line intensity normalised to the background.
The observed enhancement in the plasma emission ionic lines
intensity in the UV and visible regions under forward biasing can
be interpreted physically in view of the ionic nature of the plasma.
It is well known that a laser-induced plasma plume moves in the
direction opposite to the incident laser beam. The high repelling
field between positive ions in the plasma and the positive front electrode leads to the confinement of the plasma plume. This increases
the recombination probability, and consequently the emitted light
intensity (radiative decay of excited atoms, ions or molecules). On
the other hand, under reversed polarity (positive target), the deterioration in the plasma emission intensity occurs due to the high
attractive field between the positive ions and the negative front electrode that leads to a decrease in the recombination rate due to the
stretching of the plasma plume. Raising the voltage over 10 kV leads
to a saturation effect, before the onset of the electric discharge in air
at about 15 kV biasing voltage.
The influence of electric field on the Al I lines
Fig. 7 displays the effect of applying the electric field on the atomic
lines at 308.2 nm. The same effect was pronounced in this case,
since the emission originated from neutral atoms that are expected
to have the response for the applied static electric field. Further, the
increase in the intensities of the atomic line under forward biasing may be attributed to the reduction in self-absorption of such
lines. The confinement of the plasma plume under the effect of the
retarding electric field reduces the outer, colder, layer of the atoms
responsible of self-absorption. In consequence, this may lead to the
pronounced slight enhancement in the atomic lines intensities.
Plasma parameters
Plasma temperature
Ek
Aki gk
exp −
Us (Te )
kTe
(1)
(2)
Measuring the relative line intensity it is then possible to estimate
the plasma temperature Te by plotting the left hand side of Eq. (2)
vs. the excited energy level Ek . The plasma temperature can then be
evaluated from the slope of obtained straight line.
According to these requirements the wavelengths of the atomic
lines selected to determine plasma temperature were 257.57, 266.07,
309.32, 394.44, and 396.19 nm.
The required parameters in Boltzmann’s method are listed in
Table 1. Typical Boltzmann’s plots of the aluminium lines are shown
in Fig. 8(a–c), where the curved slopes yield the plasma temperatures. The aluminium plasma temperatures obtained as a function
of the electric field with different polarities can be calculated from
the slopes of the corresponding Boltzmann’s plots.
As shown in Fig. 9, the plasma temperature tends to fluctuate
slightly around a constant value with the increasing electric field in
both directions. This effect may be due to the fact that the measured
values of Te are averaged over the whole plasma emission. More
accurate values can be obtained by performing spatially resolved
spectroscopic measurements.
Electron density
The electron density is an important parameter used to describe the
plasma environment and is crucial for establishing its equilibrium
status. The electron density can be estimated from the profile of the
spectrum, which is a result of many effects, though mainly Stark
broadening, Doppler broadening and pressure broadening effects.
However, in the experimental conditions of the present work the
main contribution to line widths arose from the Stark effect.
The profile for Stark broadened lines is well described by a
Lorentz function. The well resolved Al (II) 281.6 nm spectral line
was used to measure the full-width at half-maximum (FWHM).
Since the instrumental line broadening exhibited a Lorentzian shape,
the Stark line width λ can be extracted from the measured line
width λobs. by subtracting the instrumental line broadening λinst. :
λ=
λobs. −
λinst.
(3)
In our case λinst. was 0.05 nm (determined by measuring the
FWHM of the Hg lines emitted by a standard low presser Hg lamp).
The width of the Stark broadened spectral line depends on the
electron density (Ne ). For the linear Stark effect the electron density
and the line width are related by the simple formula
Ne = C (Ne , Te ) λ3/2
The emitted spectral line intensity Iki is a measure of the population of the corresponding energy level of this element in the plasma,
at local thermodynamic equilibrium (LTE). Accordingly, the population of an excited level can be related to the total density Cs of
neutral atom or ion of the element through Boltzmann’s law [7,20]
Iλ = F · Cs
Iλ
1
Cs F
=−
· Ek + ln
Aki gk
kTe
Us (Te )
(4)
where the parameter C(Ne , Te ) determines the relative contribution
of the electron collision on the electrostatic fields, depending weakly
on Ne and Te .
For a non-H like line, the electron density (in cm−3 ) can be
determined from the line width as:
Ne ≈
λ
· 1016
2w
(5)
134
A. Elhassan et al.
Figure 8
(a–c) Boltzmann’s plots for Al I spectral lines at different high voltages and polarities.
The parameter w is the electron impact value, which can be found
in the well-documented table [21].
As shown in Fig. 10 no significant effect was observed in the
electron density in the case of reverse biasing. This may be due to
the fact that the high voltage had no effect on the line broadening.
Local thermodynamic equilibrium
By knowing the electron density and the plasma temperature we
can determine whether the local thermodynamic equilibrium (LTE)
assumption is valid by applying McWhirter criterion [22]. The lower
limit for the electron density at which the plasma will be in LTE is
given by [9,20]:
Ne (cm−3 ) ≥ 1.6 × 10¹² [Te (K)]1/2 [ E(eV )]3
(6)
E is the largest energy transition for which the condition holds
and Te is the excitation temperature.
In the present case E = 3.65 eV. The electron density lower limit
value given by Eq. (5) for aluminium plasma is 6.9 × 1015 cm−3 . The
experimentally calculated densities were greater than these values,
consistent with the assumption that the LTE is prevailing in the
plasma.
Effect of high tension on shock wave (SW) propagation
Figure 9 Applied voltage dependence of the plasma temperature
measured spectroscopically using Boltzmann’s method. The error bars
represent the experimental data standard deviation.
The propagation of the shock wave front causes the He–Ne laser
beam to deflect (refract) at each intersection—giving rise to a cor-
Electric field assisted laser induced plasma
135
It has been shown that the application of the static electric field on
the LIP in the forward direction improves the signal-to-noise (S/N)
ratio of the LIBS signals. Accordingly, it is feasible to improve
the limit of detection (LOD) of the LIBS technique adopting this
method. The results of the present study can be utilised in order to
improve LIBS application in industrial production control.
References
Figure 10 Applied voltage dependence of the electron density
(obtained using Al II at 281.6 nm).
responding negative pulse of the oscilloscope trace (see Fig. 2).
Since the He–Ne beams were separated with well known distances
d1 = 11 mm and d2 = 4 mm and as the time intervals between the corresponding oscilloscope signals were known, we can determine the
velocities u1 and u2 of the propagating shock wave at two successive
time intervals. In this way the shock wave velocity was calculated
under the effect of different high-tension strengths and at different
polarities. The results show that there is no significant influence of
the high tension on the shock wave velocity. The obtained average
values of u1 and u2 were 4.5 and 2 Mach respectively. However,
the values of the SW velocity may be used to monitor the stability
of the laser-produced plasma and can also be used to normalise the
obtained spectra [23].
Conclusion
In the present work laser induced breakdown spectroscopy was
applied to a pure aluminium target impeded in one of two copper electrodes in order to investigate the effect of electric field on
the LIBS signal. We also studied the influence of an electric field
on the plasma parameters produced on the pure aluminium target as
well as laser-induced shock waves.
The results show that the electric field had a pronounced effect
on the emission intensities of the ionic lines under forward biasing
(negative target). In general, the emission of the ionic lines grew
exponentially. In the reversed biasing case, the line intensity deteriorated with respect to the zero field value. The effect on atomic lines
was not clear, with no real change noticed under forward biasing.
As for the effect of applying the electric field on the plasma
parameters, the plasma temperature tended to fluctuate slightly
around an average constant value with the increasing electric field
in both directions. On the other hand the electron number density
was found to decrease slightly in the case of forward biasing, with a
much stronger decrease (about one order of magnitude) in the case
of reversed biasing.
As expected, no electric field effect was noticed on the laserinduced shock wave velocity. In fact, the SW velocity depended
mainly on the laser parameters, such as pulse energy and spot size.
[1] Goode SR, Morgan SL, Hoskins R, Oxsher A. Identifying alloys
by laser-induced breakdown spectroscopy with a time-resolved high
resolution echelle spectrometer. J Anal Atom Spectrom 2000;15(9):
1133–8.
[2] Charfi B, Harith MA. Panoramic laser-induced breakdown spectrometry of water. Spectrochim Acta B 2002;57(7):1141–53.
[3] Nordstrom RJ. Study of laser-induced plasma emission spectra of N2 ,
O2 and ambient air in the region 350 nm to 950 nm. Appl Spectrosc
1995;49:1490–9.
[4] Cremers DA, Radziemski LJ. Handbook of Laser-induced Breakdown
Spectroscopy. Wiley; 2006.
[5] Miziolek WA, Palleschi V, Schechter I. Laser Induced Breakdown Spectroscopy (LIBS): Fundamentals and Applications. Cambridge, UK:
Cambridge University Press; 2006.
[6] Barbini R, Colao F, Fantoni R, Palucci A, Capitelli F. Laser induced
breakdown spectroscopy for quantitative elemental analysis. Proc SPIE
2000;4070:444–9.
[7] Elhassan A, Giakoumaki A, Anglos D, Ingo G, Robbiola L, Harith
MA. Nanosecond and femtosecond laser induced breakdown spectroscopic analysis of bronze alloys. Spectrochim Acta B 2008;63(4):
504–11.
[8] Abdel-Salam ZA, Galmed AH, Tognoni E, Harith MA. Estimation of
calcified tissues hardness via calcium and magnesium ionic to atomic
line intensity ratio in laser induced breakdown spectra. Spectrochim
Acta B 2007;62(12):1343–7.
[9] Galmed AH, Harith MA. Temporal follow up of the LTE conditions in
aluminum laser induced plasma at different laser energies. Appl Phys
B 2008;91(3–4):651–60.
[10] St Onge L, Sabsabi M, Cielo P. Analysis of solids using laserinduced plasma spectroscopy in double-pulse mode. Spectrochim Acta
B 1998;53(3):407–15.
[11] Amal K, El Naby SH, Palleschi V, Salvetti A, Harith MA. Comparison
between single- and double-pulse LIBS at different air pressures on
silicon target. Appl Phys B 2006;83(4):651–7.
[12] Aguilera JA, Aragón C. A comparison of the temperatures and
electron densities of laser-produced plasmas obtained in air, argon
and helium at atmospheric pressure. Appl Phys A 1999;69(7):
S475–8.
[13] Rai VN, Rai AK, Yueh FY, Singh JP. Optical emission from
laser-induced breakdown plasma of solid and liquid samples
in the presence of a magnetic field. Appl Optics 2003;42(12):
2085–93.
[14] Hontzopoulos E, Charalambidis D, Fotakis C, Farkas G, Horváth
ZG, Tóth C. Enhancement of ultraviolet laser plasma emission produced in a strong static electric field. Optics Commun 1988;67(2):
124–8.
[15] NIST electronic database. />[16] Azzeer AM, Al Dwayyan AS, Al Salhi MS, Kamal AM, Harith MA.
Optical probing of laser-induced shock waves in air. Appl Phys B
1997;63(3):307–10.
[17] Body D, Chadwick BL. Optimization of the spectral data processing in
a LIBS simultaneous elemental analysis system. Spectrochim Acta B
2001;56(6):725–36.
[18] Hermann J, Vivien C, Carricato AP, Boulmer Leborgne C. A spectroscopic study of laser ablation plasmas from Ti, Al and C targets. Appl
Surf Sci 1998;127–129:645–9.
[19] Reader J, Corliss CH, Wiese WL, Martin GA. Wavelength and Transition Probabilities for Atoms and Atomic Ions. Washington, DC: U.S.
136
Department of Commerce, National Institute of Standards and Technology; 1980.
[20] Colao F, Lazic V, Fantoni R, Pershin S. A comparison of single and double pulse laser-induced breakdown spectroscopy of aluminum samples.
Spectrochim Acta B 2002;57(7):1167–79.
[21] Griem HR. Plasma Spectroscopy. New York: McGraw-Hill; 1964.
A. Elhassan et al.
[22] Lochte Holtgreven W. Plasma Diagnostics. Woodbury, NY: American
Institute of Physics; 1995.
[23] Aragón C, Bengoechea J, Aguilera JA. Influence of the optical depth on
spectral line emission from laser-induced plasmas. Spectrochim Acta
B 2001;56(6):619–28.