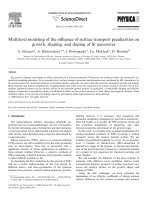
Influence of leachate on the Oligocene-Miocene clays of the İstanbul area, Turkey
Bạn đang xem bản rút gọn của tài liệu. Xem và tải ngay bản đầy đủ của tài liệu tại đây (7.74 MB, 15 trang )
Turkish Journal of Earth Sciences
Turkish J Earth Sci
(2018) 27: 49-63
© TÜBİTAK
doi:10.3906/yer-1709-14
/>
Research Article
Influence of leachate on the Oligocene-Miocene clays of the İstanbul area, Turkey
1,
2
Sadık ÖZTOPRAK *, Davut LAÇİN
Department of Civil Engineering, Faculty of Engineering, İstanbul University, Avcılar, İstanbul, Turkey
2
Department of Geological Engineering, Faculty of Engineering, İstanbul University, Avcılar, İstanbul, Turkey
1
Received: 18.09.2017
Accepted/Published Online: 27.11.2017
Final Version: 08.01.2018
Abstract: Oligo-Miocene clay outcrops on the European side (west and northwest part) of İstanbul were analysed. Formerly, a landfill
and sanitary landfill were built on the clay. Mineral liners of the current and extending parts of the İstanbul landfill consist of these clays,
since they include a considerable amount of smectite, illite, and kaolinite. With this feature, these clays are also an important candidate
for the buffer material of repositories for nuclear wastes of newly planned nuclear power plants. In this context, one Miocene and two
Oligocene clay samples were subjected to leachate under low stress using an odometer device during a period of 30 days, 180 days, and
360 days to understand the chemical and mineralogical transformations and subsequent changes in the clay structure. The results of this
work and our ongoing other research revealed that İstanbul clays are mostly illite/smectite mixed-layer minerals. Illites considerably
increased while the illite/smectite mixed-layer minerals decreased in the first 15–30 days. The kinetics of the three clays was studied to
understand the reasons for the illite increase. Increase of the activation energy over time may be attributed to the successive intercalation
of illite lattice layers as alteration of mixed-layer illite-smectite clays. Mineral dissolution, however, is still the primary mechanism for
illitization when the low activation energy is considered. With these findings, the utilization of İstanbul clays is questionable for clay
barriers of landfills or sealing material of hazardous wastes.
Key words: Illite/smectite mixed-layer mineral, clay structure, landfill leachate, clay barrier, activation energy
1. Introduction
Clays are the crucial element of the barrier of a sanitary
landfill or buffer of nuclear waste in deep geological
repositories. Although the mineral liners are generally
supplemented with nonpermeable polymeric membranes,
they are still the essential part of leachate barriers.
However, in most of the standards, the type of the required
clay mineral is not defined. There are some approaches
indicating that illites and kaolinites are better, since they
maintain stability during leachate exposure. On the other
hand, some approaches recommend using smectites to
increase the adsorption and attenuation, which can also
cause changes in the clay structure and subsequently
increase the permeability. For instance, Rowe (1987)
noted that leachate caused agglomeration in a clay barrier
and increased its permeability approximately 1000 times.
Campbell et al. (1983), King (1993), and Peters (1993) said
that leachate may affect the clay liner at different levels.
Quigley et al. (1987) stated that any mineralogical change
affected the permeability. All this research does not refer to
clay mineralogy. On the other hand, in their mineralogybased works, Batchelder and Joseph (1996) and Batchelder
et al. (1998a, 1998b) indicated that leachate caused
*Correspondence:
disintegration of the smectites and mixed-layer minerals
through cation exchange. They also expressed that illites
break off from mixed-layer minerals, which can be called
illitization, and colloidal content was increased due to the
high ion content. Similarly, Joseph et al. (2003) mentioned
the mineral break up and structural disintegration due to
leachate and added that the occurrence of capillary cracks
and increase of permeation rates could be caused by
preferring single-valence cations (especially K+ + NH4+),
which led a decrease in the interlayer distance of smectite
minerals.
A large amount of work was carried out to understand
the mineralogical and geochemical changes (e.g., K
contents) related to increasing temperature (Eberl and
Hower, 1976; Eberl et al., 1986; Pytte, 1982; Pytte and
Reynolds, 1989; Bauer and Velde, 1993; Huang et al.,
1993; Pusch and Madsen, 1995; Cuadros and Linares,
1996). However, apart from these works, Oztoprak and
Pisirici (2011) briefly showed that leachate can also vary
the mineralogy of smectite, including clays. They used
three different Oligo-Miocene-aged İstanbul clays, which
included either smectite-rich or smectite/illite (I/S) mixedlayer minerals. In their work, micro- and macrostructural
49
ÖZTOPRAK and LAÇİN / Turkish J Earth Sci
changes of clays were observed early after 30 days (1
month) of leachate exposure time.
This paper is an extension of the work of Oztoprak
and Pisirici (2011) and presents the results of the latter
clay samples, which were exposed to leachate during 180
days (6 months) and 360 days (12 months). In this work,
the effect of exposure duration of leachate was studied by
comparing the variation of index properties, chemical
content, mineral content, mineral types, and structure of
clays. In addition to this, the kinetics of İstanbul clays were
studied and the obtained results were adopted for leachatesmectite or I/S mixed-layer minerals interaction. The aim
of this study was to determine whether the İstanbul clays
would stay stable or lose their integrity during the leachate
exposure.
2. Material and tests
2.1. Origin and characterization of used clays
Lithologic units from the Paleozoic into the Tertiary and
Quaternary periods are located in the İstanbul region.
Engineering practices and problems (e.g., construction,
excavation, landslides, use for filling and coating) are
particularly associated with the Upper Oligocene-lower
Miocene formations. These are mainly the Danişmen
Formation (Gürpınar member Tdg, Ağaçlı member Tda,
Süloğlu member Tds), Çekmece Formation (Bakırköy
member Tçb, Güngören member Tçg), and İstanbul
Formation (Ti). Figure 1 depicts the extension of all these
formations in the vicinity of İstanbul. These similarly
aged formations include similar clays and sometimes it is
too difficult to distinguish them by means of micro and
engineering properties. Especially in the western part of
İstanbul, the Gürpınar, Güngören, and Bakırköy clays are
smectitic and mostly high-plasticity clays. Therefore, the
clays used were picked from the Danişmen Formation
(Gürpınar member) and the Çekmece Formation
(Güngören member). According to Oktay et al. (1992), the
age of this formation is Upper Oligocene – Lower Miocene
in the vicinity of İstanbul. Oktay et al. (1992) indicated
that upper levels of the Gürpınar member (Tdg) consist
of claystone with limestone bearing Congeria fossils, marl,
rarely conglomerate, siltstone, and sandstone alternations
and were deposited in a deep-sea fan and delta plain
environment in the vicinity of the Karaburun region
(north of İstanbul) and the river-lake environment in the
region of Gürpınar (west of İstanbul).
The Güngören member (Tçg) consists of generally
green-colored clays and marls, dirty white-colored
limestone interlayers with Mactra, and sand lenses. Arıç
(1955) lithologically differentiated clays and marls within
the formation and Sayar (1976) first named the formation.
Clayey limestone-clay stratification becomes more
frequent towards the Bakırköy Formation, which overlies
50
the Güngören member. Clay parts are greenish-blue in
colored, smooth-irregular, and thinly layered. They often
include sand lenses. According to the Mactra and helix,
teeth, and spines of vertebrates, the age of formation was
defined as upper Miocene (Sarmasien) by Arıç (1955), and
it precipitated in a lake environment that included very
fine-grained terrigenous material.
In this research, one clay sample from the Güngören
member (clay G1) and two different clay samples from
the Gürpınar member (clay G2 and clay G3) were used
to determine the effects of the landfill leachate. The
location of samples can be seen in Figure 1. These clays
were selected on purpose, since they belonged to typical
formations either used as barrier material at the Göktürk
and Kemerburgaz landfill sites or as foundation soil at the
Göktürk sanitary landfill site, as shown in Figure 1.
Several tests were carried out on the soil samples
prior to and after exposure to leachate for determining
particle size distribution, Atterberg limits, specific gravity,
chemical composition, mineral content, cation exchange
capacity, and existing cations. All three clay samples
include mostly clays and are classified as CH type clays.
Clay G1 contains 72% clay, 26.7% silt, and 1.3% sand, with
liquid limit LL = 70% and plasticity index PI = 46%. Clay
G2 contains 59% clay, 32.4% silt, and 7.6% sand, with LL
= 60% and PI = 38%. Clay G3 contains 85% clay, 14.3%
silt, and 0.2%, with LL = 99% and PI = 65%. According to
the XRD analyses, the clay parts of the three samples are
composed of I/S mixed-layer minerals, illite, kaolinite, and
chlorite. Mixed-layer minerals were defined by finding the
corresponding positions given in Table 1, borrowed from
the extensive data of Meunier (2005).
The percentage of the minerals in the clay part was
obtained by the areas of first peaks using the indices of
Weaver (1960) and Kübler (1984) belonging to the XRD
imprints of orientated and then ethylene-glycolated
samples (Figure 2). According to this, the clay part of G1
was determined as 82% I/S mixed-layer mineral, 10% illite,
and 8% kaolinite. The nonclay part of clay G1 contains
quartz, calcite, and feldspar minerals. Clay G2 was
determined to have 95% I/S mixed-layer mineral, 3.3%
kaolinite, 1.7% illite, and chlorite in very small amounts.
The nonclay part of clay G1 contains feldspar, quartz, and
albite minerals. The clay part of G3 was determined as
80% I/S mixed-layer mineral, 12% illite, and 8% kaolinite.
The nonclay part of clay G3 contains quartz, feldspar, and
calcite minerals.
Chemical analysis of the soil samples was characterized
by X-ray fluorescence (XRF). The results of the chemical
analysis, which are compatible with the results of XRD
analysis, will be discussed later. The cation exchange
capacity (CEC) was calculated by designating Na+ cations
using the method of Bache (1976). According to this
ÖZTOPRAK and LAÇİN / Turkish J Earth Sci
Figure 1. Oligo-Miocene clays in the vicinity of İstanbul.
method, CEC values of clays G1, G2, and G3 are obtained
as 51, 54.4, and 69.8 mEq/100 g, respectively. These CEC
values (50–70 mEq/100 g) correspond to illite-smectite
mixed-layer clays. Exchangeable cations (ECs) of clays
were obtained using the method of Chapman (1965). Na+,
K+, Ca+2, Mg+2, Fe, and Al+3 cations were removed from
the clays and the amounts of the removed cations were
found in units of mEq/100 g by using inductive coupling
plasma/mass spectrometry (ICP/MS). The ammonium
(NH4+) content was calculated separately by combustion
method, which is the direct measurement of total nitrogen
(N) content. In this work, 20 mg of sample was oxidized in
51
ÖZTOPRAK and LAÇİN / Turkish J Earth Sci
Table 1. Position of peaks of essential mixed-layer clay minerals classified in decreasing
interlayer spacing values of 001 planes (prepared from the extensive data of Meunier,
2005).
Position (Å)
Mineral
16–18.5
Smectite-rich R0 mixed-layer minerals (EG)
16.5–17.5
Smectite (EG)
14.5–16
C/S R1 (EG)
13.7–15
C/S R1 (Nat.)
14–15
Smectite or smectite-rich R0 mixed-layer mineral (Nat.)
14–14.35
Chlorite
12.9–13
Smectite with 1 water layer
12–12.45
Smectite with 1 water layer (Nat.)
10.2–14.35
I/S R1 (Nat.)
10–10.1
Illite
9.9–10.7
I/S R ³ 1 > 90% illite (Nat.)
9.9–10.3
I/S R ³ 1 > 90% illite (EG)
7.20–8.50
K/ S R0 (EG)
7.10–8.50
C/S R0 (EG)
7.5–8.2
C/S R1 (EG)
7.00–9.00
M/C (>30% chlorite)
7.20–7.36
Serpentine
7.13–7.20
Kaolinite
7.00–7.14
Chlorite
Nat., “Natural” sample
R0, Randomly ordered
I/S, Illite/smectite mixed layer
M/C, Mica/chlorite mixed layer
EG, Ethylene glycol-saturated sample
R1, Ordered mixed-layer mineral
C/S, Chlorite/smectite mixed layer
K/S, Kaolinite/smectite mixed layer
a furnace at 1000 °C and an infrared detector determined
N content. Before leachate exposure, ECs of all clays were
between 62 and 65 mEq/100 g, and this result reveals that
smectite minerals of the I/S mixed-layer minerals are Casmectite.
2.2. Characteristics of landfill leachate
Landfill leachate was taken from the Kemerburgaz
landfill site, which is out of operation. As seen from Table
2, leachate reflects the country characteristics with high
alkalinity and ion contents. The pH values were above
7.0 at the beginning of the research. The pH value of
leachate was 7.6 when it first arrived at the laboratory but
increased to 8.3 and approximately 9.0 after 6 months and
1 year, respectively, at laboratory temperature of 23–24
°C.
2.3. Sample preparation and test procedures
To understand and compare the effect of the leachate
on İstanbul clays, two different undisturbed samples
52
and one disturbed sample were utilized: 1) undisturbed
Güngören clay: clay G1; 2) undisturbed Gürpınar clay:
clay G2; 3) reconstituted Gürpınar clay: clay G3. To
prepare the reconstituted samples of G3 clay, material
was pulverized and later passed through a #200 sieve.
Afterward, the material was compacted using water with
standard Proctor compaction energy at the optimum
water content. Compacted samples were left to cure for
30 days so that they could gain structure. They were not
allowed to lose moisture during curing.
Clay samples were put into a 50-mm ring odometer
apparatus. Clays were exposed to free swelling under
pressure of 5 kPa inside the leachate for 30 days, 180 days,
and 360 days in the odometer. XRD, XRF, and ESEM
analyses were carried out by using the leachate-exposed
samples in the odometer. On the other hand, witness
samples, which were kept in similar conditions with main
samples, were utilized to increase the sample amount in
order to carry out the index tests.
Figure 2. XRD patterns obtained from oriented clay parts of: a) clay G1, b) clay G2, c) clay G3.
ÖZTOPRAK and LAÇİN / Turkish J Earth Sci
53
ÖZTOPRAK and LAÇİN / Turkish J Earth Sci
Table 2. Chemical composition of landfill leachate used in this
research.
Parameter
LC
tw
Chemical oxygen demand, COD
10,370
-
Dissolved COD
9800
-
Total dissolved solids, TDS
15,400
-
Volatile TDS
3413
-
Total hardness (as CaCO3)
2500
-
Alkalinity (as CaCO3)
22,300
-
pH
7.6
7.2
Sulfate, SO4
270
2.53
Chloride, Cl
2700
4.26
Kjeldahl nitrogen, N
2200
-
Nitrate, NO3
7.2
-
Ammonium, NH4
2500
-
Calcium, Ca
385
49
Magnesium, Mg
660
12
Sodium, Na
2152
24
Potassium, K
1450
3.3
Ferrous, Fe
13.5
0.01
Total phosphate, P
26
-
Manganese, Mn
542
-
Copper, Cu
62.5
-
Chromium, Cr
7.65
-
Nickel, Ni
3.6
-
Mercury, Hg
5.4
-
All values in mg/L except pH
LC, Landfill leachate of Kemerburgaz (Göktürk) site
tw, Tap water
3. Results and discussion
3.1. Mineralogy and structure of clays
The effect of leachate on the microstructure and index
properties of clays is clearly evolved with time when the
numbers are examined in Table 3. The XRD patterns of
three clays have also considerably changed after leachate
exposure even after 1 month (Figure 3). In particular,
the intensity of I/S peaks decreased while the intensity of
illite peaks increased. In addition to this, the asymmetric
shape of I/S mixed-layer peaks became noticeable after
leachate exposure. The interlayer distances of I/S, C/S, and
S decreased within the first month but increased during
the following 11 months. As seen in interlayer distances of
EG-treated samples in Table 3, the increase is from 16.99
Å to 17.46 Å for clay G1, from 16.16 Å to 16.99 Å for clay
54
G2, and from 16.93 Å to 17.60 Å for clay G3 during 1
year of leachate exposure. Interlayer spacing of air-dried
I/S minerals decreased from 12.99 Å to 12.53 Å for clay
G1 and from 12.89 Å to 12.62 Å for clay G2. No change
was observed in clay G3. The achieved I/S peaks revealed
that clays transformed into smectite-rich minerals (S) and
discrete illite according to the positions of the peak data of
Meunier (2005) in Table 1.
Leachate exposure increased the ECs but decreased
the CEC and hence lowered the specific surface. When the
amounts of ECs presented in Table 3 are examined, it is seen
that clays exchanged NH4+, Na+, and K+ instead of Ca+2 and
Mg+2. The highest increase in the amounts was observed
in NH4+ and Na+ ions; K+ ions followed them. However,
a decrease was observed in the Mg+2 ion amount whereas
no significant change was observed in the amount of Ca+2
ions for the clays exposed to the leachate. The decrease in
the distance between the I/S layers in G1 and G2 can be
attributed to the increase in the NH4+ and Na+ ions, while
no change in G3 can be identified with the increase in the
Ca+2 ions. Nonetheless, it would not be erroneous to think
that the exchange of cations had a role in the change of the
interlayer distance and structure.
The amounts of I/S or smectite decreased while the
amount of illite increased. Considerable change was
observed in a month of leachate exposure. As seen from
Table 3, during 12 months of leachate exposure, the
amount of the I/S mixed layer in clay G1 decreased from
82% to 64.2%, while the amount of illite increased from
10% to 25.4% and the amount of kaolinite increased from
8% to 10.4%. The amount of the I/S mixed layer in clay
G2 decreased from 94.5% to 83.7%, while the amount
of illite increased from 1.7% to 5.8% and the amount of
chlorite increased from 3.8% to 10.5%. The amount of the
I/S mixed layer in clay G3 decreased from 80.0% to 59.8%,
while the amount of illite increased from 12% to 29% and
the amount of kaolinite increased from 8.0% to 11.2%.
The chemical composition of the clay samples can
also be seen in Table 3. The amount of SiO2 and Al2O3
noticeably decreased in all three samples with the effect
of the leachate, while the amount of CaO increased in the
samples. This can be interpreted as evidence that some
amount of tetrahedral and octahedral structure was partly
destroyed and carbonate structures increased with the
effect of the leachate.
The ESEM images in Figures 4–6 demonstrate the
initial condition and structure before leachate exposure
and how the texture is affected after the leachate exposure
just for 1 month. The effect of the leachate is clearly
observed in snapshots and ESEM images of all clays.
Collapses, disintegrations, and cracks were observed in all
clay samples. In addition to this, a considerable increase
occurred in colloidal content after applying a hydrometer
test on the exposed samples (Figure 7a). According to the
ÖZTOPRAK and LAÇİN / Turkish J Earth Sci
Table 3. Characteristics of clays before and after exposure to leachate.
Leachate exposure
No exposure (natural) 1 month of exposure
6 months of exposure 12 months of exposure
Clay name
G1
G2
G3
G1
G2
G3
G1
G2
G3
G1
G2
G3
Sand
1.3
7.6
0.2
1.4
7.5
0.3
1.43
7.4
0.3
1.5
7.3
0.4
Silt
26.7
32.4
14.3
21.0
27.2
11.8
20.2
26.3
10.9
19.7
25.3
10.1
Clay (<0.002 mm)
72.0
59.0
85.0
77.6
65.3
87.9
78.4
67
88.9
78.8
67.4
89.5
I/S, C/S, or S-rich mixed layer
82
94.5
80
66.5
85.9
62.8
64.6
84
60.7
64.2
83.7
59.8
Illite
10
1.7
12
24.3
5.7
27.7
25.1
5.7
28.2
25.4
5.8
29
Chlorite
-
3.8
-
-
8.4
-
-
10.4
-
-
10.5
-
Kaolinite
8
-
8
9.2
-
9.5
10.2
-
11.1
10.4
-
11.2
Interlayer spacing of I/S or S
after air drying (Å)
12.99
12.89
12.89
12.53
12.62
12.88
12.61
12.70
12.61
12.98
12.52
12.52
Interlayer spacing of I/S or S
after EG treatment (Å)
16.99
16.16
16.93
16.36
15.77
16.67
17.13
16.87
17.06
17.46
16.99
17.60
Liquid limit, LL (%)
72
60
99
78
66
109
-
-
-
86
73
118
Plastic limit, PL (%)
26
22
34
31
27
40
-
-
-
42
36
49
Plasticity index, PI (%)
46
38
65
47
39
69
-
-
-
44
37
69
Specific gravity, Gs
2.75
2.72
2.78
2.67
2.67
2.74
-
-
-
2.66
2.66
2.72
Specific surface, SSA, cm /g
368
393
504
298
287
292
-
-
-
197
128
158
CEC (Na) (mEq/100 g)
51.0
54.4
69.8
41.2
39.7
40.4
32.7
38.7
30.8
27.2
17.7
21.8
Calcium, Ca
55.81
52.69
51.97
55.9
50.2
55.17
38.03
37.98
37.69
40.92
37.39
36.53
Sodium, Na
0.89
0.046
1.88
6.37
5.13
7.2
18.83
9.34
16.01
38.00
41.72
48.43
Particle size analysis (%)
Mineral content of clay part (%)
Consistency limits
2
Exchangeable cations (mEq/100 g)
Potassium, K
3.72
3.96
5.42
7.74
6.25
8.79
21.73
18.93
25.04
20.23
20.85
21.47
Ammonium, NH4
0.21
0.16
0.25
7.53
6.08
7.92
22.54
20.99
23.86
40.88
42.19
50.14
Magnesium, Mg
1.48
7.73
3.25
1.1
5.5
2.08
2.24
2.49
2.56
3.00
3.20
3.19
Aluminum, Al
0.047
0.033
0.067
0.06
0.05
0.07
0.05
0.04
0.06
0.034
0.022
0.058
Ferrous, Fe
0.059
0.05
0.048
0.28
0.28
0.26
0.13
0.24
0.076
0.023
0.014
0.043
Total
62.2
64.6
62.9
79.0
73.5
81.5
103.5
90.0
105.3
143.1
145.4
159.8
SiO2
44.46
48.18
54.25
38.17
47.1
52.3
36.41
45.07
51.60
37.33
47.48
54.61
Al2O3
14.32
14.7
16.78
11.77
13.98
15.41
10.93
13.65
15.50
10.84
13.62
15.70
Chemical composition (%)
CaO
12.59
7.87
2.86
15.97
8.33
3.56
17.10
8.69
2.46
18.21
8.52
3.80
Fe2O3
4.9
7.59
6.38
4.65
6.89
6.6
5.46
7.00
6.52
4.99
7.37
6.89
K2O
2.15
1.76
2.45
2.11
2.1
2.75
2.15
2.23
2.80
2.36
2.54
3.26
MgO
1.68
3.44
2.21
1.6
3.24
2.34
1.36
2.62
1.97
1.95
3.47
2.59
Na2O
0.53
0.86
0.57
0.74
0.89
0.89
0.98
0.87
0.90
0.91
0.83
1.11
TiO2
0.57
0.78
0.71
0.47
0.79
0.71
0.45
0.74
0.71
0.46
0.77
0.72
MnO
0.07
0.14
0.032
0.045
0.14
0.063
0.04
0.12
0.06
0.04
0.13
0.05
Total
81.27
85.32
86.24
75.53
83.46
84.62
74.88
80.99
82.52
77.09
84.72
88.73
55
ÖZTOPRAK and LAÇİN / Turkish J Earth Sci
Figure 3. Comparison of XRD patterns obtained from oriented pastes of natural conditions and exposed: a) clay G1, b) clay G2,
c) clay G3 (all clays were exposed to leachate for 1 month in odometer device under 5 kPa loading; m = months).
(a)
(b)
Natural clay G1:
(Undisturbed,
before leachate
exposure)
Leachate treated
clay G1:
(Exposed to free
swelling test in
leachate for one
month)
Figure 4. Snapshot and ESEM image of clay G1: a) before leachate, b) following the leachate exposure for 1 month (magnification
is 4000×).
56
ÖZTOPRAK and LAÇİN / Turkish J Earth Sci
(a)
(b)
Natural clay
G2:
(Undisturbed,
before leachate
exposure)
Leachate treated
clay G2:
(Exposed to free
swelling test in
leachate for one
month)
Figure 5. Snapshot and ESEM image of clay G2: a) before leachate, b) following the leachate exposure for 1 month (magnification
is 4000×).
ESEM images, smectites were broken down with the effect
of the leachate and transformed into a faulted structure.
3.2. Index properties
Interesting results were achieved from granulometry and
Atterberg limit tests. As seen in Figure 7a, silt and clay
content increased for all samples. The increase is dominant
at approximately 0.005–0.002 mm particle size. Therefore,
this change can be attributed to the increase in colloidal
content. Despite the increase in the liquid limits of clays,
plasticity indices are generally stable. A slight increase in
G3 clay can be mentioned. The positions of G1 and G2
clays on the plasticity card reflect that they include I/S
mixed layers. Without leachate exposure, they are located
between the smectite and illite regions, and after leachate
exposure they gradually move to the illite region with time
and finally they turn into silt after 12 months. Similarly,
the G3 clay, which always includes smectite-rich minerals
before and after leachate exposure, expresses silt behavior.
Before leachate the clays were classified as CH clays, but
after exposure to leachate during 1 year they became highplasticity silts, MH.
On the plasticity card, moving of clays into the illite
region above the A line and towards the A line (clay/silt
border) is consistent with the XRD results indicating
illitization. The increase in liquid limits complies with the
increase in the colloidal content and smaller clay grains as
seen in the ESEM images and the increase in their CECs.
The mineralogical and ESEM image analyses give
important insights into the effects of leachate on clay
microstructure. There are two important mechanisms that
should be emphasized. The first one is that the smectites are
transformed into illites, and I/S minerals are disintegrated
into very small clay crystals as seen from the microscope
images. The results of the hydrometer tests also show that
colloidal content of the soils increased. This increase in the
colloidal content naturally increases the content of ECs. It
can be followed in Table 3 that both the amounts of illite
and ECs are increased.
3.3. Mineral transformation and kinetics of clays
It was clearly seen that not only were the positions of I/S,
C/S, or S peaks affected, but also the widths of the peak
profiles were increased, and they became asymmetric due
to leachate exposure. In addition to this, disintegrations
were apparent in the smectite structures. Similar
supporting mineralogical findings also exist in the works of
Batchelder et al. (1998) and Joseph et al. (2003). Oztoprak
57
ÖZTOPRAK and LAÇİN / Turkish J Earth Sci
(a)
(b)
Natural clay G3:
(Undisturbed,
before leachate
exposure)
Leachate
treated clay
G3:
(Exposed to
free swelling
test in leachate
for one
month)
Figure 6. Snapshot and ESEM image of clay G3: a) before leachate, b) following the leachate exposure for 1 month
(magnification is 4000×).
Figure 7. Effect of leachate: a) on the particle size distribution of the clays, b) on the locations of the clays on the plasticity card,
before and after exposure to leachate (plasticity card was produced from Mitchell and Soga, 2005).
and Pisirici (2011) also expressed these findings in their
work and they used the same mixed-layer minerals as in
this paper. However, this paper includes the time effect
by treating the clay samples for 6 and 12 months more. In
this way, mineral transformation is understood better and
58
transformation rates of illite and I/S minerals motivated
the investigation of the kinetics of clays.
All clays, which were exposed to leachate for 12
months, were transformed into smectite-rich minerals.
Increasing interlayer spacing in the XRD imprints of EG-
ÖZTOPRAK and LAÇİN / Turkish J Earth Sci
treated samples can be attributed to the breaking of the
illites from I/S mixed layers. The increasing amount of
illites, chlorites, and kaolinites is a clear indication of this
mechanism (Figure 3; Table 3). However, illitization (or
chlorite increase) can be attributed to three mechanisms,
which are also depicted in Figure 8:
1) Neoformation of illites/chlorites by coordination of
Si, Al, K, and hydroxyls
2) Breaking apart of illite/chlorite minerals from I/S
and C/S mixed layers
3) Coalescence of illite/chlorite particles and collapsed
layers
By means of interlayer spacing, it can readily be
interpreted that illites were broken apart from mixed layers.
In this context, if mineral transformation had occurred and
some smectites were yielded to illites, interlayer spacing
of I/S minerals would have decreased. However, the illites
were probably broken apart due to cation demixing or
exchange, as depicted in Figure 8. In addition to this, the
decrease in interlayer spacing can also be explained by
the replacement of an exchange cation (Laird, 2006). The
probability of exchanging NH4+, Na+, and K+ instead of
Ca+2 and Mg+2 seems quite high when the amounts of ECs
presented in Table 3 are taken into account. This result is
compatible with the sequence of ion exchange selectivity
by smectites described by Stumm (1992) and McBride
(1994) as follows: Al3+ > Ca2+ > Mg2+ > NH4+ > K+ > Na+
> Li+. The highest increase in amounts was observed in
NH4+ and Na+ ions. K+ ions followed them. However, a
decrease was observed in the amount of Ca+2 ions for the
clays exposed to the leachate. The cation exchange and
demixing mechanisms are swelling mechanisms, which
were comprehensively defined by Laird (2006) and were
caused by NH4+, Na+, and K+ cations. Gaucher et al. (2006)
and Gautier et al. (2010) indicated that NH4+ is the most
favorable monovalent cation for smectites and has an
important effect on the loss of integrity and the increase
of permeability of clay barriers. However, in this work, Na+
and K+ cations also had a considerable role for exchange
and corresponding I/S mixed-layer mineral dissolution.
Figure 8. Schematic diagram for mechanisms depicting possible transformation and/or breaking apart of I/S mixed-layer minerals
exposed to leachate and coalescence of illites (modified from Oztoprak and Pisirici, 2011).
59
ÖZTOPRAK and LAÇİN / Turkish J Earth Sci
The change in the texture and the increase in the voids
are clear in the ESEM images of the clays. This can be
attributed to only the breakage of the tips of clay crystals.
Although big cracks were formed in the sample during
free swelling in leachate, spillage and disintegration were
observed to be very limited during eye examination of
samples. Faulted structure and colloidal content, however,
cause the increase of charge in the clay and therefore an
increase in swelling. Furthermore, Laird (2006) mentioned
that collapses occur in the crystal structure of smectites
during cation exchange, which causes a swelling by
increasing the electrical load. This view is supported also
in this study by electron microscope images given in the
previous section.
In means of changes in the chemical structures,
successive intercalation of illites in smectite stacks were
occurred. Although this transformation led to limited
formation of new illites, it seems possible. As shown by
Meunier (2005), transformation of smectite minerals to
illite (hydrous mica) and chlorite will release silica and
aluminum. The reaction of smectite to illite transformation
produces quartz and ferromagnesian phyllosilicate:
Montmorillonite [ (M+ynH2O)(Al2-yMgy)(Si4O10(HO)2
] + K+ → Illite [ KyAl4(Si8-y,Aly)O20(OH)4 ] + Fe2+, Mg2+ +
SiO2
(1)
The decreases of SiO2 in the chemical compositions of
the clay samples are clear in Table 3. On the other hand,
another possible transformation reaction in the clays due
to leachate may be illite formation from albite:
Plagioclase [(Na, Ca) Al1-2Si3-2O8] + K+ → Illite [ Ky Al4
(Si8-y, Aly) O20 (OH)4 ] + Al3+
(2)
This would be accomplished by aluminum Al3+
release, which may define the decrease of Al2O3 in all three
samples in Table 3. All these chemical analysis results
can be interpreted such that some amount of tetrahedral
and octahedral structures was partly destroyed, and this
finding may show that smectite to illite transformation
took place with the effect of the leachate.
It is well known that smectite transforms into illite at
high pressure, high alkalinity, and/or at high temperatures.
On the other hand, Eberl et al. (1986) and Bauer and Velde
(1999) showed that even at low temperatures (20–150
°C), high-alkalinity solutions (K+-saturated solutions)
with high pH values transformed smectite into illite. In
accordance with this finding, the leachate examined in
this study is found to have a high amount of K+ ions (i.e.
high alkalinity) and a high pH value. Thus, it is possible
to state that chemical reaction of the clays with leachate
is the main reason for the significant increase of illite
obtained in the XRD analyses of the 3 clays that were
60
exposed to leachate at 23–25 °C. Nonetheless, it would
not be erroneous to consider two factors together: the
transformation of smectite into illite and the breakup of
illites from I/S mixed-layer minerals.
The progressive increase of the illite (or chlorite) and
the decrease of the smectite content in illite/smectite
and chlorite/smectite mixed layers in diagenetic or
hydrothermal formations are classically thought to be
due to a single mineral reaction of the smectite to illite
type. The transformation requires activation energy that
can be referred to as the distribution of energy inside
the crystal lattice and its inner and outer surfaces. In
this context, the required activation energy for this type
of mineral transformation was obtained in most of the
work (Meunier, 2005). Activation energy is an important
indicator to reflect the illitization of natural smectites of
clay barriers. In the literature, many attenuation models
for smectites exist. The general kinetic equation may be
written as follows (Pytte, 1982; Pytte and Reynolds, 1989;
Huang et al., 1993; Meunier, 2005):
(3)
Here, k is a rate constant, [K+] is moles of potassium
cations, and m and n are constants.
The order of the attenuation relation would change;
however, Meunier (2005) indicated that a second-order
relation (n = 2) does successfully define the smectite
decrease. Huang et al. (1993) showed the success of this
agreement by using n = 2 for their mixed-layer smectites.
In addition to this, the authors also showed that using 1
for m was appropriate. However, both Pytte and Reynolds
(1989) and Cuadros and Linares (1996) preferred using n
= 5 and m = 1 for their model.
To calculate the required activation energy (Ea) to
change the mineral content and type by leachate, the
Arrhenius equation, which establishes the relation with
temperature (T) and rate constant (k), was utilized.
(4)
In this equation, R is the perfect gas constant (8.314
J mol–1 K–1 or 1.987 cal mol–1 K–1). This equation can be
defined as
(5)
When Eqs. (3) and (5) are merged and proper
adjustments are made, Eq. (6) will be exploited. Further
arrangements would cause the calculation of Ea through
Eq. (7).
(6)
ÖZTOPRAK and LAÇİN / Turkish J Earth Sci
I/S mixed layers. However, afterwards, the required energy
progressively increased and reached 4.0–5.5 kcal. This
increasing energy could be interpreted as the new formation
of illites in smectite stacks. A similar activation energy
(5 kcal) was only calculated by Howard and Roy (1985)
in the literature. However, other values for the required
activation energy of natural smectites and clay barriers
are approximately 20–30 kcal (Pytte and Reynolds, 1989;
Huang et al., 1993; Pusch and Madsen, 1995). Therefore,
it is difficult to evaluate the transformation of smectites to
illites. Maybe preliminary mineral transformation is valid
for this duration. With these findings, using I/S and C/S
mixed-layered İstanbul clays as a clay barrier cannot be
advised. They are subject to changes in the mineral content
and structure, which may lead to permeability increases
and attenuation capacity decreases.
(7)
In this equation, S0 is initial smectite percent in I/S
mixed layers for time t0; S is smectite fraction after leachate
exposure for time t.
Although leachate exposure to smectites does not
correspond to thermodynamic rules, if the rate constant
(k) of leachate-treated clay and heated clay in KCl solution
can be coupled, then the obtained activation energy from
thermodynamic rules may correspond to the activation
energy required for mineral dissolution/transformation
of clay exposed to leachate. In this context, to estimate
the activation energy for mineral breakup and/or mineral
transformation, the methodology of Huang et al. (1996)
was adopted. According to this, the k – T relation in Eq. (3)
was used and clay samples that were not reacted in contact
with the leachate previously were placed in an oven in
KCl solution with molarity [K+] = 0.037 for 2 and 7 days
at T = 100, 200, and 300 °C. This molarity corresponds to
the [K+] of the used leachate. Temperatures over 300 °C
and waiting period longer than 7 days were not selected,
since the rate of I/S decrease became close to the leachate
case. After taking the samples from the oven, they were
EG-treated and XRD prints and mineral amounts were
obtained, as seen in Table 4. An example is given in Figure
9 regarding how the lnk – 1/T relation was constructed,
and Arrhenius parameters were calculated. In means of
thermodynamic relations designated A and Ea values are
given in Table 5 and Ea values are between 3.6 and 4.8
kcal for the three clays. The same relation was used for
calculating the activation energy of mineral changes due to
leachate exposure. In this context, calculated A values and
I/S or S amounts from leachate exposure tests at T = 24 °C
were considered and Ea values for each exposure duration
were obtained (Table 5). It should be noted that if the K+
concentrations are similar, the effects of 1 year of leachate
exposure on smectite decrease correspond to temperature
exposure at T = 100–300 °C for 2 to 7 days.
A very low activation energy within the first 30 days
could be attributed to the breaking up of illites from the
4. Conclusions
Three different Oligo-Miocene aged İstanbul clays,
which included smectite-illite mixed-layer minerals,
were subjected to landfill leachate under low pressure
for 30 days, 180 days, and 360 days. The mineralogy and
chemical structures were observed to be significantly
affected. Ion exchange reactions caused dissolution in the
crystal structure of smectite-illite mixed-layer minerals.
Snapshots and ESEM images of samples also demonstrated
the changes in the texture and structure, which were
the result of mineral transformations, mineral content
changes, and chemical reactions.
The high ionic domain and alkalinity of landfill
leachate, especially NH4+, Na+, and K+ cations, caused
faulted structures and mineral disintegrations, which also
caused an increase in colloidal content. The thickness of
the double diffused layer was increased, clays moved to the
illite region on the plasticity card, and, at the end of 1 year,
they all started to behave as silts.
Very low activation energy within the first 30 days could
be attributed to the breaking up of illites from I/S mixed
layers and coalescence of illite particles. These results
may be the consequence of the weak connection between
smectites and illites. However, afterwards, the required
Table 4. Kinetic model parameters and kinetic energy of treated clays.
Percent of I/S or S in clay
T = 24 °C
Clay Air-dried
T = 100 °C
2 days
T = 200 °C
7 days
2 days
T = 300 °C
7 days
2 days
7 days
G1
80
77
73
71
61
64
47
G2
94.5
91
87
86
76
76
53
G3
82
79
73
71
58
64
49
61
ÖZTOPRAK and LAÇİN / Turkish J Earth Sci
Figure 9. a) Experimental data to fit second-order kinetic model for G2 clay (untreated with leachate); b) experimental
results for finding the Arrhenius parameters, Ea and A, of G2 clay for [K+] = 0.037 M and T = 100, 200, 300 °C (R = 1.987 cal
mol–1 K–1).
Table 5. Kinetic model parameters (for [K+] = 0.037 M) and activation
energy of clays according to their exposure duration with leachate.
Arrhenius parameters
Ea (kcal) for leachate exposure
A (s–1 mol–1 L)
Ea (kcal)
0–1 m
6–12 m
6–12 m
G1
5.3 × 10⁻⁵
4.1
1.7
3.8
4.8
G2
8.0 × 10
–5
4.8
2.5
4.3
5.5
G3
3.2 × 10⁻⁵
3.6
1.3
3.3
3.9
Clay
energy progressively increased and reached 4.0–5.5 kcal.
Although it seems to be limited, the increasing trend of
activation energy may be attributed to the formation of
new illites in smectite stacks.
Mineral
transformations/dissolutions,
particle
realignment of smectites, and coalescence of illite and/
or chlorite particles led to structural changes in İstanbul
clays. The loss of integrity in all clay samples was apparent
and affected the increase of permeability, which would
also cause the decrease of attenuation capacity. As a
consequence of these findings, the utilization of mixedlayer İstanbul clays is questionable for clay barriers of
landfills or sealing material of hazardous wastes.
Acknowledgments
This work was supported by the Scientific Research Projects
Coordination Unit of İstanbul University, Project No:
UDP-16491. The authors would also like to extend their
special thanks to Dr Gülsüm Yılmaz and Oğuz Firidin for
their support during the tests and analyses.
References
Arıç C (1955). Haliç-Küçükçekmece gölü bölgesinin jeolojisi. PhD,
İstanbul Technical University, İstanbul, Turkey (in Turkish).
Bache BW (1976). The measurement of cation exchange capacity of
soils. J Sci Food Agric 27: 273-280.
Batchelder M, Joseph JB (1996). Considerations on the mineralogical
compositions of landfill liners. Mineralogical Society Bulletin
115: 3-7.
62
Batchelder M, Mather JD, Joseph JB (1998a). Mineralogical and
chemical changes in mineral liners in contact with landfill
leachate. Waste Manage Res 16: 411-420.
Batchelder M, Mather JD, Joseph JB (1998b). The stability of
the Oxford Clay as a mineral liner for landfill. Journal of
the Chartered Institution of Water and Environmental
Management 12: 92-97.
ÖZTOPRAK and LAÇİN / Turkish J Earth Sci
Bauer A, Velde B (1993). Smectite transformation in high molar
KOH solutions. Clay Miner 34: 259-273.
Campbell DJV, Parker A, Rees JF, Ross CAM (1983). Attenuation of
potential pollutants in landfill leachate by Lower Greensand.
Waste Manage Res 1: 31-52.
Chapman HD (1965). Cation-exchange capacity 1 . In: Norman
AG, editor. Methods of Soil Analysis. Part 2. Chemical and
Microbiological Properties. Madison, WI, USA: ASA and
SSSA, pp. 891-901.
Cuadros J, Linares J (1996). Experimental kinetic study of the
smectite–to–illite transformation. Geochim Cosmochim Ac
60: 439-453.
Eberl DD, Hower J (1976). Kinetics of illite formation. Geol Soc Am
Bull 87: 1326-1330.
Eberl DD, Srodon J, Northrop HR (1986). Potassium fixation in
smectite by wetting and drying. In: Davis JA, Hayes KF, editors.
Geochemical Processes at Mineral Surfaces. Washington, DC,
USA: American Chemical Society, pp. 296-326.
Fernandez F, Quigley RM (1985). Hydraulic conductivity of natural
clay liners permeated with simple liquid hydrocarbons. Can
Geotech J 22: 205-214.
Fernandez F, Quigley RM (1991). Controlling the destructive effects
of clay - organic liquid interactions by application of effective
stresses: Can Geotech J 28: 388-398.
Gaucher EC, Guyonnet D, Cazaux D (2006). Confinement des
déchets: les apports de la géochimie pour la compréhension
des barrières argileuses. Environnement & Technique 256: 2933 (in French).
Gautier M, Muller F, Le Forestier L, Beny JM, Guegan R (2010).
NH4–smectite: characterization, hydration properties and
hydro mechanical behaviour. Appl Clay Sci 49: 247-254.
Kübler B (1984). Les indicateurs des transformations physiques et
chimiques dans la diageneses, temperature et calorimetric.
In: Lagache M, editor. Thermoetrie et barometrie
geologiques. Paris, France: Société française de minéralogie et
cristallographie, pp. 489-596 (in French).
McBride MB (1994). Environmental Chemistry of Soils. New York,
NY, USA: Oxford University Press.
Laird DA (2006). Influence of layer charge of swelling of smectites.
Appl Clay Sci 34: 74-87.
Meunier A (2005). Clays. Berlin, Germany: Springer.
Oktay FY, Eren RH, Sakınç M (1992). Karaburun-Yeniköy (İstanbul)
çevresinde Doğu Trakya Oligosen havzasının sedimenter
jeolojisi. In: Türkiye 9. Petrol Kongresi Bildiriler Kitabı, pp. 92101 (in Turkish).
Oztoprak S, Pisirici B (2011). Effects of structure changes on the
macro behaviour of Istanbul (Turkey) clays exposed to landfill
leachate. Eng Geol 121: 110-122.
Pusch R, Madsen FT (1995). Aspects on the illitisation of the
Kinnekulle bentonites. Clay Clay Min 43: 261-270.
Pytte AM (1982). The kinetics of the smectite to illite reaction
in contact metamorphic shales. MSc, Dartmouth College,
Hanover, NH, USA.
Pytte AM, Reynolds RC (1989). The thermal transformation of
smectite to illite. In: Naesser ND, McCulloh TH, editors. The
Thermal History of a Sedimentary Basin: Methods and Case
History. Berlin, Germany: Springer, pp. 133-140.
Quigley RM, Fernandez F, Rowe RK (1988). Clayey barrier
assessment for impoundment of domestic waste leachate
(southern Ontario) including clay/leachate compatibility by
hydraulic conductivity. Can Geotech J 25: 574-581.
Howard JJ, Roy DM (1985). Development of layer charge and kinetics
of experimental smectite alteration. Clay Clay Miner 33: 81-88.
Quigley RM, Yanful EK, Fernandez F (1987). Ion transfer by diffusion
through clayey barriers. In: Woods RD, editor. Geotechnical
Practice for Waste Disposal. ASCE Special Publication 13.
Berlin, Germany: Springer, pp. 137-158.
Huang WL, Longo JM, Pevear DR (1993). An experimentally derived
kinetic model for smectite–to–illite conversion and its use as a
geothermometer. Clay Clay Min 41: 162-177.
Rowe RK (1987). Pollutant transport through barriers. In: Woods
RD, editor. Geotechnical Practice for Waste Disposal. ASCE
Special Publication 13. Berlin, Germany: Springer, pp. 159-184.
Joseph JB, Styles JR, Yuen STS, Cressey G (2001). Variations in
clay mineral performance in the presence of leachates. In:
Proceedings of the 8th International Landfill Symposium,
Cagliari, Italy, pp. 255-264.
Sayar C (1976). The geology of the Golden Horn (Haliç) and
surrounding region. In: Issues of İstanbul Haliç and Solutions
Symposium, İstanbul, pp. 355-374 (in Turkish).
King KS, Quigley RM, Fernandez F, Reades DW, Bacopoulos A
(1993). Hydraulic conductivity and diffusion monitoring of
the Keele Valley Landfill liner, Maple, Ontario. Can. Geotech
J 30: 124-134.
Stumm W (1992). Chemistry of the Solid-Water Interface: Processes
at the Mineral-Water and Particle-Water Interface in Natural
Systems. New York, NY, USA: John Wiley and Sons.
Weaver CE (1960). Possible uses of clay minerals in search for oil.
Bulletin of the AAPG 44: 1505-1518.
63