Quantification of greenhouse gas emissions from different municipal solid waste treatment methods - case study in Ha Noi, Vietnam
Bạn đang xem bản rút gọn của tài liệu. Xem và tải ngay bản đầy đủ của tài liệu tại đây (746.17 KB, 9 trang )
Environmental Sciences | Ecology
Doi: 10.31276/VJSTE.61(3).81-89
Quantification of greenhouse gas emissions
from different municipal solid waste treatment methods case study in Ha Noi, Vietnam
Thi Mai Thao Pham*
Faculty of Environment
Ha Noi University of Natural Resources and Environment
Received 3 April 2019; accepted 12 July 2019
Abstract:
Introduction
This study focuses on defining the greenhouse gas
(GHG) emissions from treatment of municipal solid
waste (MSW) in Ha Noi city. Firstly, the MSW
samplings at Nam Son and Xuan Son landfills were
collected to identify the components. Based on the
statistical data on the amount and ratio of MSW
collected, the volume of MSW treated by different
technologies was estimated. Then, the GHG emissions
were quantified by applying the Intergovernmental
Panel on Climate Change (IPCC) 2006 model. The
annual GHG released from MSW in Ha Noi in 2017
was 1.1 million tons of CO2e from landfilling, 16.3
thousand tons of CO2e from incineration, and 76,100
tons of CO2e from composting. The GHG emission
level from landfills is the highest (327 kg of CO2e per
ton of treated waste), followed by composting (189 kg
of CO2e per ton), and incineration (115 kg of CO2e per
ton). The GHG emissions from landfills comprised
nearly 90% of GHG emissions from MSW disposal in
Ha Noi. The results also revealed that if there are no
measures to recover landfill gas for energy generation,
the GHG generated from MSW treatment facilities will
also contribute significantly to the greenhouse effect
and climate change impact. These research results also
supply the basis information for decision-makers to
select the appropriate MSW treatment technologies for
Ha Noi in the context of increasing population pressure
and environmental pollution.
Ha Noi is the capital of Vietnam and is the country’s
economic and political centre. It covers the second largest
area of 3,344.6 km2. The population in 2017 was 7.65
million people; 49.2% lived in urban areas and 50.8%
in suburban areas, distributed among 12 urban districts,
17 suburban districts, and one town [1]. The recent trend
toward urbanization has led to a rapid increase in generation
of MSW. Statistics reveal that the amount of MSW in Ha
Noi city averages 7,500 tons per day and it is growing by
an average of 10-16% per year in urban areas [2]. Currently,
MSW in Ha Noi is treated mainly by landfills without gas
capture, incineration, and composting [3]. Due to the high
ratio of organic matter in landfills, anaerobic decomposition
creates a huge amount of CH4 that causes a greenhouse effect
25 times higher than CO2. According to 2006 statistics from
the Intergovernmental Panel on Climate Change (IPCC) [4],
CH4 generated in landfill sites accounted for approximately
27% of the total greenhouse gas (GHG) and approximately
3-4% of total global GHG emissions.
Keywords: composting, greenhouse gas (GHG), incineration, landfill, MSW.
Classification number: 5.1
According to the annual report of the Ha Noi People’s
Committee on the status of MSW generation and
management in Ha Noi city, the total collected and treated
MSW in 2017 was an estimated 5,300 tons per day [4],
including:
i) Landfilling, which is conducted mainly at Nam Son
and Xuan Son landfills. These landfills treat approximately
89.5% of waste collected; with a capacity of 4,0004,500 tons per day, Nam Son is the largest. The MSW is
unclassified at these landfills and no gas capture system has
been installed.
ii) Composting, which takes place at Cau Dien, Kieu
Ky, and Xuan Son composting plants. However, only 0.5%
of the total collected MSW all organic waste is treated by
*Email:
September 2019 • Vol.61 Number 3
Vietnam Journal of Science,
Technology and Engineering
81
Environmental Sciences | Ecology
this method. The output of these systems is organic humus.
iii) Incineration, which is done at Xuan Son, Thanh
Cong, and Phuong Dinh waste treatment plants; with a
capacity of 700 tons per day, Xuan Son is the largest. This
method treats approximately 10% of MSW generated.
Additionally, a recycling method is applied but the ratio is
tiny and is mainly done by private companies. Emissions
generated from combustion are treated to remove pollutant
gases before they are discharged into the air.
Recent studies have examined the GHG emissions
resulting from various waste treatment technologies;
in 2016, Singh, et al. [5] did so at landfills in India. The
research evaluated GHG emissions from three different
landfills and showed the potential to generate electricity
from landfill gas collection systems. In 2019, Zhang, et al.
[6] monitored the GHG emissions from a typical limitedcontrolled landfill according to the guidance of the UK
Environment Agency to obtain representative data from
the heterogeneous surface of the landfill. The research
had identified the CH4 and CO2 emission fluxes from the
landfill area. This is advisable to devote more attention to
and determine potential solutions for reduction of GHG
emissions from a limited-controlled landfill. In 2017,
Dong, et al. [7] evaluated GHG emissions from the waste
sectors in Hong Kong using IPCC 2006 guidelines. The
analysis results indicated that the GHG emissions from
landfills decreased while total GHG emissions from the
entire waste sector increased, mainly due to emissions from
the combustion of petroleum for ignition. It revealed that
incineration also contributes to the increase of GHGs in
waste treatment. In 2009, Manfredi, et al. [8] accounted
for GHG emissions from different landfilling technologies
in Denmark; these included open dump, conventional
landfills with flares and with energy recovery, and landfills
receiving low-organic-carbon waste. The results illustrated
that GHG emissions from conventional landfills lacking a
CH4 collection system were the major contribution to the
total GHGs. This research also concluded that utilization of
landfill gases for electricity generation contributed to reduce
environmental impacts from landfilling. Additionally,
Ritchie, et al. (2009) [9] compared GHG emissions from
landfills with waste-to-energy technologies in Vancouver,
Canada. The results indicated that GHG emissions from
the waste-to-energy facilities were higher than those of the
landfills due to plastics remaining in the waste stream. In
2017, Hwang, et al. [10] estimated GHG emissions at nine
different technological incineration facilities in Korea by
measuring the GHG concentrations in the flue gas samples.
The research indicated that the emissions of IPCC default
82
Vietnam Journal of Science,
Technology and Engineering
values were estimated to be higher than those of the plantspecific emission factors. In 2010, Chen, et al. [11] studied
estimates of CO2 emissions from MSW incineration in
Taipei city, demonstrating the correlation between GHG
emissions and components of waste. Additionally, Marchi,
et al. (2017) [12] applied IPCC 2006 guidelines to calculate
GHG emissions from different waste treatment methods.
The research results helped to orient emission-reduction
strategies and environmental impacts of the waste sector in
the central Italy.
In 2014 in Vietnam, Ngan, et al. (2004) [13] conducted
a study to calculate CH4 emissions from MSW in Can Tho
city. Based on the city’s population size and economic
development conditions, predictions were made about
the total amount of CH4 gas to be generated from MSW
landfills in 2020. In 2015, Tuyen, et al. [14] estimated CH4
emissions from municipal waste landfills in Thu Dau Mot
city, Binh Duong province. Based on the different scenarios
of the MSW management and treatment master plan of
the province, the research results assessed the potential
for reclaiming and reusing CH4 gas from waste disposal
activities to 2030. In 2014 in Hue city, Tuan, et al. [15]
estimated the reduction potential of CH4 emissions from the
landfill and from composting. Based on different scenarios,
the study revealed that CH4 can be reduced by changing
from landfilling to composting. Giang, et al. (2013) [16]
also applied IPCC 2006 guidelines to evaluate the GHG
mitigation potential from MSW treatment in Vietnam via
landfilling and composting systems by creating various
management scenarios. This research illustrated that GHG
emissions from waste treatment can be reduced if energyrecovery methods are applied.
The above-mentioned studies estimated GHG emissions
from MSW treatment. However, the authors used only
statistical data on MSW proportion or default values from
IPCC 2006 without identifying the true data from study
areas. In addition, further studies on GHG emissions from
the composting method have not been conducted. According
to the Vietnamese Prime Minister’s Decision No. 609/QDTTg on 25 April 2014, approving a master plan for solid
waste disposal in Ha Noi to 2030, with a vision to 2050, the
estimate of GHG emissions from various MSW treatment
technologies is one of the most important objectives.
Therefore, this study was conducted to identify the current
MSW components in Ha Noi city and estimate the amount
of GHG emissions from different MSW treatment methods.
The research results will update the GHG emissions data
from the waste sector to help decision-makers select suitable
technologies for MSW treatment.
September 2019 • Vol.61 Number 3
Environmental Sciences | Ecology
Methodology
is mass of waste deposited in year t (tons/year), Lo is the
CH4 generation potential (tons) (calculated by Equation 2),
t is inventory year, x is opening year of disposal site or first
year of data available, k is reaction constant (k = ln(2)/t1/2
(year-1), t1/2 is half-life time (y), R(t) is recovered CH4 in year
t (tons/year), and OX is oxidation factor in year t.
Method to determine the MSW composition
Million ton
Million ton
The composition of MSW at Nam Son and Xuan Son
landfills was determined to provide the input data for
calculating GHG emissions from different MSW treatment
methods in Ha Noi instead of using the default values from
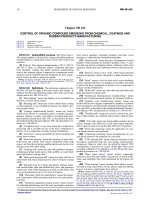
Data on the amount of MSW in landfills from 2007 to
the IPCC 2006 guidelines. The two samplings at each
2017 were collected from the annual report of the Ha Noi
landfill were taken at the same time each day at the burial
People’s Committee [20] and the Ha Noi GHG emission
cells after the trucks dumped their garbage loads and before
inventory report in 2015 [21]; they are illustrated in Fig. 1.
the garbage was compressed. In this research, the coning
The amount of MSW gradually increased over the years in
and quartering method was applied. The MSW samples
line with the growing population.
were placed in a conical heap. This heap was then divided
vertically into four equal parts by two lines at right angles
2,400
02
02
02
0202 02
2,400
02
to each other. Two opposite quarters were then mixed with
02
02 02 02
02
02
02
2,000
each other into one sample. The two other quarters were
2,000
02
02
discarded. This procedure was repeated until the established
02
02
1,600
1,60001
01
sample size reached 150 kg as in the guideline of TCVN
01
01
1,200
the9461:2012,
guideline of TCVN
9461:2012, the standard test method for determining the
1,200
the standard test method for determining the
,800
composition
of unprocessed
municipal solidmunicipal
waste in Vietnam
Large inor
composition
of unprocessed
solid[17].
waste
,800
,400
Vietnam
[17].
or long
cutsample
into was
smaller
long
objects were
cut Large
into smaller
pieces objects
(5-10 cm) were
before the
taken
,400
pieces (5-10 cm) before the sample was taken for sorting.
,000
forThe
sorting.
The samples
were manuallyclassified
classified and
and separated
separated intointo
11
2007 2008 2009 2010 2011 2012 2013 2014 2015 2016 2017
samples
were manually
,000
Year
11 components
(food, biodegradable
organic
2007 2008 2009 2010 2011 2012 2013 2014 2015 2016 2017
components
(food, biodegradable
organic matter,
gardenmatter,
waste,garden
paper,
1. Amount
of MSW
treated
in landfills
from 2007
2017 to
[20,
21].
1. Amount
of MSW
treated
in landfills
from
2017
waste, paper, cardboard, wood chips...) according to theFig.Fig.
Yearto2007
cardboard,
wood chips ...) according to the classification of IPCC 2006 [5] and [20, 21].
classification of IPCC 2006 [5] and the Vietnamese system
(Lo)ofis MSW
calculated
by Equation
(2):
CH4 generation
Fig. 1.potential
Amount
treated
in landfills
from 2007 to 2017 [20, 21
the[18].
Vietnamese system [18].
L = MCF
DOC × DOCpotential
× F ×
CH4×generation
(Lo) is calculated by Equation (2)
Methods
to qualify
GHG emissions
Equation factor
(2): for
CH
where
MCF
(Methanepotential
correction(LFactor)
is the CHby
4 generation
o) is calculated
Methods to qualify
GHG emissions
4 correction
(2):
aerobic decomposition in the year of deposition, DOC is degradable organic
Landfill:
L = MCF × DOC × DOC × F ×
Landfill:
(2) 3),
carbon in the year of deposition (tons C/tons waste) (calculated by Equation
where
MCF
(Methane
correction
Factor)
is
the
CH
correction facto
DOC
the fraction of DOC that can decompose, F is the fraction of 4CH
andCOCO
emissions
in landfills
mainly
TheCH
CH
in landfills
derive derive
mainly from
the iswhere
The
2
MCF (Methane correction Factor) is the CH4 in
4 4and
2 emissions
generated
landfill
gases,
and
16/12
is
the
molecular
weight
ratio
of
CH
/C.
decomposition in the year of deposition, DOC is degradable or
from the decomposition of organic components. In this aerobic
correction factor for aerobic decomposition in the year of
decomposition
of
organic
components.
In
this
study,
the
IPCC
2006
method
was
DOC
=
0.15A
+ 0.2B
+ 0.43D + (tons
0.24E +C/tons
0.15F waste) (calculated
carbon
in
the
year+is
of0.4C
deposition
study, the IPCC 2006 method was selected for calculating deposition,
DOC
degradable
organic
carbon in the year of(3) by Equatio
where
A
is
food
waste
(%);
B
is
garden
waste
(%);
C is pulp,F paper,
and
This method
assumesthat
that DOC
selected
for calculating
the 4amount
of CH4 generated.
generated.
This method
assumes
of DOC
that
can decompose,
is the
the amount
of CH
f is the fraction
deposition
waste)
(calculated
by Equation
3), fraction of C
cardboard
(%); D is(tons
wood C/tons
and wood
products
(%); E is rags
(%); F is diapers
degradable
organic
carbon
(DOC)
composition
generated
gases, and
16/12
iscan
thedecompose,
molecular weight
ratio of CH4/C.
DOC
is landfill
the
fraction
DOC
thatsurvey
F is the
thethedegradable
organic carbon
(DOC)
composition
will decompose
slowlywill
over
(%). These
above
ratios
are usedof
from
the true
data.
f
decompose slowly over many years (approximately 10), and Other
in+generated
landfill
gases,
and 16/12
is the
of
, 0.2B
F, MCF,
OX,
k) are
used
from
the
default
fractions
(DOC
DOC
= CH
0.15A
+ 0.4C
+and
0.43D
+ 0.24E
+ 0.15F
4
during that
period.value
In offraction
many
10), and that
that CH
4 is formed
is formed during
period.
In stable
conditions,
thatyears
CH4(approximately
=
0.5,
F
=
0.5,
IPCC
2006
for
unclarified
MSW,
in
which:
DOC
/C.
molecular
weight
ratio
of
CH
where A is food waste (%); 4B is garden waste (%); CMCF
is pulp, paper
mainlymainly
on theonamount
the conditions,
CH4 produced
= 0.6, OX = 0.1, and k is shown in Table 1.
stable
the CH4depends
produced depends
the amountofofcarbon
carbon
cardboard
(%);
D
is
wood
and
wood
products
(%);
E
is
rags
DOC = 0.15A + 0.2B + 0.4C + 0.43D + 0.24E + 0.15F (3) (%); F is di
accumulated in burial cells. CO2 emission was not included
Table(%).
1. R eaction
constant
(k) [19].
These above
ratios
are used from the true survey data.
was not included in the IPCC 2006
accumulated
in burial cells. CO2 emission
in the IPCC 2006 method
because it had been calculated
Symbol where
Composition
Symbol
Used
A
is
food
waste
(%); B, Used
is
waste
(%);k)
C is
F, garden
MCF,
OX, Composition
and
arepulp,
used from the de
Other fractions (DOC
value
method
it had beenForest,
calculatedand
in theLand
Agriculture,
Forest, and
Land Use paper, and cardboard (%); f Dvalue
in thebecause
Agriculture,
Use Sector
(AFOLU).
is
wood
and
wood
products
A
Food,
organic
matters
0.4
D
Milled
wood
0.035
value of IPCC 2006 for unclarified MSW, in which: DOCf = 0.5, F = 0.5,
According
the IPCC
(Chapter
B
Garden
(leaves, twigs,
0.17 (%). EThese above
Rags ratios 0.7
E garbage
is =rags
diapers
are
Sector
(AFOLU).toAccording
to the2006
IPCC 2006
(Chapter3,3,Volume
Volume 5) 5)[19],[19],
CH
4 = (%);
0.6,
OX
0.1,(%);
and Fk is
is shown
in Table 1.
grass...)
CH4 emission from landfills after one year is calculated Cas used
from
the
true
survey
data.
Paper, cartons
0.07
F
Diapers
0.17
emission
from landfills
Table 1. R eaction constant (k) [19].
in Equation
(1): after one year is calculated as in Equation (1):
f
4
4
f
f
Other fractions (DOCf, F, MCF, OX, and k) are used
Used
Symbol Composition
6
( ) ((
unclarified MSW,
*∑ *
)
)+ ( )+ (
) (1)
(1) from the default value of IPCC 2006 forvalue
= 0.5,
F = 0.5, MCF = 0.6,
k
DOC
Ain which:
Food,
organic
matters
0.4 OX =D0.1, andMilled
wood
f
B
Garden
garbage
(leaves,
twigs,
0.17
E
Rags
is
CH
emitted
in
year
t
(tons/year),
MSW
where
is
shown
in
Table
1.
where
CH4CH
is
CH
emitted
in
year
t
(tons/year),
MSW
is
mass
of
waste
4 emission 4
4
x
emission
x
( )
Symbol Composition
grass...)
Paper, cartons
0.07
F
deposited in year t (tons/year), Lo is the CH4 generation potential (tons) C
(calculated by Equation 2), t is inventory year, x is opening year of disposal site
6 of Science,
Vietnam Journal
or first year of data available, k is reaction constant (k = ln(2)/t1/2 (year-1September
), t1/2 is 2019 • Vol.61 Number 3 Technology
and Engineering
half-life time (y), R(t) is recovered CH4 in year t (tons/year), and OX is
Diapers
83
Us
va
0.0
0.7
0.1
Environmental Sciences | Ecology
Table 1. Reaction constant (k) [19].
Symbol
Composition
Used value Symbol
Composition
Used value
A
Food, organic matters
0.4
D
Milled wood
0.035
B
Garden garbage
(leaves, twigs, grass...)
0.17
E
Rags
0.7
Paper, cartons
0.07
Diapers
100
0.17
Composting:
CO2, CH4, and N2O are all by-products of the composting
process. As mentioned above, CO2 emissions from
composting were not included in the IPCC 2006 method.
CH4 and N2O emissions from composting can be estimated
by using the default method of IPCC 2006 (Chapter 4,
Volume 5) [22] and given in Equations (4) and (5) below:
Fig.
CH4Emission = ∑i(Mi × EF_CH4i) × 10-3 - R
(4)
N2OEmission = ∑i(Mi × EF_N2Oi ) × 10-3
(5)
80
Thousand ton
F
120
Thousand ton
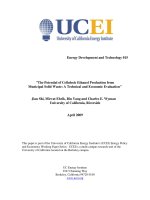
C
by composting technology gradually decreased over time
due to the unstable fertilizer quality. This, in turn, led to
inadequate funds for operation, so private enterprises did
not prioritize
investment.
140
121
140
120
90
90
75
80
60
40
40
0
116
100
60
20
121
116
75
20
0
2014
2014
2015
2015
2016
Year
2016
2017
2017
Fig.2. 2.
Amount
of MSW
treated
by composting
Fig.
Amount
of MSW
treated
by composting
[21]. [21].
Year
Incineration:
Incineration:
In this research,
GHG emissions
deriving [21].
from incineration are only
2. Amount
of MSWthetreated
by composting
estimated.
The emissions
burning
are not known
due to the
lack of
In this
research,fromtheopen
GHG
emissions
deriving
from
data.
CO2, CH4, and N2O emissions from waste incineration are calculated as in
Incineration:
incineration are only estimated. The emissions from open
Equations (6), (7), and (8), respectively (IPCC 2006, Chapter 5, Volume 5) [23].
In
this research,
GHGdue
emissions
deriving
from CO
incineration
, CH4, are only
burning
are not the
known
to the lack
of data.
2
)
∑(
(6)
estimated.
burning
are not known
due to the
lack of
where CH4Emission is total CH4 emissions in the inventory
emissionsfrom
fromopen
waste
incineration
are calculated
and The
N Oemissions
where CO22Emission is CO2 emission in the inventory year (tons/year); MSW is the
data. total
CO
, CH
and
N2O(6),
incineration
calculated
4, of
year (tons/year), N2OEmission is total N2O emissions in the
as 2amount
in
Equations
(7),
andfrom
(8), waste
respectively
(IPCC
2006,
MSW
asemissions
wet
weight
incinerated
(tons/year);
WFi are
is the
fraction as in
of
waste
type/material
of
component
i
in
the
MSW
(as
wet
weight
incinerated);
Equations
(6),
(7),
and
(8),
respectively
(IPCC
2006,
Chapter
5,
Volume
5) [23].
inventory year (tons/year), M is mass of organic waste Chapter 5, Volume 5) [23].
i
dm is dry matter content in the component i of the MSW incinerated; CF is the
i
i
treated by biological treatment type i (tons/year), EF_CH4i is fraction
)
(6)
carbon in the dry ∑(
matter of component i; FCFi is the fraction
of
COof2Emission
(6)fossil
the emissions factor for treatment i (gCH4/kg waste treated), carbon in the total carbon of component i; OFi is the oxidation factor; 44/12 is
where CO2Emission
CO2 emission
in the inventory
year
(tons/year);
MSW is the
is CCO
ini =the
inventory
year
COis2Emission
conversion
factor from
to 2COemission
1); and
i is the component
2 (with: ∑WF
EF_N2Oi is the emissions factor for treatment i (gN2O/kg thewhere
total of
amount
of MSW
as wet
incinerated
iswood,
the fraction
the MSW
incinerated
such
as paper/cardboard,
textiles,
food WF
waste,
(tons/year);
MSW
is weight
the
total
amount(tons/year);
of MSW
as i wet
waste treated), 10- 3 is the conversion factor from kilogram garden
(yard) and park
waste,
disposable
nappies,
rubber
and
leather,
plastics,
of waste
type/material
of
component
i
in
the
MSW
(as
wet
weight
incinerated);
weight
incinerated (tons/year); WFi is the fraction of waste
to ton, i is composting or anaerobic digestion, and R is total metal,
glass, and other inert waste.
dry matter content
in the component
i ofMSW
the MSW
incinerated;
CFi is the
dmi is type/material
of∑ component
i in the
(as wet
weight (7)
amount of CH4 recovered in the inventory year (tons/year).
(
)
fractionincinerated);
of carbon in dm
the dry
matter
of component
i; FCF
i is the fraction
is dry
matter
content in the
component
i of (8)of fossil
i (
∑
)
Currently, Ha Noi conducts composting only ascarbon
a the
the
oxidation
factor;
44/12 is
in MSW
the
carbon
of component
i; OFi isof
carbon
in theIW
dry
incinerated;
CFi isinthe
is CH4 emissions
thefraction
inventory
year
(tons/year),
where
CH4total
Emission
i is the
biological treatment method. The composted waste
is
the
aggregate
amount
of
solid
waste
of
type
i
incinerated
(tons/year),
EF_CH
the conversion
factor
from
C
to
CO
(with:
∑WF
=
1);
and
i
is
the
component
4i
i of fossil
carbon
matter of component i; FCF2i is the fraction
4 emission factor (g CH4/ton of waste), EF_N2Oi is the aggregate N2O
is organic matter with a certain moisture content; it ofis theCH
MSW
incinerated
such
as
paper/cardboard,
textiles,
food
waste, wood,
in the total carbon of component i; OF is the oxidation
emission factor (g N2O/ton of waste), 10-3 is thei conversion factor from
necessary to ensure proper moisture for microorganisms.
gardenfactor;
(yard) 44/12
and park
waste,
disposable
nappies,
and2 (with:
leather, plastics,
is the
conversion
fromrubber
C to CO
8 factor
Therefore, the default factors of IPCC 2006 guidelines are
= 1);
andinert
i is the
component of the MSW incinerated
metal, ∑WF
glass, i and
other
waste.
used for calculation.
such as paper/cardboard,
textiles, food waste, wood, garden
∑(
)
(7)
Because the MSW treated at the composting plants (yard) and park waste, disposable nappies, rubber and
∑(
)
(8)
is moist, the default values of wet weight were chosen leather, plastics, metal, glass, and other inert waste.
where CH
is CH emissions in the inventory year (tons/year), IW is the
4 Emission
4
i
for calculation (CH4 = 4 (gCH4/kg wet waste) and N2O
(7)
CH4Emission = ∑i(IWi × EF_CH4i )× 10-6
is
the
aggregate
amount
of
solid
waste
of
type
i
incinerated
(tons/year),
EF_CH
4i
= 0.3 (gN2O/kg wet waste)). Ha Noi city has no biogas
-6
=∑
(IW
×
EF_N
O
)×
10
(8)
N2OEmission
emission
factor
(g
CH
/ton
of
waste),
EF_N
O
is
the
aggregate
N2O
CH
4
4
2
i
i
i
2 i
recovery facilities, so the total amount of CH4 recovered
-3
waste), in10the inventory
is the conversion
factor from
factor
(g N2O/ton
is CH4 of
emissions
year (tons/
CH4Emission
in an inventory year (R) is irrelevant. Due to the lack emission
of where
8
statistical data on MSW treated by composting before 2014, year), IWi is the amount of solid waste of type i incinerated
this study estimated GHG generation only from composting (tons/year), EF_CH4i is the aggregate CH4 emission factor
methods during 2014-2017. The MSW treated by this (g CH4/ton of waste), EF_N2Oi is the aggregate N2O
method is illustrated in Fig. 2. The amount of MSW treated emission factor (g N2O/ton of waste), 10-3 is the conversion
84
Vietnam Journal of Science,
Technology and Engineering
September 2019 • Vol.61 Number 3
Environmental Sciences | Ecology
factor from kilogram to ton, and i is the category or type
of waste incinerated. Due to the lack of data on CH4 and
N2O emission factors for each type of waste incinerated, the
emission factors from the IPCC 2006 default values (EF_
CH4 = 0.2 g/ton MSW and EF_N2O = 50 g/ton MSW) are
used for calculation.
Table 2. Fractions of dmi, CFi, FCFi, WFi [23].
MSW composition
dmi (%)
CFi (%)
FCFi (%)
WFi
Food, organic matter
40
38
0
64.2
Garden garbage (leaves, twigs) grass...)
40
49
0
6.2
Paper, cartons
90
46
1
3.2
50
0
3.4
50
20
2.6
70
10
1.8
75
100
2.6
67
20
2.3
NA
NA
1.6
NA
NA
2.5
3
100
9.6
In this study, the Global Warming Potentials (GWPs)
Milled wood
85
from IPCC 2006 [5] are used to change CH4 and N2O to
80
kilogramCO
to ton,
i isthe
theGWP
category
or type
of CO
wasteand
incinerated.
Due toRags
the
in and
which
of CH
= 25
N2O = 298
2e
4
2
Diapers
40
factors
each type
lack of CO
data. These
on CHnumbers
4 and N2O
areemission
calculated
for afor
100-year
timeof waste
2
incinerated, the emission factors from the IPCC 2006 default values (EF_CHPlastic
4 =
100
horizon. As in the composting case, GHG emissions from
0.2 g/ton MSW and EF_N2O = 50 g/ton MSW) are used for calculation.
incineration were estimated from 2014 to 2017. The amount
Rubber, leather
84
In this study, the Global Warming Potentials (GWPs) from IPCC 2006 [5]
of
MSW
treated
by
this
method
was
collected
from
the
Metals2
100
are used to change CH4 and N2O to CO2e in which the GWP of CH4 = 25 CO
National
Environmental
Thematic
Report
in
2017
[2]
and
and N2O = 298 CO2. These numbers are calculated for a 100-year time horizon.
Glass and porcelain
100
thecomposting
Maintenance
Committee
of the Technical
Infrastructure
As in the
case,
GHG emissions
from incineration
were estimated
Other types
90
Works,
Ha The
Noi amount
Department
of Construction
3). was
Thecollected
from 2014
to 2017.
of MSW
treated by this(Fig.
method
from theamount
National
Environmental
Thematic
Report
in 2017
of MSW
incinerated
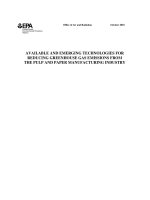
increased
annually,
except[2]in and the
Results and discussion
Maintenance
the Technical
Infrastructure
2017, Committee
because theof Phuong
Dinh and
Thanh CongWorks,
plants Ha Noi
Department
Construction
(Fig. 3). The amount of MSW incinerated increased
Composition of MSW in Ha Noi
wereofclosed
for maintenance.
annually, except in 2017, because the Phuong Dinh and Thanh Cong plants were
Table 3 illustrates that the components of MSW are
closed for maintenance.
somewhat different between Xuan Son and Nam Son. The
proportion of organic waste in Xuan Son (64.2%) is more
200
than that Nam Son (58.4%). This result is consistent with
MSW components in Ha Noi reported in the 2016 National
150
Environmental Status Report (54-77%) [24]. It is lower than
100
that of Thu Dau Mot city, Binh Duong province (78.5%)
[14], and Can Tho city (80%), while recyclable components
50
are the same [13]. These results may depend on the collected
0
sources; Nam Son landfill receives MSW from metropolitan
2014
2015
2016
2017
areas Nam Tu Liem, Bac Tu Liem, Soc Son, Dong Anh, Me
Year
Linh, and Thanh Tri districts while Xuan Son treats MSW
Fig . 3. Amount
of MSWoftreated
by incinerators
[2]. [2].
Fig. 3. Amount
MSW treated
by incinerators
from Son Tay town and remaining suburban districts. In
Because combustion technology applied at incineration plants in Ha Noi
the urban areas, residents more frequently buy food from
combustion
technologychamber,
applied at
(incineratorBecause
includes 01
primary combustion
01incineration
secondary combustion
supermarkets that has been pre-processed to remove unused
chamber,plants
02 heat
dust settlements,
primary
in chambers
Ha Noiand
(incinerator
includes
01 furnace
primary temperature
o
o
parts while suburban residents can harvest directly from the
reaches:combustion
800-900 C; secondary
temperature
reacheschamber,
,200
1 C) is similar
chamber, furnace
01 secondary
combustion
to that from the IPCC default, other fractions such as dry matter content garden.
in the As a result, the garden garbage rate in Xuan Son is
02 heat chambers and dust settlements, primary furnace
component i of the MSW incinerated (dm
),
carbon
in
the
dry
matter
of
i,
twice
temperature reaches: 800-9000C; secondary furnace ), and as high as that in Nam Son, while the rate of recyclable
component i (CFi ), fossil carbon in the total carbon of component i (FCF
i
substances such as paper and cartons in Nam Son (6%) is
0
C)IPCC
is similar
to thatvalues
from are
the used
temperature
1,200
oxidation
factor (OF i reaches
= 100) from
the
200 6 default
for
IPCC
default,
calculation
(Table
2). other fractions such as dry matter content in higher than that in Xuan Son (3%). The results tend to be
the component i of the MSW9 incinerated (dmi,), carbon in similar for other inorganic waste components. It probably
the dry matter of component i (CFi), fossil carbon in the relies on keeping garbage for sale to recycling facilities
total carbon of component i (FCFi), and oxidation factor of suburban residents. Generally, the proportion of MSW
(OFi = 100) from the IPCC 2006 default values are used for components depends on living habits, standards, economic
calculation (Table 2).
conditions, and the civilization of each region.
Thousand ton
250
September 2019 • Vol.61 Number 3
Vietnam Journal of Science,
Technology and Engineering
85
Environmental Sciences | Ecology
Table 3. Composition of MSW in Nam Son and Xuan Son
landfills.
No. Composition
Nam Son (%) Xuan Son (%)
1
Food, organic matter
58.8
2
Average
CH4 in year t is generated from the biodegradation of organic
ingredients that existed in landfills in previous years. With
the calculation starting from 2007, the results are presented
in Table 5.
64.2
61.5
Garden garbage (leaves, twigs, grass...) 2.8
6.2
4.5
3
Paper, cartons
6.0
3.2
4.6
Year
CH4
CO2eq
4
Milled wood
3.6
3.4
3.5
2008
7,626
190,650
5
Rags
2.9
2.6
2.8
6
Diapers
2.3
1.8
2009
13,692
342,300
2.1
7
Plastic
3.2
2.6
2.9
2010
18,750
468,750
8
Rubber, leather
2.3
2.3
2.3
2011
23,302
582,550
9
Metals
2.0
1.6
1.8
2012
26,884
672,100
10
Glass and porcelain
3.9
2.5
3.2
2013
30,467
761,675
11
Sludge
0.2
0.4
0.3
2014
33,692
842,300
12
Other types
12.0
9.3
10.7
2015
36,894
922,350
2016
39,244
981,100
2017
41,100
1,027,500
Total
271,651
6,791,275
Quantification of GHG emissions from different MSW
treatment methods
GHG emissions from landfills:
CH4 emissions at landfills in Ha Noi city are calculated
according to Equations (1), (2), and (3) in which the
Degradable Organic Carbon (DOC) values (Table 4) were
calculated based on the average rate of each component of
MSW in Xuan Son and Nam Son landfills and the default
coefficient values in the IPCC 2006 [19]. Because of the
lack of data on MSW composition in the past, the field
survey results in the research are used to calculate CH4
emission from landfills in 2007-2017.
Table 4. DOC value.
No.
Symbol
Composition
DOC (%)
1
A
Food, organic matter
8.8
2
B
Garden garbage (leaves, twigs, grass...)
0.6
3
C
Paper, cartons
2.4
4
D
Milled wood
1.6
5
E
Rags
0.7
6
F
Diapers
0.5
DOC = 0.15A + 0.2B + 0.4C + 0.43D + 0.24E + 0.24F
14.6
With the input parameters of the IPCC 2006 model
determined, the calculation results revealed that CH4
emissions increase with time and amount of MSW buried.
86
Vietnam Journal of Science,
Technology and Engineering
Table 5. CH4 generated at landfills from 2008-2017 (in tons).
The results revealed that, in 2008, approximately 7,626
tons of CH4 was emitted per year, equivalent to 190,650
tons of CO2e per year. In 2017, the amount of CH4 emission
was 41,100 tons per year, equivalent to 1,027,500 tons of
CO2e per year. The total amount of CO2e emissions in the
period 2007-2017 was 6,791,275 tons. The calculation
result reveals that food waste was the main source of CO2e,
emissions accounting for 90% of total CO2e emissions into
the environment. The remaining waste components such
as paper, wood, and cloth accounted for only 10% of total
CO2e emissions. If no gas recovery methods or measures to
minimize GHGs generated from landfills are implemented,
these emissions will increase the greenhouse effect and
exacerbate climate change.
Based on the total amount of MSW landfilled [20, 21]
and the total estimated GHG amount from 2008 to 2017,
GHG emissions from the landfills in Ha Noi would be 327
kg of CO2e per ton of MSW treated. This value is nearly
same as the case study of conventional landfills in Denmark
(300 kg of CO2e per ton) [6]; is lower than that from the
Vancouver landfill (382 kgCO2e per ton) in Canada [25];
and is higher than that in China (259.5 kg of CO2e per
ton) with a biodegradable fraction (almost 60-70%) [26].
This difference is due to the waste properties, weather
September 2019 • Vol.61 Number 3
Environmental Sciences | Ecology
characteristics, and various infrastructures in these research
areas.
GHG emissions from composting:
Composting is an aerobic process in which a large
fraction of DOC in the waste components is converted
into CO2 [22]. CH4 is formed because anaerobic digestion
takes place in the compost pile when not enough oxygen
is supplied. Composting releases CH4 from 1% to a few
percent of the initial carbon content and N2O from 0.5%
to 5% of the initial nitrogen content. Poor composting
is likely to produce more of both CH4 and N2O [14]. By
applying Equations (4) and (5), CH4 and N2O generated by
composting are displayed in Table 6.
Table 6. Total amount of CH4 and N2O generated by composting
(in tons).
Year
CH4
CO2e from CH4
N 2O
CO2e from N2O
Total CO2e
2014
483
12,075
36.22
10,794
22,869
2015
463
11,575
34.72
10,347
21,922
2016
360
9,000
26.97
8,037
17,037
2017
302
7,550
22.63
6,744
14,294
Total
1,608
40,200
120.54
35,922
76,122
Table 6 illustrates that total CH4 emissions from 2014 to
2017 amounted to 1,608 tons (equivalent to 40,200 tons of
CO2e); N2O emissions amounted to 120.54 tons (equivalent
to 35,922 tons of CO2e). The total amount of CO2e generated
in 2017 decreased by 37% compared to 2014. The reason
is that the MSW treated by composting decreased due to
high investment and operational costs but low income
from the sale of composting fertilizer. Based on the total
amount MSW composted and the total GHG generated
annually from 2014 to 2017, the GHG emissions resulting
from composting facilities in Ha Noi would be 189 kg of
CO2e per ton of MSW treated. This value is within the GHG
emissions range (3.2-262 kg of CO2e per ton of MSW) from
the research results of Melissa, et al. (2017) [25] in Panama
with the same composting technology and waste humidity.
GHG emissions from incineration:
Equation (6) was used to estimate CO2 generated from
incinerators. Because incineration is mainly implemented
in Xuan Son, the clarification results from the Xuan Son
landfill are used for calculations in this case. The CO2
emissions from MSW incineration are presented in Table 7.
Table 7. CO2 emissions from incineration (in tons).
MSW composition
2014
2015
2016
2017
Food, organic matter
-
-
-
-
Garden garbage (leaves) twigs, grass...)
-
-
-
-
Paper, cartons
56
99
106
69
Milled wood
-
-
-
-
Rags
884
1,549
1,664
1,076
Diapers
214
375
403
261
Plastic
8,288
14,522
15,596
10,085
Rubber, leather
1,100
1,928
2,071
1,339
Metals
-
-
-
-
Glass and porcelain
-
-
-
-
Other types
1,102
1,930
2,073
1,340
Total
11,645
20,404
21,912
14,169
Total CO2 emissions from incinerators during the period
2014-2017 were 68,000 tons, with the highest in 2016
(21,912) and the lowest in 2014 (11,645). In the comparison
of different MSW components, burnt plastic generates the
highest CO2 emissions by years; the total CO2 emission
from plastic in four years was 48,500 tons, which accounted
for 71% of total CO2e emissions.
Equations (7) and (8) were applied to estimate CH4 and
N2O emissions from incineration. The results are displayed
in Table 8.
Table 8. CH4 and N2O emissions from MSW incineration (in
tons).
Year
CH4
CO2e from CH4
N 2O
CO2e from N2O
Total CO2e
2014
0.023
0.580
5.796
1,727
1,728
2015
0.041
1.016
10.155
3,026
3,027
2016
0.044
1.091
10.906
3,250
3,251
2017
0.028
0.705
7.052
2,102
2,102
Total
0.136
3.392
33.909
10,105
10,108
From 2014 to 2017, total emissions of CH4 and N2O
were 136 kg of CH4 (~3.4 tons of CO2e) and 3.391 tons of
N2O (~10,105 tons of CO2e); the total CO2e generated was
10,109 tons. The amount of CO2 is the main GHG emission
from incineration; it accounts for 87% of total GHG
September 2019 • Vol.61 Number 3
Vietnam Journal of Science,
Technology and Engineering
87
Environmental Sciences | Ecology
emissions from incineration. On average, CO2e emitted kg of CO2e per ton) and 3.19 times higher than that from
from this treatment method is 115 kg of CO2e per ton of incineration (115 kg of CO2e per ton). The GHG emissions
waste. This value in Korea is 134±17 kg of CO2 per ton of from landfills comprise nearly 90% of GHG emissions from
waste [11]. It is a bit larger than that in the Ha Noi case. MSW disposal activities in Ha Noi. The results also indicate
The GHG emissions at incineration plants are different due that if no gas-recovery measures (especially on CH4) are
to operational systems (i.e., stoker, fluidized bed, moving introduced for energy production, the GHG generated from
grate, rotary kiln, and kiln and stoker), therefore, this MSW treatment facilities will contribute significantly to the
result is valid only for the current case. If, in the future, greenhouse effect and exacerbate climate change. These
incineration plants are different due to operational systems (i.e., stoker,research
fluidized
results provide the basis information for decisionHanoi invests new waste incinerator systems with other
bed, moving grate, rotary kiln, and kiln and stoker), therefore, this result
is valid
makers
to
consider when determining appropriate MSW
technologies, the GHG generated on the volume of waste
only for the current case. If, in the future, Hanoi invests new waste incinerator
treatment
technology
for Ha Noi in the context of increasing
be re-estimated to avoid errors.
systems withtreated
other should
technologies,
the GHG generated on the volume of waste
population pressure and environmental pollution.
treated should beThe
re-estimated
to avoidlevels
errors.
GHG emission
of the different MSW
The author declares that there is no conflict of interest
treatment methods in Ha Noi are presented in Fig. 4. The
regarding
figure
illustrates
that landfills
generate MSW
the highest
amount
treatment
methods in Hathe publication of this article.
The GHG
emission
levels
of the different
of GHGinemissions,
1.94 figure
times higher
than composting
and generate
Noi are presented
Fig. 4. The
illustrates
that landfills
the
REFERENCES
3.19oftimes
than incineration.
reason
that the
highest amount
GHGhigher
emissions,
1.94 times The
higher
thanis composting
and
3.19
[1] Ha Noi Statistical Office (2018), Ha Noi city statistical
process at landfills
continues
to happen
after the process
times higheranaerobic
than incineration.
The reason
is that
the anaerobic
at (in Vietnamese).
yearbook 2017
cell is fully filled. In addition, the MSW is usually treated
landfills continues to happen after the cell is fully filled. In addition, the MSW
is
[2] Vietnam
Environment Administration (2018), National
immediately after it is transported to the composting and
environmental
usually treated immediately after it is transported to the composting and thematic report in 2017 topic: waste management (in
incineration facilities. These data illustrate that landfills will Vietnamese).
incineration facilities.
These data illustrate that landfills will contribute more
contribute more significantly to long-term environmental
[3] Ha Noi City People’s Committee (2017), Annual report on
significantly impacts
to long-term
environmental
than other
MSW disposal impacts
methods. than other MSWthedisposal
situation and management of domestic solid waste and ordinary
methods.
industrial solid waste in Ha Noi city (in Vietnamese).
kg CO2e /ton of waste treated
350
327
[4] IPCC (2006a), Waste generation, composition and management
data, Volume 5: Waste, Chapter 2.
300
250
189
200
150
115
100
50
0
Landfill
Composting
Incineration
4. CO2e emissions
the different
treatment
methods.
emissions
from thefrom
different
treatment
methods
.
Fig . 4. CO 2e Fig.
[5] S.K. Singh, G. Anunay, G. Rohit, G. Shivangi and V. Vipul
(2016), “Greenhouse gas emissions from landfills: a case of NCT of
Delhi”, India Journal Climatology Weather Forecasting, 4(1), pp.1-9.
[6] C. Zhang, Y. Guo, X. Wang, S. Chen (2019), “Temporal
and spatial variation of greenhouse gas emissions from a limitedcontrolled landfill site”, Environment International, 217, pp.387-394.
[7] Y.H. Dong, A.K. An, Y.S. Yan, S. Yi (2017), “Hong Kong’s
greenhouse gas emissions from the waste sector and its projected
changes by integrated waste management facilities”, Journal of
Cleaner Production, 149, pp.690-700.
Conclusions Conclusions
[8]. S. Manfredi, D. Tonini, T.H. Christensen (2009), “Landfilling
accounting of greenhouse gases and global warming
The research results demonstrate that organic waste is ofthewaste:
main
contributions”, Waste Management & Research, 27, pp.825-836.
The
research
results
demonstrate
that
organic
waste
is
component of MSW in Ha Noi (61.5%). Currently, Ha Noi has three main MSW
the main component of MSW in Ha Noi (61.5%). Currently,
[9] N.
Ritchie and C. Smith (2009), “Comparison of greenhouse
treatment methods;
landfilling accounts for approximately 89.5% of the
total
Ha Noi has three main MSW treatment methods; landfilling gas emissions from waste-to-energy facilities and the Vancouver
finally
amount of waste collected, followed by incineration (10%), and
accounts for approximately 89.5% of the total amount landfill”, Technical Memorandum, />greenhouse%20Emmissions.pdf.
composting (0.5%).
The
GHG
released
from
MSW
treatment
in
Ha
Noi
city
in
of waste collected, followed by incineration (10%), and
2017 was 6.7finally
million
tons of (0.5%).
CO2e from
landfills,
16,300
K.L. Hwang, S.M. Choi, M.K. Kim, J.B. Heo (2017),
2e from
composting
The GHG
released
from tons
MSWof CO[10]
“Emission
of greenhouse gases from waste incineration in Korea”,
composting.
GHG emissions
incineration, treatment
and 76,100
of CO
2e from
in Hatons
Noi city
in 2017
was 6.7
million tonsThe
of CO
2e
Journal of Environmental Management, 196, pp.710-718.
from landfillsfrom
is the
highest16,300
(367 kg
ofof
CO
per
tonincineration,
of waste treated),
landfills,
tons
CO
from
and 1.94 times
2e 2e
[11] T.C. Chen and C.F. Lin (2010), “CO2 emission from
ton) and 3.19
times
higher than that
from
kg of The
COGHG
76,100
tons composting
of CO2e from (189
composting.
2e peremissions
municipal solid waste incinerator: IPCC formula estimation and flue
fromfrom
landfills
is the highest
of CO
per
ton
of
waste
incineration
(115(367
kg kg
of CO
per
ton).
The
GHG
emissions
higher than that
gas measurement”, Environmental Engineering and Management,
2e 2e
pp.9-17.
1.94 nearly
times higher
that from
composting
from landfillstreated),
comprise
90% than
of GHG
emissions
from(189
MSW20(1),
disposal
15
88
Vietnam Journal of Science,
Technology and Engineering
September 2019 • Vol.61 Number 3
Environmental Sciences | Ecology
[12] M. Marchi, F.M. Pulselli, S. Mangiavacchi, F. Menghetti,
Marchettini Na, S. Bastianoni (2017), “The greenhouse gas inventory
as a tool for planning integrated waste management systems: a case
study in central Italy”, Journal of Cleaner Production, 142, pp.351359.
[13] N.V.C Ngan, L.H. Viet, N.X. Hoang and V.T. Trung (2014),
“Calculation of CH4 emissions from domestic waste in the inner city
of Can Tho City”, Journal of Science, Can Tho University, 31, pp.99105 (in Vietnamese).
[14] N.T.K. Tuyen, H.T.K. Yen and P.T.T. Tam (2015), “Application
of IPCC model (2006) to estimate methane emissions from domestic
solid waste, in Thu Dau Mot city, Binh Duong province”, Journal of
Science, Can Tho University, Issue: environment and climate change,
pp.183-192 (in Vietnamese).
[15] T.N. Tuan (2014), “Assessment of CO2e emission reduction
of solid waste composting versus landfilling in Hue city”, Journal of
Science and Technology, Hue University of Science, 1(1), pp.143-150
(in Vietnamese).
[16] H.M. Giang, N.D. Luong, L.T.M. Huong (2013), “Assessment
of potential greenhouse gas mitigation of available household solid
waste treatment technologies”, Waste Technology, 1(1), pp.10-16.
[17] National standard TCVN 9461:2012, Standard test method
for determination of the composition of unprocessed municipal solid
waste.
[18] Decision No. 2359/QD-TTg of Prime Minister on approving
the national system of GHG inventories in Vietnam (appendix VIII).
[19] IPCC (2006b), Volume 5: Waste, Chapter 3: Solid waste
disposal.
[20] Ha Noi People’s Committee (2007-2018), The annual report
on the situation of generation and management of domestic solid waste
and ordinary industrial solid waste in Ha Noi city (in Vietnamese).
[21] Department of Meteorology, Hydrology and Climate Change
(2016), Ha Noi city greenhouse gas inventory report in 2015 (in
Vietnamese).
[22] IPCC (2006c), Biological treatment of solid waste, Volume
5: Waste, Chapter 4.
[23] IPCC (2006d), Incineration and open burning of waste,
Volume 5: Waste, Chapter 5.
[24] Ministry of Natural Resources and Environment (2016),
National environmental status report, Chapter: Urban solid waste (in
Vietnamese).
[25] W. Melissa, B.C. Jeffrey, S. Edgar (2017), “Estimating
national landfill methane emissions: an application of the 2006 IPCC
waste model in Panama”, Journal of the Air & Waste Management
Association, 50, pp.636-640.
[26] Y. Liu, Ni Zhe, X. Kong, J. Liu (2017), “Greenhouse gas
emissions from municipal solid waste with a high organic fraction
under different management scenarios”, Journal of Cleaner
Production, 147, pp.451-457.
September 2019 • Vol.61 Number 3
Vietnam Journal of Science,
Technology and Engineering
89