Late-medieval plagioclase-titanaugite-bearing Iron Slags of the Yapraklı Area (Çankırı), Turkey
Bạn đang xem bản rút gọn của tài liệu. Xem và tải ngay bản đầy đủ của tài liệu tại đây (2.25 MB, 24 trang )
Turkish Journal of Earth Sciences (Turkish J. EarthW.E.
Sci.),SHARP
Vol. 20,&2011,
pp. 321–335 . Copyright ©TÜBİTAK
S.K. MITTWEDE
doi:10.3906/yer-0904-4
First published online 25 October 2010
Late-medieval plagioclase-titanaugite-bearing Iron Slags
of the Yapraklı Area (Çankırı), Turkey
W.E. SHARP1 & STEVEN K. MITTWEDE1,2
1
Department of Earth and Ocean Sciences, University of South Carolina, Columbia,
South Carolina 29208, USA (E-mail: )
2
Müteferrika Consulting and Translation Services Ltd., P.K. 290, Yenişehir, TR−06443 Ankara, Turkey
Received 01 April 2009; revised typescript received 18 February 2010; accepted 14 May 2010
Abstract: A mineralogical, mineral-geochemical and 14C geochronological study of slags, previously identified as copper
slags, in the Yapraklı area (Çankırı Province) of central Anatolia, has demonstrated that these are late-medieval iron
slags consisting mainly of fayalite, glass, plagioclase, titanaugite, ulvöspinel and metallic iron. Because of the high lime
content, relative to other medieval and Roman slags, these slags are quite anomalous in their lack of both modal and
normative wüstite. Further study of these sites could shed light on the mining history and smelting methods of central
Anatolia during a relatively obscure period of major socio-ethnic transition.
Key Words: iron slag, plagioclase, titanaugite, ulvöspinel, fayalite, leucite, iron smelting, late-medieval
Yapraklı (Çankırı, Türkiye) Yöresindeki Ortaçağa Ait Olan Plajiyoklaz ile
Titanojiti İçeren Demir Cürufları
Özet: Yapraklı (Çankırı, İç Anadolu) civarında bulunan ve daha önce bakır cürufları düşünülmüş olan cüruflar üzerine
mineralojik, mineral-jeokimyasal ve 14C jeokronolojik çalışmaların sonuçlarıyla bu cürufların geç-ortaçağa ait demir
cürufları olup fayalit, cam, plajiyoklaz, titanojit, ulvöspinel ve metalik demirden ibaret oldukları tespit edilmiştir. Diğer
ortaçağa ve Romalılara ait olan cüruflara nazaran, yüksek CaO değerleri yüzünden bu cüruflarda wüstitin modal
ve normatif olarak bulunmaması müstesnadır. Bu cüruf zuhurları üzerine daha fazla araştırmanın yapılmasıyla İç
Anadolu’nun önemli ama az bilinen sosyo-etnik geçiş döneminin madencilik tarihi ve o dönemde uygulanmış olan
izabe yöntemlerine ışık tutabilecek.
Anahtar Sözcükler: demir cürufu, plajiyoklaz, titanojit, ulvöspinel, fayalit, lösit, demir izabesi, geç-ortaçağ
Introduction
While investigating the geology of copper
occurrences in central Anatolia and especially those
in the vicinity of Ankara, it came to our attention that
de Jesus (1978) had identified six groups of sites of
extensive copper exploitation. One of these regional
groups, Yapraklı (no. 2), lies 110 km NE of Ankara in
the Çankırı Province, and trips were made to locate
possible sources of copper in the area. As a guide to
possible sites, additional detail was obtained from de
Jesus’ dissertation (1980) that focused on a series of
18 slag sites (de Jesus 1980, p. 240–246); a picture of
one of these, Damlu Yurt Başı, can be found in de
Jesus (1973, p. 72).
Upon examining a few of the listed sites, it quickly
became evident that all of the sites included in the
Yapraklı area were in fact iron slags which, when
broken with a rock hammer, showed prills of iron
rather than copper. The lack of any copper in these
slags is also clear from the slag analyses provided by
de Jesus (1980, p. 240–246). As found later, in the
survey by Seeliger et al. (1985, p. 601), these slags
were definitely identified as iron slags, and those
authors thought that the slags were quite recent in
age. While the immediate Yapraklı area does not
have copper (other than insignificant showings
near Urvay, Yapraklıdağ-Panayır, Tuhtköy, and Kiriş
(Gerişköy); e.g., Coulant 1907; Maucher 1937; Ryan
1957; MTA 1972), copper ore is present elsewhere
in the Çankırı Province, including in the mountains
between Şabanözü and Eldivan (de Jesus 1980, p.
238–239; MTA 1972, p. 65) and at Hisarcıkkayı (de
Jesus 1980, p. 240).
321
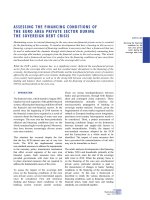
IRON SLAGS OF THE YAPRAKLI AREA (ÇANKIRI), TURKEY
In so far as these iron slags consist of small isolated
occurrences over a confined but fairly widespread
area around Yapraklı, it seemed appropriate to take
a closer look at the nature of these slags. However,
it should be noted here that the source(s) of the iron
ore remains uncertain. Hematitic iron formation
(radiolarite?) was observed at one location near
Damlu Yurt Başı (Table 1), and Upper Cretaceous
radiolarites – some ophiolite-related (e.g., those in
the vicinity of Eldivandağı; Figure 1) – have also
been mapped in some detail – for example, those
described in the Hisarköy Formation along strike to
the SW near Çandır (Akyürek et al. 1988). There is
only passing mention of iron ore in the geological
literature pertaining to the Çankırı Province (e.g.,
Nowak 1927; Maucher 1937; Ryan 1957, p. 89;
Budanur 1977, p. 115), and most of the iron prospects
that have been mentioned are in Çerkeş County in
the western part of the province (Figure 1) and, thus,
are not germane to the present study.
Geological Setting
Although the town of Yapraklı itself is underlain by
Oligocene–Lower Miocene evaporitic sediments and
undifferentiated Pliocene clastic materials, the area to
the N and NE – in which the studied slag occurrences
are located – is underlain mainly by Mesozoic basic
and ultrabasic ophiolitic rocks, Upper Cretaceous
pillow lavas and associated sediments, along with
patches of Upper Cretaceous clastic and carbonate
rocks (Uğuz et al. 2002).
Location and Age
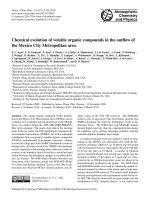
The studied slag sites (Figure 1 and Table 1) are
spread over an area of about 100 km2 in the Köroğlu
Range north and east of Yapraklı at elevations
typically above 1500 m. As illustrated by the site at
Sünnük Bolukdağı Dömeke (99-04), all are found
in upland meadows and forest quite far even from
small streams (Figure 2a). As indicated by de Jesus
(1980, p. 240; see also Seeliger et al. 1985, p. 601) and
consistent with our own observations, the amount
of slag ranges from several kg to a few thousand
tonnes (Figure 2b). The individual pieces of slag are
generally scoriaceous (Figure 2c) and are typically
8–10 cm in diameter. While some pieces were glassy
322
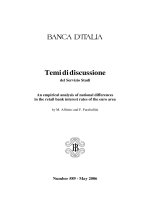
with vesicles (Figure 3a, b) and some were dense and
compact (Figure 3c), none showed any flow features
such as layering or ropey surfaces. Moreover, none of
the slag pieces showed any signs of green colouration
or white coatings which might be derived from the
oxidation of copper or lead, respectively. All of the
slag heaps are notable for the lack of any materials
other than slag (Figure 2b), not even pieces of ore –
although Seeliger et al. (1985) reported the presence
of hematitic ore at their site TG 160A – or even
ceramic fragments, including those that could have
come from tuyeres.
When the slag was broken open with a rock
hammer, small pieces of charcoal were often observed
(Figure 3d). Similarly, when broken open with a rock
hammer, small pieces of iron were widely observed
and, in some cases when sawed open with a rock saw,
whole pieces of iron were occasionally found (Figure
2d). In so far as neither de Jesus (1980) nor Seeliger
et al. (1985) reported a specific age for these slags,
charcoal from selected slag fragments from a few of
the sites were submitted for AMS radiocarbon dating.
As will be discussed below, the age turned out to be
late-medieval rather than the anticipated recent age
suggested by Seeliger et al. (1985).
Slag Mineralogy
A number of the slag samples were sectioned with
a diamond saw and, because the slags are generally
opaque at standard thin-section thickness, thick
polished sections were prepared. To capture a full
range of variation in the slags, 13 sections were
prepared from six sites. The sections were carboncoated and then viewed as back-scattered electron
(BSE) images on an electron microprobe (Cameca
SX-50). Various phases in the slag specimens were
selected for analysis using grey-scale contrast and
also grain shape. Examples include: very bright round
grains; small square bright grains; elongate platy dark
grains; blocky dark-grey grains; anhedral mediumgrey grains; elongate platy medium-grey grains; large
rounded dark grains; large rounded light-grey grains
and a light-grey matrix locally with very fine laths.
Quantitative analyses of the various slag phases
were performed on an electron microprobe (Cameca
SX-50) equipped with four wavelength dispersive
W.E. SHARP & S.K. MITTWEDE
KARABĩK
Gerede
Tosya
Ilgaz
Eskipazar
ầerkeỵ
Kurỵunlu
ầANKIRI
ầamlýdere
ịabanửzỹ
Kýzýlcahamam
0
20
km
Eldivan
N
Kýzýlýrmak
ầubuk
Ahlatkửy
Idir
YAPRAKLI
Dereỗatý
íkiỗam
Alapýnar
Paỵakửy
Yakadere
Deim
Karacaửzỹ
Buday
Dutaaỗ
Ayan
Hasakỗa
benitoite for Ba-L, chromite for Cr-K, diopside for
Ca-K, microcline for K-K, apatite for P-K, olivine
for Si-K, garnet for Al-K, olivine for Mg-K, and
albite for Na-K. Dwell times were 30 seconds for
major elements, 50 seconds for minor elements and
15 seconds for background. Observed intensities
were adjusted for ZAF using the PAP correction
program (Pouchou & Pichoir 1991) supplied with the
microprobe.
The slags, in roughly hand-sized pieces, either
have the texture of a ceramic with abundant vesicles,
or are vesicular glass. The ceramic-like slags consist of
plagioclase with varying amounts of titanaugite and
minor amounts of ulvửspinel, all in a matrix of glass
or fayalite and glass. The distinct crystal outlines of
the plagioclase and ulvửspinel suggest they were the
first phases to appear and were followed by titanaugite
and, subsequently, fayalite with glass or simply glass.
Detailed descriptions of the recognized phases are
given below.
íỗyenice
Bayýndýr
Hýdýrlýk
ầANKIRI
ầaypýnar
Figure 1. Location map of Yaprakl.
counters. The acceleration voltage was 15kV with
a beam current of 10 nA, with a slightly defocused
beam of 5 m. Standards used were fayalite for FeK, synthetic MnO2 for Mn-K, ilmenite for Ti-K,
Iron
Metallic iron occurs in four different forms within
the slag: as large round grains (Figure 4a), in some
cases with distinct cracks (Figure 4b); as beads and
ovoid masses (Figure 4c); and as skeletal crystals
(Figure 4d) or as ovoid skeletal patches consisting of
numerous globulites, with as much as 50% included
glass (Figure 7b). The cracks observed (Figure 4b) in
one of the round prills are suggestive of precipitated
Table 1. Iron slag locations of the Yaprakl area.
Site
Site Name
Latitude
Longitude
9901
9706
9902
9707
9903
9904
9905
9906
Kumlu ầukur Mevkii (Yakadere Kửyỹ)....................................................................
Panayr Tepesi .............................................................................................................
ầayrldere (Akyolun tepesi).................................................................................. ....
Dipyurt .........................................................................................................................
Dedekửy ......................................................................................................................
Sỹnnỹk Bolukda Dửmeke (Deresi ỹstỹ) ...............................................................
Kapaklk Mevkii (Yukarửz) ................................................................................. ......
Damlu Yurt Ba .........................................................................................................
nearby BIF(radiolarite?) ..................................................................................... ........
Karatepe ................................................................................................. .......................
(Karatepedeki demir boku mevkii) nearby Tekmen tarlas ...............................
Mustafa ĩnỹr tarlas ........................................................................................ ...........
Gửkỗukur Deresi .......................................................................................... ...............
Asarck Yaylas (ầapann kửprỹsỹ) ...........................................................................
Kayaylas (lower)........................................................................................................
Kayaylas (upper) ........................................................................................... ............
N40 43 26
N40 47 28
N40 47 28
N40 48 47
N40 48 32
N40 49 51
N40 49 49
N40 50 22
N40 50 34
N40 50 47
N40 50 42
N40 50 30
N40 50 39
N40 50 45
N40 50 21
N40 50 21
E33 43 58
E33 46 58
E33 45 15
E33 44 01
E33 43 54
E33 45 15
E33 48 09
E33 48 11
E33 48 17
E33 48 40
E33 48 34
E33 49 50
E33 49 22
E33 49 34
E33 50 11
E33 49 56
9907
9908
9909
9910
9911
9912
323
IRON SLAGS OF THE YAPRAKLI AREA (ÇANKIRI), TURKEY
Figure 2. Slag site of Sünnük Bolukdağı Dömeke (99-04). (a) View of site relative to the upland meadows, with SKM and two local
guides. (b) Typical view of slag exposure. (c) Typical example of scoriaceous slag. (d) Sawed piece of scoriaceous slag showing
embedded piece of metallic iron. Coin diameter is 2.50 cm.
graphite. However, checking the crack with the
electron beam showed only the presence of epoxy;
if there had been graphite where the crack appears,
it was lost or removed during the preparation of the
probe section. Tests were also made to see if there was
detectable carbon in any of the iron. This was done
using the microprobe by spectrometer scans with
crystal PC1. No carbon, beyond that expected from
the carbon coating, was observed. Compositions
measured with the microprobe averaged 99.46% iron
(Table 2) when calibrated using a fayalite standard. A
few grains (Table B1: 14, 50, 53, 55) have elevated Si
contents of 1.29%, and a few grains (Table B1: 75, 76)
have elevated P contents of 1.27%.
Plagioclase
Plagioclase occurs as elongate platy dark grains and is
consistently observed as distinct crystals, suggesting
324
that it is one of the earliest phases to crystallize in the
slag. It occurs as elongate laths in glass (Figure 5a),
as elongate laths in devitrified glass (Figure 5b), with
equigranular subophitic texture comprising distinct
laths in a matrix of titanaugite and fayalite (Figure
5c), as equigranular grains in a matrix of titanaugite
and fayalite (Figure 5d), and as micro-ophitic zones
with titanaugite and laths of fayalite (Figure 6a).
Leucite
Leucite is present in a limited part of one section
as equigranular grains embedded in a matrix of
titanaugite and fayalite (Figure 6b), and is discussed
here because of its textural resemblance to some
of the plagioclase. In Figure 5d, leucite grains are
embedded in a similar matrix but are medium grey
instead of the dark grey of the plagioclase.
W.E. SHARP & S.K. MITTWEDE
Figure 3. Other examples of slag pieces. (a) Vesicular glassy slag from Dipyurt (97-07). (b) Glassy slag with large vesicles from
Damlu Yurt Başı (99-06). (c) Dense compact slag from Kumlu Çukur Mevkii (99-01). (d) Charcoal embedded in
scoriaceous slag from Sünnük Bolukdağı Dömeke (99-04). Coin diameter is 2.50 cm.
Titanaugite
Titanaugite occurs with a subophitic texture as
anhedral, medium-grey grains between laths of
plagioclase and bounded by fayalite (Figure 5c), as
anhedral grains between large grains of plagioclase,
as anhedral grains among large grains of leucite
(Figure 6d), and as micro-ophitic slag (Figure 6a).
Ulvöspinel
Ulvöspinel appears in most of the probe sections
as small bright grains with blocky outlines (Figures
4c, 5a, b & 6c), and as very small crystalline grains
embedded in glass between crystals of fayalite
(Figure 6d). It is thought to be an early phase because
it is euhedral in almost all cases. Because of its small
grain size, it was quite difficult to find ulvöspinel
grains large enough to analyse. When analysed, the
observed ulvöspinel is lower in titanium than the
ideal, but this has been taken up by chromium (Table
2); thus it might properly be termed a Cr-ulvöspinel.
Further, the totals tend to be on the low side. Because
the analyses of chromites have reasonable totals, it
is suspected that the low totals are the result of the
ulvöspinel capturing any ferric iron present in the
slag.
Fayalite
Fayalite occurs as feathery elongate laths typically
embedded in glass (Figures 4c & 6c, d), and as
marginal grains adjacent to plagioclase (Figures 3a &
5c) or leucite (Figure 6b). Fayalite, along with glass,
is the dominant phase in the groundmass of the slag.
325
IRON SLAGS OF THE YAPRAKLI AREA (ÇANKIRI), TURKEY
Figure 4. (a) A backscatter image from scene 2 of probe section 99-10B showing a prill of metallic iron (Fe) embedded in
glass (gls). (b) A backscatter image from scene 2 of probe section 99-06C showing an iron prill (Fe) with prominent
cracks embedded in glass matrix (gls). (c) A backscatter image from scene 4 of probe section 99-04C showing ovoid
iron prills and beads (Fe) in a matrix of fayalite laths (fa) and glass (gls), with scattered grains of ulvöspinel (usp).
(d) A backscatter image from scene 7 of probe section 99-03A showing a skeletal crystal of iron (Fe) along with
skeletal patches of iron composed of numerous globulites; these are embedded in a matrix of glass (gls) with laths
of plagioclase (pg).
Table 2. Composition of the iron phase.
Average (no.)
Iron (31)
326
wt.
Si
Ti
Al
Fe
Mn
Mg
Ca
Na
K
P
Ba
Cr
Total
Source
%
0.20
0.11
0.02
99.46
0.08
0.02
0.06
0.02
0.04
0.22
0.13
0.25
100.60
B1
W.E. SHARP & S.K. MITTWEDE
Figure 5. (a) A backscatter image from scene 5 of probe section 99-08A showing laths of plagioclase (pg) in a matrix of
glass (gls). Also in the scene are small blocky crystals of ulvöspinel (usp), residual grains of quartz (qtz) and
holes. (b) A backscatter image from scene 2 of probe section 99-10A showing numerous laths of plagioclase
(pg) in a devitrified matrix of glass (gls) with scattered small crystals of ulvöspinel (usp). (c) A backscatter
image from scene 1 of probe section 99-06B showing plagioclase (pg) as part of a subophitic texture with
titanaugite (aug) and fayalite (fa). Note the presence of a residual quartz grain at the centre of the scene. (d) A
backscatter image from scene 4 of probe section 99-06B showing anhedral grains of plagioclase (pg) as part of
an ophitic texture with titanaugite (aug) and fayalite (fa).
Hematite
Hematite in the few images in which it was observed
is present as anhedral or ovoid grains (Figure 7a). At
the centre of Figure 6d, metallic iron (Fe) surrounds
a small hole which in turn is surrounded by a grain
of hematite (hm). In the BSE images, the hematite
is similar in brightness to fayalite but the grains are
much larger and more irregular. Analyses of the
hematite (Table 3) average 90%, notably less than the
93% expected for magnetite or the 100% expected for
wüstite.
327
IRON SLAGS OF THE YAPRAKLI AREA (ÇANKIRI), TURKEY
Figure 6. (a) A backscatter image from scene 4 of probe section 99-06B showing laths of plagioclase (pg) as micro-ophitic
zones with titanaugite (aug) and laths of fayalite (fa). (b) A backscatter image from scene 5 of probe section 9707A showing anhedral grains of leucite (lc) embedded in a matrix of titanaugite (aug) and fayalite (fa). Note the
resemblance of the leucite here to the plagioclase in Figure 5d. (c) A backscatter image from scene 3 of probe section
99-04C showing fayalite (fa) embedded in a matrix of glass (gls). Note the much brighter and scattered blocky
crystals of ulvöspinel (usp). (d) A backscatter image from scene 4 of probe section 99-08A showing laths and blocky
crystals of fayalite (fa) embedded in a matrix of glass (gls). Ulvöspinel (usp) is present as bright, very fine-grained,
blocky crystals in the glass.
Chromite
Chromite occurs as round grains in almost every
section examined (e.g., Figure 7b). The consistent
appearance of chromite, its rounded shape, and its
328
resistance to dissolution in the slag suggest that the
observed grains are residual grains mixed either in
the hematitic ore or as part of silica sands that were
presumably added as fluxes.
W.E. SHARP & S.K. MITTWEDE
Figure 7. (a) A backscatter image from scene 2 of probe section 97-07A showing anhedral and ovoid grains of hematite (hm)
embedded in a matrix of plagioclase (pg) and titanaugite (aug). Note the presence of metallic iron (Fe) and residual
grains of quartz (qtz). (b) A backscatter image from scene 6 of probe section 99-03A showing residual grains of
chromite (chr) and quartz (qtz) along with ovoid skeletal patches of metallic iron (Fe). These are all embedded in
glass (gls) which, on a microscale, has exsolved fayalite (not visible).
Table 3. Compositions of mineral phases.
Average
(no.)
wt
SiO2
TiO2
Al2O3
FeO
MnO
MgO
CaO
Na2O
K2O
P2O5
BaO
Cr2O3
Total
Source
Plag.
An70
(22)
%
%
49.78
50.54
0.19
.0
28.82
31.70
1.49
.0
0.02
.0
0.33
.0
14.39
14.36
2.11
3.40
1.17
.0
0.03
.0
0.05
.0
0.02
.0
98.39
100.00
B2
(4)
%
%
55.01
55.06
0.09
.0
21.94
23.36
0.03
.0
0.00
.0
0.00
.0
0.00
.0
0.64
.0
19.12
21.58
0.01
.0
0.00
.0
0.00
.0
96.84
100.00
B3
(16)
%
%
%
43.54
47.11
40.28
3.59
3.75
3.85
8.41
3.00
10.30
15.77
15.56
12.73
0.31
.0
.0
6.80
16.85
7.78
18.52
13.54
23.57
0.30
0.22
0.36
0.55
0.02
.0
0.26
.0
.0
0.07
.0
.0
0.16
.0
.0
98.28
99.96
99.06
B4
%
%
%
0.20
0.00
0.33
25.89
35.73
26.76
4.83
0.00
2.31
58.57
64.27
64.29
0.48
0.00
0.61
1.22
0.00
1.93
0.25
0.00
0.59
0.02
0.00
.0
0.08
0.00
.0
0.04
0.00
.0
0.19
0.00
.0
3.93
0.00
0.38
95.68
100.00
97.48
B5
%
%
%
%
32.34
32.95
30.51
30.62
0.24
.0
0.36
.0
0.15
.0
0.58
.0
51.12
52.01
61.44
64.44
0.75
.0
0.90
.0
14.62
15.03
4.59
4.93
0.84
.0
0.98
.0
0.02
.0
0.06
.0
0.07
.0
0.13
.0
0.07
.0
0.23
.0
0.08
.0
0.07
.0
0.06
.0
0.04
.0
100.37
99.99
99.91
99.99
B6
%
%
0.24
.0
0.43
.0
0.10
.0
88.52
89.98
0.12
.0
0.04
.0
0.10
.0
0.04
.0
0.05
.0
0.14
.0
0.12
.0
0.14
.0
90.03
89.98
B7
%
%
0.04
.0
0.18
0.69
19.01
13.36
49.36
52.77
20.49
21.78
0.19
0.20
10.38
10.31
0.04
0.28
0.02
.0
0.02
.0
0.02
.0
0.08
.0
99.84
99.39
B8
%
%
98.20
100.00
0.02
.0
0.35
.0
0.28
.0
0.01
.0
0.03
.0
0.10
.0
0.04
.0
0.17
.0
0.03
.0
0.03
.0
0.01
.0
99.27
100.00
B9
Leucite
Ideal
Ti-augite
Natural
Natural
Ulvöspinel(9)
Ideal
Natural
Fayalite
Fa66
Fayalite
Fa88
(6)
Hematite
Ideal
(7)
(7)
Chromite(28)
Natural
Quartz
Ideal
(32)
329
IRON SLAGS OF THE YAPRAKLI AREA (ÇANKIRI), TURKEY
glasses (Table 4) can be subdivided into high iron,
low iron, high lime and high potash. It should be
noted that, while the slags are high in lime and silica,
wollastonite is scarce as an actual phase and neither
tridymite nor cristobalite was observed as a separate
phase. Some of the glasses are quite rich in K2O and
may be considered leucite-normative (Table B13).
However, some of the glasses were not wollastonitenormative; these low-lime glasses had extra alumina
which made them hercynite-normative, and a few
were even mullite-normative.
Zircon
Zircon was observed as a single isolated grain. When
observed in the BSE image, it is rounded like the
chromite but is brighter and fluoresces when in the
electron beam. It is probably a residual grain which
accompanied any silica added as a flux.
Quartz
Quartz, like the chromite, was observed as residual
undigested grains in a number of sections (Figures
5a, c & 7a, b). Consequently, the slags are relatively
silica-rich. As checked by X-ray diffractometry, none
of the residual quartz grains has been converted
to either cristobalite or to tridymite. The x-ray
diffraction work was carried out on a computercontrolled diffractometer (Scintag), and samples
were scanned over a range of 4 to 65 degrees 2-theta
using copper radiation. Quartz was easily detected
but there was no indication of any lines for tridymite
or cristobalite.
Discussion
Age
The iron slags are well exposed with few signs of burial
which could suggest that the slags are relatively recent
in age (Seeliger et al. 1985, p. 601). However, charcoal
embedded in slag fragments (Figure 3d) from four
of the slag sites was submitted for AMS radiocarbon
dating, and the results of these analyses revealed that
they are late-medieval in age. Ages ranged from 486
yrs BP to 571 yrs BP, with an average age of 533 yrs
BP and a standard error of 24 yrs BP (Table 5). A
graph of C-14 age (Stuiver & Reimer 1993; Reimer et
al. 2004) versus calibrated calendar age (Figure A1)
gives an expected primary calendar age of 1412 AD
and a secondary calendar age of 1336 AD.
Glass
Glass ranges from composing almost the entire bulk
of an individual piece of slag (Figures 1b & 4a) down
to very small amounts of residual interstitial glass
(Figure 6c) occurring as a matrix among the much
larger complex of mineral grains. Overall, the glass
is rich in both silica and lime (Table 4), and may
be distinguished compositionally from all other
phases by the presence of at least one percent potash;
the potash content can range up to a maximum of
seven percent (Table B13). Magnesia and titania are
also important components of the glass. A careful
examination of the glass compositions shows that
they can be divided into six groups on the basis of
their compositions. Overall the glasses are normative
in anorthite-fayalite-wollastonite – quartz, and these
Considering the number of slag heaps and their
rather narrow age range, this would suggest some
event, such as a military campaign, might have
precipitated a sudden push for the local production
of iron.
If one accepts the primary age of 1412 AD, this
roughly corresponds to the time when the Ottoman
sultan, Mehmed, led an expedition to Anatolia in
1417 against the emir of Sinop, which ultimately
placed Mehmed in control of Kastamonu and its
copper mines (Imber 2002, p. 21). Kastamonu lies
just 80 km directly north of Yapraklı.
Table 4. Composition of glasses.
Average
wt
SiO2
TiO2
Al2O3
FeO
MnO
MgO
CaO
Na2O
K2O
P2O5
BaO
Cr2O3
Total
Source
High–iron
(42)
%
46.45
3.34
11.83
20.88
0.39
2.01
10.60
0.78
2.23
0.26
0.08
0.07
98.90
B10
Low–iron
(25)
%
51.52
4.70
14.55
8.41
0.54
3.18
11.55
0.95
2.63
0.11
0.13
0.25
98.51
B11
High–lime
(16)
%
51.01
4.72
12.94
7.31
0.62
2.68
15.92
0.88
2.16
0.16
0.09
0.21
98.69
B12
(8)
%
58.46
4.90
12.91
6.01
0.37
0.88
6.33
1.13
5.98
0.28
0.09
0.07
97.39
B13
Potash
Low–lime
(6)
%
49.30
2.97
13.26
24.96
0.61
0.64
4.17
0.74
1.73
0.35
0.04
0.02
98.79
B14
Alumina
(4)
%
59.54
0.46
23.40
2.15
0.03
0.63
4.70
2.06
5.07
0.06
0.02
0.04
98.14
B15
330
W.E. SHARP & S.K. MITTWEDE
Table 5. 14C ages of selected Yapraklı slags.
Site
Sample
D13C(mils)
Fraction Modern
14
C
age BP
ca Cal age
97–07
99–04
99–05
99–10
GX23363
AA65875
AA65876
AA65878
–24.7
–26.8
–22.6
–23.9
0.9387±0.0060
0.9413±0.0062
0.9319±0.0046
0.9314±0.0052
510±60
486±53
567±40
571±45
AD
AD
AD
AD
1334/1420±27
1427/– ±28
1336/1402±13
1335/1401±13
–
Average
–24.5
–
533±24
AD
1414±14
If one accepts the secondary age of 1336 AD,
then this corresponds to an obscure time in history
when the Turks immigrated into Anatolia and the
region was divided into a series of local principalities
between the end of the Seljuk realms and the rise of
the Ottomans (Imber 2002, p. 7–9). However, if the
age represents the average age of the wood, then the
production of iron could correspond to a somewhat
later period, such as around 1461 when Mehmed sent
a fleet along the Black Sea coast (as well as an army
overland) to capture Sinop and Trabzon (Imber 2002,
p. 31).
Composition
The slags of the Yapraklı area are all relatively similar
in composition and texture. While they range from
nearly complete glass through to scoriaceous ceramic,
they are in the form of lumps with no indication of
smooth ropey surfaces or interior banding that would
suggest the presence of any liquid flow. Although
originally described as copper slags by de Jesus,
they are definitely iron slags. Compositionally the
slags are high in silica and lime along with alumina,
moderate in titania and are low in manganese. Where
found embedded in the slag, metallic iron takes the
form of lumps, rounded prills or skeletal patches. The
rounded prills would appear to be simply solidified
liquid iron. One of these prills had an observed
silicon content of 1.29% (Table B1). Such silicon
contents are known to occur in cast irons from the
reduction of silica to Si under strongly reducing
conditions (Partington 1939, p. 960). The observed
P in one prill is suggestive that the iron phase may
have absorbed some reduced P; it is suspected this
is probably analytical error in so far as there is no
indication of any P-bearing phases (such as apatite),
nor is there notable P in any of the glass in the slag.
Any dissolved carbon that might be in the iron was
not detectable with the microprobe.
Pure iron melts at a temperature of 1534 °C
(Hansen 1958, p. 354), well beyond the temperatures
expected with these slags. However, the presence of
carbon can reduce the solidus to 1153 °C and, while
that places the molten iron in the range of the slag,
there is no indication of detectable dissolved carbon,
exsolved graphite or iron carbide leaving unresolved
how these oblate grains – which resemble droplets
of liquid – could be found within the expected
temperature range of these slags. However, the
skeletal patches of iron do appear to be the result
of solid-state reduction, and this places them well
within the formation temperatures of the slag.
Distinct crystal outlines, along with individual
grains completely surrounded by glass, suggest that
plagioclase and ulvöspinel were the first phases to
crystallize from the molten slag. The presence of
crystalline plagioclase together with the composition
of the glasses (discussed below) suggest that the slag
compositions will fall near the ternary phase diagram
CaAl2Si2O8-SiO2-FeO in the four component phase
diagram of CaO-FeO-Al2O3-SiO2. The ulvöspinel
grains are quite small and thus it was difficult to
obtain microprobe analyses, which are unaffected by
the size of the electron beam; this accounts in part
for the low totals observed. If one eliminates likely
contaminants (such as silica and barium) from the
surrounding glass, an average resulting analysis
is given in Table 6. If one normalises this analysis
and partitions the various ions over the tetrahedral
and octahedral positions, and accepts the classic
substitution of 2 Fe3+ = Fe2+ + Ti4+ (Bosi et al. 2008, p.
331
IRON SLAGS OF THE YAPRAKLI AREA (ÇANKIRI), TURKEY
Table 6. Composition of ulvöspinel in the Yapraklı slags.
Average observed
TiO2
Al2O3
FeO(T)
MnO
MgO
Cr2O3
25.89
4.83
58.57
0.48
1.22
3.93
Total
94.92
Normalised
number of ions with 4O
Mg
Mn
Fe2+
0.0687
0.0154
0.9159
|
| 1.0
|
Fe2+
Fe3+
Al
0.7352
0.1976
0.0672
|
| 1.0
|
Ti
Al
Cr
0.7352
0.1476
0.1172
|
| 1.0
|
1315), then the ion distributions should be as shown
in the middle column of Table 6. This distribution of
ions suggests that the average observed ulvöspinel
has an Fe3+ of 0.198 and an Fe2+ of 1.651 and an Fe3+ /
Σ Fe = 0.11. The latter ratio (as well as the TiO2/FeOT
ratio) falls in the mid-range of synthetic ulvöspinels
grown under oxygen-fugacity conditions of 10-11 to
10-17 (Bosi et al. 2008, p. 1315). The ion stoichiometry
would suggest an average analysis for the ulvöspinel
as given in the last column of Table 6.
In a part of at least one section, leucite is a
prominent phase consisting of anhedral grains
embedded in titanaugite and fayalite. To have leucite
as a separate phase requires the presence of significant
amounts of potash. While the source of silica in the
slag could be sand with muscovite or potash feldspar,
no evidence of any residual grains of potash feldspar
was observed in any of the sections. A more likely
source of potash would be the charcoal used in the
smelting process.
Anhedral titanaugite appears as a distinct
phase surrounding either leucite or plagioclase.
With respect to the system CaO-FeO-Al2O3-SiO2,
the presence of this phase would correspond to
hedenbergite. However, hedenbergite is not usually
observed in that system if any liquid is present
(Schairer 1942, p. 265), but only as a subsolidus
phase. While in some titanaugite-bearing sections no
glass was seen, it is uncertain that this observation
can be extended to other sections. Furthermore, the
presence of magnesia and titania may have stabilised
this particular phase.
332
Corrected observed
TiO2
Al2O3
FeO
Fe2O3
MnO
MgO
Cr2O3
25.90
4.83
52.31
6.96
0.48
1.22
3.92
Total
95.62
In one section anhedral grains, from which
the results of microprobe analyses correspond to
hematite, were observed. As described above, a
progression from a hole to metallic iron to hematite
was observed; this is the only image that suggests the
presence of an ore grain. If this is correct, then the
ore was either hematite or dehydrated goethite. If the
ore was goethite, the low manganese in all phases
including fayalite would suggest it could not have
been a bog-iron, such as might be found in upland
mountain meadows.
Fayalite, as described above, occurs as grains
adjacent to leucite or plagioclase, and also occurs as
feathery grains with glass in the groundmass of the
slag. At very high magnifications, fayalite is readily
observed as crystals with included glass. From this it is
interpreted that the fayalite may be an exsolved phase
from the quenched glass. Two different compositions
of fayalite were found: Fa66 and Fa88.
Four minerals are thought to be residual, resistate
grains; these include hematite, quartz, zircon and
chromite. One section containing a few grains of
hematite was described above. A single grain of zircon
was noted, and this was discovered by its fluorescence
in the electron beam of the microprobe. In contrast
to these scarce grains, quartz and chromite occur
in several of the sections. The quartz is thought to
be residual grains from any sand or sandstone that
may have been used in the slagging process. They are
rounded and show no evidence of conversion to either
tridymite or cristobalite. This was confirmed by x-ray
diffraction of silica-rich sections, in which no peaks of
W.E. SHARP & S.K. MITTWEDE
either mineral were observed. The observed chromite
grains were rounded and showed no signs of digestion
by the slag. Chromite grains were relatively easy to
find and were relatively abundant. It is thought that
these grains, too, were part of any sand or sandstone
that was used in the slagging process. Much of the
area immediately north of Yapraklı is underlain by
ophiolitic rocks, and chromite derived from these
rocks would logically have been part of the sands of
this area. We even wonder if these early miners might
have tried to obtain iron from chromite.
Glass is ubiquitous, but ranges from making
up nearly all to virtually none of a particular slag
fragment. Microprobe analyses of the glasses show
that 90% of the glasses were normative in anorthitefayalite-quartz and wollastonite; that is, most of the
iron slags analysed were high in silica and lime,
moderate in titania and low in manganese. Unlike
other medieval or Roman slags which have been
described, none of the studied slag samples are
normative in wüstite. Normative compositions were
computed using observed minerals in the slag along
with those expected within the observed portion
of the CaO-FeO-Al2O3-SiO2 phase diagram; that is,
anorthite, fayalite, quartz and wollastonite. Additional
phases, including hercynite, mullite and leucite, were
calculated for those glasses for which they were
required. For a majority of the slags, the compositions
lie near the plane of the ternary phase diagram
of CaAl2Si2O8-SiO2-FeO in the four component
tetrahedron of CaO-FeO-Al2O3-SiO2. For a smaller
subset, the compositions would lie more toward the
CaO apex. If one takes and renormalises the average
high-iron glass composition (Table 4) to obtain An=
38.27, FeO= 23.28 and SiO2= 38.45, this composition
falls adjacent to the anorthite-tridymite cotectic at
about 1200 °C. Similarly, if the average low-iron glass
composition (Table 4) is renormalised to An= 48.13,
FeO= 10.21, and SiO2= 41.67, this composition also
falls adjacent to the anorthite-tridymite cotectic at
around 1300 °C (Figure 8). However, this calculation
neglects any effect of normative wollastonite, which
could lower the melting temperature by as much as
100 °C. Interestingly, no evidence of residual mineral
grains was detected that might account for any of the
titania, alumina, magnesia or lime. Because of the
high lime content, it is suspected that limestone in
some form was added along with sand or sandstone
to form the smelting flux.
CaAl2Si2O8
1552
1370
an
1368
1470
a
hc
b
1070
1108
trd
crs
1690
two liquids
1120
fa
1690
1470
1178
1290
1177
wus
1713
SiO2
FeO
Figure 8. Ternary equilibrium diagram of the system
CaAl2Si2O8-FeO-SiO2 (Schairer 1942) showing the
phase relations among anorthite (an), tridymite (trd),
cristobalite (crs), fayalite (fa), wüstite (wus), and
hercynite (hc). For our samples: a– low-iron glasses;
b– high-iron glasses. The black dots represent the
centres of the respective sample groups, and the grey
circles represent one standard deviation from each of
those centres.
From the view of iron smelting at other medieval
or Roman sites, these slags are anomalous in being
wüstite-free. The mineralogy and the composition
of the glasses indicate the slags were along the
tridymite-anorthite cotectic. If one reviews the
reports on slags from Roman and medieval Britain
(Morton & Wingrove 1969, 1972), those slags carry
wüstite-fayalite or wüstite-fayalite-hercynite with
FeO contents of 50–80% instead of the average 8%
and 20% observed here. In a review of optimum ironslagging conditions (Rehren et al. 2007), two optima
were found: one with fayalite-hercynite-tridymite at
1058 °C, and a second with wüstite-hercynite-fayalite
at 1148 °C. In contrast, modern blast-furnace slags
with melting temperatures of around 1350 °C are
both modal and normative in melilite but carry less
than 2% FeO (Josephson et al. 1949, p. 55, 65; Lee
1974, p. 26).
The nature of the smelting conditions at these sites
should warrant further study. The slag heaps have no
sign of any ceramic – not even that which might have
333
IRON SLAGS OF THE YAPRAKLI AREA (ÇANKIRI), TURKEY
been derived from tuyeres. Unlike other slags of this
age, they are wüstite-free because of the very high
lime content. All of the sites are in upland meadows
or forest far from any streams, all of which suggest
that the furnaces probably used a natural draft. The
true nature of the ore is also unclear. Certainly,
there were no obvious signs of ore found with or
around any of the slag heaps. Although hematite
was reported at one site (TG 160A) by Seeliger et
al. (1985), and grains of hematite were observed in
one probe section, and some banded iron formation
with hematite was observed near site 99-06, it is not
at all certain that hematite was indeed the ore. It is
commonly thought (Wertime 1980) that black sands
were a likely ore in this region. Such black sands
would be expected to have significant ilmenite or
rutile. While the slags have moderate titania, no signs
of any residual grains of magnetite, ilmenite or rutile
were found in any of the slag sections. The flux for
slagging was certainly local sandstone or river sands
rich in quartz as evidenced by residual quartz and
chromite grains as well as a single grain of zircon.
The sand or sandstone must have been mixed with
limestone. Both the sands and limestone are adequate
to account for most of the other minor oxides found
in the slag, including magnesia, alumina and titania.
The presence of potash and soda in the slag is
probably from ash resulting from the combustion of
any charcoal fuel used in the smelting.
Conclusions
The slags from Yapraklı were found to be iron slags
rather than copper slags as originally reported by
de Jesus. The absence of any sediment covering the
slags might have suggested they are relatively recent
slags, but 14C age dating of charcoal embedded in the
slags suggests they are late-medieval. The iron slags
are enriched in lime and silica such that plagioclase
is a primary phase, and the presence of hematite
in one section suggests that it might have been the
ore mineral used. The presence of resistate grains
of chromite and quartz suggest that local sand or
sandstone was part of the flux, while the high lime
content suggests that limestone was added as well.
The absence of any modal or normative wüstite
makes these slags unusual compared to other
medieval and Roman iron-smelting sites.
Acknowledgements
We would like to thank the Department of Geological
Sciences for providing time on the Cameca (SX50) microprobe in the Electron Microscope Center
of the University of South Carolina. Mark Wieland
assisted with obtaining the backscatter images, with
the calibration, and with the analyses of the various
minerals and glass, while Donggao Zhou helped to
maintain the equipment. The samples for 14C dating
were analysed as follows: AA samples – NSF Arizona
AMS Facility, University of Arizona (Tucson); the
GX sample – Geochron Laboratories (Cambridge,
Massachusetts).
References
Akyürek, B., Akbaş, B. & Dağer, Z. 1988. 1:100,000 Scale Geological
Map of Turkey Series, Çankırı – E16 Sheet. General Directorate
of Mineral Research and Exploration (MTA) Publications,
Ankara.
Coulant, Ettore 1907. Note sur deux permis de recherches pour
cuivre appurtenant à S.E. Fuat Bey et Dicran Balıkçian dans
le vilâyet de Kastamonu. Mineral Research and Exploration
Institute of Turkey, Ankara, Report no. 323.
Bosi, F., Haalenius, U. & Skogby, H. 2008. Stoichiometry of
synthetic ulvöspinel single crystals. American Mineralogist 93,
1312–1316.
De Jesus, P.S. 1973. A la recherche du metallurgiste ancien.
Archeologia (Paris) 68, 70–72.
Budanur, G. 1977. MTA Enstitüsünce Bilinen Türkiye Yeraltı
Kaynakları Envanteri (Inventory of Turkish Subsurface
Resources Known to the MTA Institute). Mineral Research and
Exploration Institute of Turkey, Publication no. 168, Ankara
[in Turkish, unpublished].
334
De Jesus, P.S. 1978. Metal resources of ancient Anatolia. Anatolian
Studies 28, 97–102.
De Jesus, P.S. 1980. The Development of Prehistoric Mining and
Metallurgy in Anatolia. British Archaeological Reports,
International Series 74.
W.E. SHARP & S.K. MITTWEDE
Deer, W.A., Howie, R.A. & Zussman, J. 1962b. Rock-forming
Minerals, v. 2, Chain Silicates. John Wiley, New York.
Partington, J.R. 1939. A Test-Book of Inorganic Chemistry (5th ed).
Macmillan, London.
Deer, W.A., Howie, R.A. & Zussman, J. 1962e. Rock-forming
Minerals, v. 5, Non-Silicates. John Wiley, New York.
Pouchou, J.-L. & Pichoir, F. 1991. Quantitative analysis of
homogeneous or stratified microvolumes applying the model
‘PAP’. In: Heinrich, K.F.J. & Newbury, D.E. (eds), Electron
Probe Quantitation. Plenum, New York, 31–75.
Hansen, M. 1958. Constitution of Binary Alloys (2nd ed). McGrawHill, New York.
Imber, C. 2002. The Ottoman Empire, 1300–1650. Palgrave
Macmillan, New York.
Josephson, G.W., Sillers Jr., F. & Runner, D.G. 1949. Iron BlastFurnace Slag. United States Bureau of Mines, Bulletin 479,
Washington, D.C.
Rehren, T., Charlton, M., Chirikure, S., Humphris, J., Ige,
A. & Veldhuijzen, H.A. 2007. Decisions set in slag: the
human factor in African iron smelting. In: La Niece, S.,
Hook, D. & Craddock, P (eds), Metals and Mines: Studies in
Archaeometallurgy. Archetype, London, 211–218.
Lee, A.R. 1974. Blastfurnace and Steel Slag. Edward Arnold, London.
Ryan, C.W. 1957. A Guide to the Known Minerals of Turkey. Mineral
Research and Exploration Institute of Turkey, Ankara.
Maucher, 1937. Çankırı ve Tosya Tetkikine Ait Raporlar (Reports
of the Çankırı and Tosya Investigation). Mineral Research and
Exploration Institute of Turkey, Ankara Report no. 340 [in
Turkish, unpublished].
Schairer, J.F. 1942. The system CaO-FeO-Al2O3-SiO2: I., Results of
quenching experiments on five joins. Journal of the American
Ceramic Society 25, 241–274.
Morton, G.R. & Wingrove, J. 1969. Constitution of bloomery
slags: Part I: Roman. Journal of the Iron and Steel Institute 207,
1556-1564.
Morton, G.R. & Wingrove, J. 1972. Constitution of bloomery
slags: Part II: Medieval. Journal of the Iron and Steel Institute
210, 478–488.
MTA, 1972. Lead, Copper and Zinc Deposits of Turkey. Mineral
Research and Exploration Institute of Turkey, Publication no.
133, Ankara.
Nowak. 1927. Çankırı Demir Madeni (Iron Deposits of Çankırı).
Mineral Research and Exploration Institute of Turkey, Ankara,
Report no. 440 [in Turkish, unpublished].
Seeliger, T.C., Pernicka, E., Wagner, G.A., Begemann, F.,
Schmitt-Strecker, S., Eibner, C., Öztunali, Ö. &
Baranyi, I. 1985. Archæometallurgische Untersuchungen in
Nord- und Ostanatolien. Jahrbuch des Römisch-Germanischen
Zentralmuseums 32, 597–659.
Uğuz, M.F., Sevİn, M. & Duru, M. (compilers). 2002. 1:500,000
Scale Geological Maps of Turkey, no: 3, Sinop Sheet. General
Directorate of Mineral Research and Exploration (MTA)
Publications, Ankara.
Wertime, T.A. 1980. The pyrotechnologic background. In: Wertime,
T.A. & Muhly, J.D. (eds), The Coming of the Age of Iron. Yale
University Press, New Haven, 1–24.
A Note: Appendix materials will only be found in the electronic version.
335
IRON SLAGS OF THE YAPRAKLI AREA (ÇANKIRI), TURKEY
Appendix A
Table A1. Composition of Metallic Iron.
Sample
spot
wt
Si
TK97–07A1
TK97–07A1
TK97–07A1
TK97–07A1
TK97–07A4
TK97–07A4
TK97–07A7
TK99–10C3
TK99–10C3
TK99–10C3
TK99–10C3
TK97–06B2
TK97–06B2
TK97–06B3
TK97–06B3
TK99–10B2
TK99–10B2
TK99–10A9
TK99–10A9
TK99–08A3
TK99–08A3
TK99–04C4
TK99–04C4
TK99–04C4
TK99–04C5
TK97–06C2
TK97–06C2
TK97–06C2
TK99–03A3
TK99–03A3
TK99–04A3
14
15
16
17
34
35
53
65
66
67
68
9
10
18
19
38
39
103
104
43
44
20
21
22
30
50
53
55
75
76
104
%
%
%
%
%
%
%
%
%
%
%
%
%
%
%
%
%
%
%
%
%
%
%
%
%
%
%
%
%
%
%
0
%
average
Ti
Al
1.81
0.00
0.00
0.01
0.00
0.00
0.00
0.01
0.00
0.01
0.00
0.00
0.00
0.00
0.22
0.00
0.00
0.00
0.00
0.07
0.03
0.03
0.03
0.02
0.02
1.17
1.29
1.27
0.02
0.04
0.03
0.07
0.07
0.05
0.09
0.68
0.13
0.41
0.10
0.07
0.07
0.09
0.09
0.11
0.09
0.05
0.04
0.09
0.14
0.15
0.49
0.18
0.04
0.01
0.04
0.00
0.00
0.02
0.03
0.08
0.04
0.02
0.01
0.00
0.02
0.01
0.00
0.03
0.24
0.00
0.01
0.01
0.01
0.01
0.00
0.01
0.01
0.01
0.01
0.01
0.01
0.12
0.01
0.00
0.01
0.00
0.00
0.01
0.00
0.01
0.00
0.00
0.00
0.20
0.11
0.02
Fe
Mn
Mg
Ca
Na
K
P
Ba
Cr
98.03
102.20
102.33
102.48
99.09
100.94
98.50
100.89
99.10
98.96
99.02
102.60
102.10
101.43
92.22
99.31
100.78
98.99
99.29
98.31
101.36
99.87
99.78
100.19
100.05
96.56
97.40
96.25
99.49
99.07
96.75
0.06
0.12
0.09
0.10
0.07
0.07
0.10
0.07
0.08
0.07
0.08
0.13
0.15
0.13
0.39
0.12
0.15
0.14
0.17
0.01
0.00
0.01
0.00
0.00
0.03
0.07
0.01
0.00
0.05
0.04
0.03
0.00
0.00
0.01
0.00
0.04
0.01
0.08
0.00
0.01
0.00
0.01
0.02
0.03
0.03
0.04
0.02
0.04
0.01
0.04
0.04
0.01
0.00
0.00
0.00
0.00
0.00
0.01
0.00
0.00
0.00
0.01
0.04
0.05
0.05
0.06
0.05
0.08
0.06
0.06
0.05
0.04
0.06
0.12
0.12
0.10
0.11
0.08
0.09
0.17
0.17
0.07
0.06
0.00
0.01
0.00
0.00
0.00
0.00
0.00
0.06
0.14
0.01
0.01
0.01
0.01
0.00
0.02
0.01
0.01
0.00
0.00
0.00
0.03
0.05
0.03
0.04
0.03
0.04
0.03
0.03
0.03
0.04
0.01
0.04
0.03
0.03
0.00
0.00
0.03
0.02
0.06
0.05
0.00
0.04
0.05
0.05
0.05
0.04
0.06
0.05
0.05
0.06
0.05
0.06
0.07
0.06
0.07
0.07
0.08
0.08
0.07
0.07
0.02
0.02
0.00
0.00
0.01
0.00
0.02
0.00
0.00
0.02
0.02
0.00
0.13
0.05
0.14
0.17
0.37
0.07
0.07
0.21
0.22
0.10
0.16
0.06
0.04
0.06
0.04
0.17
0.16
0.04
0.05
0.00
0.02
0.15
0.08
0.60
0.13
0.20
0.08
0.13
1.70
1.27
0.09
0.06
0.07
0.08
0.23
0.02
0.06
0.09
0.21
0.04
0.19
0.10
0.36
0.38
0.34
0.32
0.31
0.41
0.41
0.26
0.02
0.00
0.07
0.00
0.00
0.00
0.00
0.08
0.06
0.00
0.00
0.00
0.14
0.13
0.17
0.14
0.17
0.17
0.20
0.13
0.15
0.15
0.14
0.25
0.24
0.30
2.71
0.23
0.23
0.23
0.25
0.01
0.02
0.00
0.02
0.01
0.02
0.60
0.47
0.47
0.03
0.00
0.07
100.00
102.76
103.00
103.12
100.56
101.61
99.82
101.72
99.77
99.65
99.75
103.77
103.26
102.58
96.19
100.41
102.09
100.23
100.49
99.23
101.71
100.22
99.97
100.89
100.25
98.62
99.40
98.22
101.51
100.68
97.01
99.46
0.08
0.02
0.06
0.02
0.04
0.22
0.13
0.25
100.60
Table A2. Additional Iron Slag Locations of the Yapraklı Area.
Sites reported but not visited in this study:
(de Jesus 1980, p. 241−245)
Ahmet Burhan
Damlu Yurt Deresi
Eyriceova Mevkii
Kıyaltı Mevkii
Mehmet Takmen Tar.
Papurun Kaşı
Yanyaylası Mevkii
(Seeliger et al. 1985, p. 601)
Papazın Kaşı Tepe
Ovacık Yaylası
Ak Gedikin Kaş, Arta Yere
Kavak Yayla
Kapaklı Kaş
Total
W.E. SHARP & S.K. MITTWEDE
700.
650.
C-14 Age [years BP]
600.
550.
500.
450.
400.
350.
1280.
1300.
1320.
1340.
1360.
1380.
1400.
1420.
Calendar Age [AD]
Figure A1. Diagram showing measured C-14 ages versus calendar ages.
1440.
1460.
IRON SLAGS OF THE YAPRAKLI AREA (ÇANKIRI), TURKEY
Appendix B
Table B1. Composition of Metallic Iron.
Sample
spot
wt
Si
97–07A1
97–07A1
97–07A1
97–07A1
97–07A4
97–07A4
97–07A7
99–10C3
99–10C3
99–10C3
99–10C3
99–06B2
99–06B2
99–06B3
99–06B3
99–10B2
99–10B2
99–10A9
99–10A9
99–08A3
99–08A3
99–04C4
99–04C4
99–04C4
99–04C5
99–06C2
99–06C2
99.40
99–06C2
99–03A3
99–03A3
99–04A3
14
15
16
17
34
35
53
65
66
67
68
9
10
18
19
38
39
103
104
43
44
20
21
22
30
50
53
%
%
%
%
%
%
%
%
%
%
%
%
%
%
%
%
%
%
%
%
%
%
%
%
%
%
%
55
75
76
104
0
average
Ti
Al
1.81
0.00
0.00
0.01
0.00
0.00
0.00
0.01
0.00
0.01
0.00
0.00
0.00
0.00
0.22
0.00
0.00
0.00
0.00
0.07
0.03
0.03
0.03
0.02
0.02
1.17
1.29
0.07
0.07
0.05
0.09
0.68
0.13
0.41
0.10
0.07
0.07
0.09
0.09
0.11
0.09
0.05
0.04
0.09
0.14
0.15
0.49
0.18
0.04
0.01
0.04
0.00
0.00
0.02
0.01
0.00
0.02
0.01
0.00
0.03
0.24
0.00
0.01
0.01
0.01
0.01
0.00
0.01
0.01
0.01
0.01
0.01
0.01
0.12
0.01
0.00
0.01
0.00
0.00
0.01
0.00
%
%
%
%
1.27
0.02
0.04
0.03
0.03
0.08
0.04
0.02
%
0.20
0.11
Fe
Mn
Mg
Ca
Na
K
P
Ba
Cr
Total
98.03
102.20
102.33
102.48
99.09
100.94
98.50
100.89
99.10
98.96
99.02
102.60
102.10
101.43
92.22
99.31
100.78
98.99
99.29
98.31
101.36
99.87
99.78
100.19
100.05
96.56
97.40
0.06
0.12
0.09
0.10
0.07
0.07
0.10
0.07
0.08
0.07
0.08
0.13
0.15
0.13
0.39
0.12
0.15
0.14
0.17
0.01
0.00
0.01
0.00
0.00
0.03
0.07
0.01
0.00
0.00
0.01
0.00
0.04
0.01
0.08
0.00
0.01
0.00
0.01
0.02
0.03
0.03
0.04
0.02
0.04
0.01
0.04
0.04
0.01
0.00
0.00
0.00
0.00
0.00
0.01
0.04
0.05
0.05
0.06
0.05
0.08
0.06
0.06
0.05
0.04
0.06
0.12
0.12
0.10
0.11
0.08
0.09
0.17
0.17
0.07
0.06
0.00
0.01
0.00
0.00
0.00
0.00
0.01
0.01
0.01
0.00
0.02
0.01
0.01
0.00
0.00
0.00
0.03
0.05
0.03
0.04
0.03
0.04
0.03
0.03
0.03
0.04
0.01
0.04
0.03
0.03
0.00
0.00
0
0.04
0.05
0.05
0.05
0.04
0.06
0.05
0.05
0.06
0.05
0.06
0.07
0.06
0.07
0.07
0.08
0.08
0.07
0.07
0.02
0.02
0.00
0.00
0.01
0.00
0.02
.03
0.13
0.05
0.14
0.17
0.37
0.07
0.07
0.21
0.22
0.10
0.16
0.06
0.04
0.06
0.04
0.17
0.16
0.04
0.05
0.00
0.02
0.15
0.08
0.60
0.13
0.20
0.00
0.06
0.07
0.08
0.23
0.02
0.06
0.09
0.21
0.04
0.19
0.10
0.36
0.38
0.34
0.32
0.31
0.41
0.41
0.26
0.02
0.00
0.07
0.00
0.00
0.00
0.00
0.08
0.14
0.13
0.17
0.14
0.17
0.17
0.20
0.13
0.15
0.15
0.14
0.25
0.24
0.30
2.71
0.23
0.23
0.23
0.25
0.01
0.02
0.00
0.02
0.01
0.02
0.60
0.08
100.00
102.76
103.00
103.12
100.56
101.61
99.82
101.72
99.77
99.65
99.75
103.77
103.26
102.58
96.19
100.41
102.09
100.23
100.49
99.23
101.71
100.22
99.97
100.89
100.25
98.62
0.47
0.01
0.00
0.00
0.00
96.25
99.49
99.07
96.75
0.00
0.05
0.04
0.03
0.00
0.00
0.00
0.01
0.00
0.06
0.14
0.01
0.02
0.06
0.05
0.00
0.00
0.02
0.02
0.00
0.13
1.70
1.27
0.09
0.06
0.00
0.00
0.00
0.47
0.03
0.00
0.07
98.22
101.51
100.68
97.01
0.02
99.46
0.08
0.02
0.06
0.02
0.04
0.22
0.13
0.25
100.60
MnO
MgO
CaO
Na2O
P2O5
BaO
Cr2O3
Total
Table B2. Composition of Plagioclase (Labradorite-Bytownite).
Sample
97–07A3
97–07A3
97–07A3
97–07A6
97–07A6
99–06B1
99–06B1
99–06B3
99–06B3
99–06B3
99–06B3
99–06B4
99–06B4
99–04B2
99–04B2
99–08A5
99–08A5
99–08A5
99–10A2
99–10A2
99–10A4
99–10A4
average
Ideal–An70
spot
wt
SiO2
TiO2
Al2O3
28.
29.
32.
48.
49.
3.
4.
22.
23.
24.
25.
27.
28.
3.
7.
34.
35.
36.
70.
71.
80.
81.
%
%
%
%
%
%
%
%
%
%
%
%
%
%
%
%
%
%
%
%
%
%
46.77
48.90
48.84
48.29
48.22
49.67
49.32
50.27
50.38
50.83
52.11
50.40
50.28
51.59
50.85
48.99
49.58
50.25
49.88
49.99
49.49
50.18
0.05
0.05
0.10
0.00
0.10
0.14
0.03
0.11
0.17
0.18
0.16
0.13
0.09
0.22
1.74
0.17
0.00
0.13
0.06
0.16
0.25
0.06
28.06
29.58
29.60
29.72
29.54
29.71
30.24
28.73
28.98
28.04
26.86
27.90
28.70
28.52
24.47
31.23
31.09
29.79
28.08
28.40
28.25
28.47
5.41
0.93
0.41
0.49
0.85
1.62
0.84
0.90
0.85
1.22
1.24
1.37
1.24
1.13
2.92
1.62
1.64
1.90
1.29
1.50
2.08
1.33
0.00
0.00
0.00
0.00
0.00
0.00
0.00
0.00
0.02
0.03
0.00
0.05
0.03
0.02
0.10
0.01
0.01
0.03
0.01
0.02
0.02
0.01
0.15
0.15
0.27
0.00
0.29
0.30
0.31
0.30
0.20
0.33
0.32
0.33
0.25
0.87
2.01
0.19
0.15
0.23
0.14
0.17
0.19
0.19
13.17
14.41
15.00
15.39
15.54
14.04
14.96
13.85
13.57
13.58
12.35
14.07
14.21
15.19
14.95
15.86
15.40
14.59
14.13
14.27
13.91
14.13
1.92
2.05
2.00
1.42
1.43
2.40
2.17
2.38
2.42
2.48
2.57
2.27
2.19
2.11
1.83
1.74
1.93
2.07
2.28
2.27
2.23
2.34
0.61
1.07
0.87
1.28
1.08
0.94
0.74
1.41
1.47
1.55
2.19
1.52
1.35
0.74
0.77
1.16
1.29
1.58
1.21
1.04
0.97
0.93
0.03
0.00
0.01
0.00
0.02
0.03
0.02
0.06
0.02
0.02
0.02
0.05
0.02
0.04
0.12
0.00
0.00
0.03
0.02
0.01
0.01
0.01
0.00
0.00
0.00
0.00
0.00
0.00
0.03
0.03
0.03
0.08
0.10
0.12
0.17
0.02
0.05
0.00
0.06
0.00
0.17
0.09
0.09
0.13
0.00
0.00
0.00
0.00
0.00
0.02
0.01
0.03
0.01
0.02
0.02
0.01
0.02
0.03
0.12
0.05
0.00
0.00
0.04
0.02
0.02
0.00
96.16
97.13
97.08
96.60
97.07
98.88
98.65
98.06
98.12
98.34
97.93
98.21
98.53
100.47
99.95
101.01
101.15
100.58
97.30
97.95
97.52
97.78
0
%
%
50.54
49.78
.0
0.19
31.70
28.82
.0
1.49
.0
0.02
.0
0.33
14.36
14.39
3.40
2.11
.0
1.17
.0
0.03
.0
0.05
.0
0.02
100.00
98.39
FeO
K2O
W.E. SHARP & S.K. MITTWEDE
Table B3. Composition of Leucite.
Sample
97–07A5
97–07A5
97–07A5
97–07A5
average
Ideal
spot
wt
SiO2
TiO2
Al2O3
40
41
42
43
%
%
%
%
54.80
55.24
55.01
55.01
0.11
0.09
0.04
0.13
21.97
21.63
22.31
21.85
0
0
%
%
55.01
55.06
0.09
.0
21.94
23.36
FeO
MnO
MgO
CaO
Na2O
0.04
0.00
0.07
0.00
0.00
0.00
0.00
0.00
0.00
0.00
0.00
0.01
0.00
0.00
0.00
0.00
0.57
0.62
0.70
0.67
0.03
.0
0.00
.0
0.00
.0
0.00
.0
0.64
.0
MnO
MgO
CaO
Na2O
K2O
P 2 O5
BaO
Cr2O3
Total
19.21
19.21
18.96
19.10
0.03
0.00
0.00
0.00
0.00
0.00
0.00
0.00
0.00
0.00
0.00
0.00
96.71
96.79
97.09
96.76
19.12
21.58
0.01
.0
0.00
.0
0.00
.0
96.84
100.00
P 2 O5
BaO
Cr2O3
Total
Table B4. Composition of Titanaugite.
Sample
97–07A3
97–07A3
97–07A5
97–07A5
97–07A5
97–07A5
99–06B1
99–06B1
99–06B4
99–06B4
99–03B2
99–03B2
99–03B2
99–03B2
99–10A4
99–10A4
average
2
3
spot
wt
SiO2
TiO2
Al2O3
FeO
K2O
30
33
44
45
46
47
5
6
29
30
46
47
50
51
92
93
%
%
%
%
%
%
%
%
%
%
%
%
%
%
%
%
45.53
45.28
40.87
41.43
41.73
41.75
47.21
47.73
41.84
41.66
42.66
41.77
42.73
41.66
46.13
46.70
3.59
3.54
4.44
3.78
4.05
3.59
2.46
2.00
4.75
5.09
3.21
3.34
3.58
3.89
3.31
2.87
10.00
6.88
8.95
8.69
8.76
8.13
6.03
5.36
8.85
8.73
7.91
7.39
9.07
8.15
11.03
10.61
16.89
8.11
13.17
13.95
13.07
16.20
12.39
14.35
15.14
15.75
18.74
20.81
19.17
19.17
17.92
17.47
0.20
0.23
0.25
0.23
0.20
0.32
0.40
0.47
0.23
0.31
0.39
0.40
0.36
0.30
0.31
0.35
1.03
11.81
7.41
6.82
7.54
5.83
13.66
14.21
6.50
6.12
6.41
5.77
5.12
5.97
1.34
3.31
15.16
20.73
22.49
22.15
22.50
22.00
16.73
14.82
21.06
21.19
17.21
16.90
16.11
17.74
15.76
13.81
1.50
0.17
0.04
0.06
0.07
0.09
0.20
0.18
0.12
0.16
0.23
0.20
0.39
0.16
0.77
0.43
3.12
0.00
0.01
0.01
0.00
0.01
0.14
0.13
0.04
0.03
0.36
0.21
0.94
0.34
1.28
2.16
0.55
0.08
0.55
0.39
0.44
0.10
0.11
0.11
0.21
0.28
0.21
0.16
0.19
0.23
0.23
0.25
0.00
0.00
0.00
0.00
0.00
0.00
0.14
0.07
0.16
0.08
0.14
0.05
0.11
0.07
0.18
0.11
0.00
0.88
0.00
0.00
0.00
0.00
0.23
0.25
0.13
0.11
0.13
0.26
0.18
0.23
0.09
0.10
97.55
97.70
98.18
97.52
98.35
98.01
99.68
99.69
99.01
99.51
97.59
97.26
97.96
97.92
98.35
98.16
0
0
0
%
%
%
43.54
47.11
40.28
3.59
3.75
3.85
8.41
3.00
10.30
15.77
15.56
12.73
0.31
.0
.0
6.80
16.85
7.78
18.52
13.54
23.57
0.30
0.22
0.36
0.55
0.02
.0
0.26
.0
.0
0.07
.0
.0
0.16
.0
.0
98.28
99.96
99.06
P 2 O5
BaO
Cr2O3
Total
2) titanaugite, basalt, Hiva Oa, Marquesas Is.
3) titanaugite, melilite-nepheline dolerite, Scawt Hill Co. Antrim. Fe2O3 converted to FeO(from Deer et al. 1963b, p. 123)
Table B5. Composition of Ulvöspinel*.
Sample
99–06B4
99–10A2
99–10A4
99–10A4
99–10A4
99–08A4
99–04C3
99–04C1
99–04C1
average
Ideal
8
spot
wt
SiO2
TiO2
Al2O3
31
74
82
84
87
27
17
40
41
%
%
%
%
%
%
%
%
%
0.00
0.50
0.00
0.00
0.00
0.24
0.36
0.37
0.30
28.12
27.07
24.31
26.93
26.22
26.59
27.77
22.64
23.34
3.32
3.53
3.52
4.11
3.54
5.47
5.48
6.95
7.57
0
0
0
%
%
%
0.20
0.00
0.33
25.89
35.73
26.76
4.83
0.00
2.31
FeO
MnO
MgO
CaO
Na2O
K2O
60.71
60.32
58.00
60.63
59.58
62.34
58.09
52.76
54.69
0.71
0.53
0.56
0.59
0.55
0.53
0.42
0.17
0.25
0.55
1.13
1.20
0.50
1.29
0.24
1.60
2.53
1.91
0.25
0.29
0.27
0.29
0.27
0.10
0.24
0.25
0.32
0.02
0.02
0.04
0.04
0.01
0.01
0.01
0.00
0.00
0.11
0.16
0.08
0.08
0.07
0.02
0.07
0.05
0.06
0.08
0.06
0.08
0.06
0.06
0.00
0.00
0.00
0.00
0.31
0.40
0.43
0.33
0.25
0.00
0.00
0.00
0.00
3.16
1.77
6.86
2.55
4.09
0.49
1.87
8.48
6.06
97.33
95.77
95.33
96.11
95.92
96.02
95.93
94.21
94.50
58.57
64.27
64.29
0.48
0.00
0.61
1.22
0.00
1.93
0.25
0.00
0.59
0.02
0.00
.0
0.08
0.00
.0
0.04
0.00
.0
0.19
0.00
.0
3.93
0.00
0.38
95.68
100.00
97.48
P 2 O5
BaO
Cr2O3
Total
*Most ulvöspinel is in solid solution with magnetite.
8 - Titanomagnetite, teschenite, Black Jack sill, Gunnnedah, NSW, Australia Fe2O3 recalculated as FeO (Deer et al. 1962e, p. 73)
Table B6a. Composition of Fayalite* – Fa66.
Sample
97–07A3
99–06B1
99–06B3
99–04C1
99–04C2
99–04C2
average
Fa66
spot
wt
SiO2
TiO2
Al2O3
31
8
26
39
37
38
%
%
%
%
%
%
32.93
31.57
34.76
31.37
31.82
31.57
0.12
0.19
0.22
0.34
0.34
0.25
0.00
0.08
0.45
0.16
0.11
0.12
0
0
%
%
32.34
32.95
0.24
.0
0.15
.0
FeO
MnO
MgO
CaO
Na2O
45.05
55.00
41.34
55.90
54.05
55.37
0.56
1.33
0.80
0.61
0.59
0.63
19.62
10.90
22.59
10.64
12.49
11.49
0.84
1.14
0.75
0.78
0.77
0.72
0.01
0.02
0.05
0.01
0.00
0.02
0.00
0.10
0.25
0.06
0.03
0.00
0.08
0.10
0.14
0.03
0.05
0.02
0.00
0.14
0.16
0.17
0.00
0.03
0.00
0.13
0.14
0.04
0.01
0.05
99.21
100.70
101.65
100.11
100.24
100.28
51.12
52.01
0.75
.0
14.62
15.03
0.84
.0
0.02
.0
0.07
.0
0.07
.0
0.08
.0
0.06
.0
100.37
99.99
*values of CaO greater than 0.9 % and values of K2O greater than 0.5 % suggest the presence of admixed glass.
K2O
IRON SLAGS OF THE YAPRAKLI AREA (ÇANKIRI), TURKEY
Table B6b. Composition of Fayalite* – Fa88.
Sample
99–06B1
99–08A2
99–08A2
99–08A2
99–08A4
99–08A4
99–10A4
average
Fa88
spot
wt
SiO2
TiO2
Al2O3
7
15
16
19
25
26
88
%
%
%
%
%
%
%
30.02
29.60
29.90
30.13
29.23
29.73
34.97
0.26
0.34
0.38
0.41
0.35
0.26
0.52
0.19
0.06
0.10
0.08
0.11
0.12
3.42
0
0
%
%
30.51
30.62
0.36
.0
0.58
.0
FeO
MnO
MgO
CaO
Na2O
57.37
64.71
64.06
63.51
66.12
64.20
50.12
1.68
0.74
0.79
0.76
0.60
0.92
0.81
7.10
2.90
4.98
5.07
2.33
3.67
6.09
2.60
0.89
0.65
0.59
0.06
0.09
2.03
0.01
0.04
0.01
0.02
0.00
0.00
0.36
61.44
64.44
0.90
.0
4.59
4.93
0.98
.0
0.06
.0
K 2O
P2O5
BaO
Cr2O3
Total
0.12
0.01
0.01
0.00
0.01
0.00
0.76
0.91
0.03
0.17
0.10
0.13
0.19
0.10
0.09
0.17
0.07
0.00
0.00
0.00
0.17
0.13
0.01
0.00
0.00
0.00
0.02
0.10
100.50
99.50
101.12
100.69
98.96
99.19
99.43
0.13
.0
0.23
.0
0.07
.0
0.04
.0
99.91
99.99
P2O5
BaO
Cr2O3
Total
*values of CaO greater than 0.9 % and values of K2O greater than 0.5% suggest the presence of admixed glass.
Table B7. Composition of Hematite*
Sample
97–07A1
97–07A1
97–07A1
99–09B3
97–09B3
99–04B1
99–10A5
average
ideal
spot
wt
SiO2
TiO2
Al2O3
18
20
21
20
21
1
94
%
%
%
%
%
%
%
0.16
0.40
0.18
0.37
0.28
0.09
0.18
0.10
0.06
0.06
0.10
0.10
0.14
2.44
0.07
0.03
0.02
0.02
0.01
0.02
0.50
0
0
%
%
0.24
.0
0.43
.0
FeO
MnO
MgO
CaO
Na2O
K 2O
89.69
87.19
88.70
89.03
90.63
88.09
86.33
0.04
0.06
0.04
0.09
0.12
0.04
0.43
0.00
0.00
0.00
0.00
0.01
0.02
0.24
0.06
0.12
0.08
0.13
0.12
0.12
0.09
0.00
0.02
0.03
0.00
0.03
0.20
0.01
0.03
0.04
0.05
0.07
0.07
0.00
0.06
0.08
0.20
0.05
0.28
0.09
0.21
0.06
0.00
0.00
0.00
0.24
0.23
0.15
0.21
0.05
0.24
0.03
0.18
0.21
0.09
0.20
90.28
88.35
89.25
90.50
91.89
89.19
90.76
0.10
.0
88.52
89.98
0.12
.0
0.04
.0
0.10
.0
0.04
.0
0.05
.0
0.14
.0
0.12
.0
0.14
.0
90.03
89.98
MnO
MgO
CaO
Na2O
P2O5
BaO
Total
*Total iron expressed as FeO.
Table B8. Composition of Magnesiochromite.
Sample
spot
wt
SiO2
TiO2
Al2O3
Cr2O3
FeO
99–06B2
99–10A7
99–08A1
99–08A2
99–03A6
99–03B2
99–03B2
99–10A3
99–03A3
99–03A1
99–08A2
99–10A3
99–08A2
99–08A1
99–08A1
99–10C6
99–10C2
99–10C2
99–10C6
99–03B2
99–08A2
99–08A2
99–04A4
99–03A1
99–04C2
99–03A5
99–03A1
99–03A3
12
100
1
12
88
42
43
79
74
58
13
78
11
3
4
78
62
61
77
48
18
18
111
57
36
86
59
73
%
%
%
%
%
%
%
%
%
%
%
%
%
%
%
%
%
%
%
%
%
%
%
%
%
%
%
%
0.00
0.00
0.01
0.03
0.02
0.00
0.00
0.00
0.03
0.05
0.04
0.00
0.32
0.01
0.01
0.22
0.00
0.00
0.20
0.00
0.03
0.03
0.07
0.01
0.00
0.09
0.02
0.05
0.26
0.22
0.09
0.27
0.04
0.18
0.28
0.03
0.27
0.10
0.36
0.09
0.34
0.26
0.26
0.11
0.07
0.01
0.13
0.39
0.07
0.07
0.07
0.15
0.36
0.13
0.17
0.20
7.53
5.66
6.23
7.12
12.26
6.64
11.51
15.67
17.35
16.01
15.11
15.14
15.72
18.07
18.38
20.07
22.20
22.16
22.30
20.62
25.46
25.46
25.26
27.69
27.01
33.89
35.36
36.42
63.52
61.67
60.15
59.86
57.88
55.44
54.56
54.21
53.84
53.48
53.19
53.00
51.61
50.97
50.55
48.14
47.65
47.22
46.27
44.54
43.64
43.64
43.04
40.98
38.60
36.89
35.22
32.46
20.72
24.34
25.79
24.34
19.26
29.11
23.80
20.71
17.26
20.20
22.54
24.03
24.27
19.70
19.95
20.33
16.52
16.31
20.16
23.22
18.36
18.36
18.23
18.92
23.18
13.21
14.69
16.35
1.28
0.51
0.00
0.00
0.00
0.61
0.41
0.45
0.00
0.00
0.00
0.58
0.00
0.00
0.00
0.29
0.26
0.26
0.28
0.37
0.00
0.00
0.00
0.00
0.00
0.00
0.00
0.00
7.97
8.06
6.78
7.49
10.78
6.25
7.56
9.42
11.61
9.56
8.73
7.28
8.00
10.83
10.70
9.88
12.85
12.77
10.19
7.81
12.69
12.69
12.25
12.02
11.06
15.40
15.56
14.41
0.12
0.08
0.01
0.00
0.03
0.07
0.08
0.07
0.03
0.08
0.02
0.08
0.03
0.00
0.01
0.08
0.00
0.00
0.07
0.13
0.01
0.01
0.04
0.05
0.00
0.08
0.03
0.05
0.02
0.03
0.01
0.00
0.03
0.03
0.02
0.04
0.07
0.02
0.02
0.03
0.00
0.02
0.00
0.00
0.00
0.01
0.00
0.04
0.01
0.01
0.00
0.02
0.02
0.03
0.02
0.06
0.04
0.05
0.00
0.00
0.01
0.06
0.06
0.05
0.00
0.01
0.00
0.03
0.04
0.01
0.00
0.01
0.00
0.00
0.00
0.06
0.00
0.00
0.00
0.01
0.00
0.02
0.02
0.02
0.04
0.01
0.00
0.03
0.05
0.04
0.06
0.02
0.00
0.00
0.01
0.03
0.00
0.03
0.01
0.01
0.03
0.01
0.00
0.04
0.00
0.00
0.00
0.01
0.00
0.00
0.04
0.04
0.23
0.17
0.17
0.00
0.03
0.26
0.24
0.15
0.30
0.19
0.00
0.26
0.02
0.00
0.00
0.00
0.00
0.00
0.00
0.13
0.00
0.00
0.01
0.07
0.04
0.08
0.00
0.00
101.73
100.81
99.24
99.14
100.38
98.66
98.57
100.81
100.78
99.71
100.03
100.56
100.36
99.90
99.86
99.14
99.58
98.75
99.61
97.34
100.27
100.27
98.95
99.92
100.28
99.82
101.13
100.05
0
0
%
%
0.04
.0
0.18
0.69
19.01
13.36
49.36
52.77
20.49
21.78
0.19
0.20
10.38
10.31
0.04
0.28
0.02
.0
0.02
.0
0.02
.0
0.08
.0
99.84
99.39
average
5
5 – chromite, Kolhan Govt. Estate, Singhbhum district, Bihar, India Fe2O3 recalculated as FeO (Deer et al. 1962e p. 79).
K 2O
W.E. SHARP & S.K. MITTWEDE
Table B9. Composition of Quartz.
TiO2
Al2O3
97.78
92.72
89.41
92.32
98.11
97.29
98.20
98.25
96.75
96.77
97.56
97.97
97.97
99.39
99.52
99.67
100.53
100.19
99.91
100.08
99.43
99.89
98.97
99.59
99.44
99.54
99.81
99.70
97.83
99.12
99.27
99.30
0.00
0.00
0.00
0.00
0.00
0.00
0.00
0.00
0.00
0.00
0.00
0.00
0.00
0.00
0.00
0.04
0.02
0.00
0.05
0.00
0.00
0.02
0.02
0.01
0.00
0.02
0.00
0.00
0.45
0.03
0.01
0.00
0.26
3.11
2.56
0.93
0.04
0.06
0.14
0.27
1.14
0.45
0.02
0.04
0.01
0.16
0.01
0.04
0.04
0.03
0.02
0.07
0.25
0.24
0.17
0.02
0.08
0.06
0.05
0.31
0.19
0.27
0.28
0.00
98.20
100.00
0.02
.0
0.35
.0
Sample
spot
wt
SiO2
97–07A2
97–07A2
97–07A4
97–07A4
99–10C5
99–10C5
99–06B1
99–06B1
99–06B2
99–10A4
99–10A4
99–10A8
99–10A8
99–08A1
99–08A1
99–08A1
99–08A5
99–08A5
99–08A5
99–08A3
99–08A3
99–08A3
99–06C1
99–06C1
99–03A2
99–03A2
99–03A4
99–03A4
99–03A5
99–03A5
99–03A6
99–03A6
26
27
38
39
73
74
1
2
15
90
91
101
102
5
6
7
31
32
33
40
41
42
45
46
71
72
77
78
83
84
89
90
%
%
%
%
%
%
%
%
%
%
%
%
%
%
%
%
%
%
%
%
%
%
%
%
%
%
%
%
%
%
%
%
0
0
%
%
average
Ideal
FeO
MnO
MgO
CaO
Na2O
0.00
0.31
1.68
0.36
0.00
0.00
0.15
0.23
0.35
0.18
0.49
0.14
0.15
0.17
0.22
0.17
0.29
0.27
0.20
0.30
0.37
0.45
0.16
0.10
0.43
0.25
0.15
0.26
0.78
0.22
0.17
0.05
0.00
0.00
0.00
0.00
0.00
0.00
0.00
0.00
0.00
0.00
0.00
0.00
0.00
0.02
0.04
0.00
0.01
0.04
0.01
0.00
0.05
0.00
0.01
0.00
0.03
0.01
0.01
0.00
0.01
0.03
0.05
0.00
0.00
0.01
0.20
0.13
0.00
0.00
0.05
0.04
0.24
0.01
0.00
0.00
0.00
0.03
0.00
0.00
0.00
0.00
0.00
0.00
0.01
0.01
0.00
0.01
0.00
0.00
0.00
0.02
0.01
0.01
0.03
0.00
0.00
0.00
0.74
1.81
0.00
0.00
0.01
0.04
0.01
0.06
0.02
0.01
0.00
0.02
0.01
0.03
0.00
0.02
0.01
0.02
0.01
0.01
0.02
0.03
0.06
0.05
0.00
0.02
0.01
0.07
0.04
0.04
0.00
0.33
0.22
0.23
0.00
0.00
0.00
0.00
0.02
0.06
0.00
0.02
0.00
0.04
0.01
0.03
0.00
0.01
0.00
0.05
0.01
0.01
0.07
0.00
0.02
0.01
0.09
0.05
0.04
0.03
0.06
0.01
0.28
.0
0.01
.0
0.03
.0
0.10
.0
0.04
.0
K2O
P2O5
BaO
Cr2O3
Total
0.00
1.92
1.33
0.32
0.00
0.00
0.10
0.06
0.23
0.23
0.03
0.01
0.01
0.10
0.01
0.00
0.02
0.00
0.01
0.04
0.11
0.07
0.02
0.03
0.06
0.05
0.02
0.16
0.09
0.12
0.15
0.01
0.00
0.00
0.60
0.00
0.00
0.00
0.00
0.00
0.01
0.00
0.02
0.00
0.00
0.01
0.00
0.00
0.00
0.00
0.00
0.05
0.00
0.00
0.01
0.03
0.01
0.00
0.00
0.06
0.03
0.08
0.01
0.06
0.00
0.00
0.00
0.00
0.00
0.00
0.00
0.17
0.08
0.00
0.00
0.00
0.10
0.00
0.00
0.00
0.12
0.00
0.07
0.00
0.05
0.00
0.00
0.12
0.00
0.03
0.03
0.06
0.00
0.00
0.00
0.13
0.00
0.00
0.00
0.00
0.00
0.00
0.00
0.00
0.00
0.00
0.00
0.00
0.00
0.01
0.00
0.01
0.03
0.00
0.01
0.02
0.00
0.00
0.01
0.01
0.00
0.00
0.00
0.05
0.01
0.00
0.02
0.01
98.03
98.41
96.73
96.10
98.15
97.35
98.66
99.06
98.82
97.77
98.14
98.19
98.25
99.93
99.82
99.99
101.06
100.55
100.30
100.63
100.29
100.70
99.47
99.95
100.14
100.04
100.16
100.70
99.44
99.98
100.09
99.60
0.17
.0
0.03
.0
0.03
.0
0.01
.0
99.27
100.00
IRON SLAGS OF THE YAPRAKLI AREA (ÇANKIRI), TURKEY
Table B10. Composition of glass matrix – high iron.
spot
wt
SiO2
TiO2
Al2O3
FeO
97–07A6
97–07A6
99–10C1
99–10C1
99–10C2
99–10C2
99–10C3
99–10C5
99–10C5
99–10C6
99–10C6
99–10C6
99–10C6
99–10A1
99–10A1
99–10A2
99–10A2
99–10A4
99–10A4
99–10A6
99–10A6
99–08A2
99–08A2
99–08A2
99–08A5
99–08A5
99–08A5
99–08A5
99–08A5
99–08A3
99–08A3
99–04C3
99–04C4
99–04C4
99–04C4
99–04C4
99–04C4
99–04C2
99–04C2
99–04C2
99–03A1
99–03A1
99–03A1
50
51
59
60
63
64
69
75
76
79
80
81
82
68
69
72
73
85
86
98
99
14
20
21
37
38
39
38
39
45
46
19
23
26
27
28
29
42
43
44
62
68
69
%
%
%
%
%
%
%
%
%
%
%
%
%
%
%
%
%
%
%
%
%
%
%
%
%
%
%
%
%
%
%
%
%
%
%
%
%
%
%
%
%
%
%
47.51
47.40
51.13
50.26
50.22
50.59
47.66
48.84
51.27
52.59
48.73
49.35
48.78
47.38
47.91
45.61
45.94
46.10
46.08
46.87
47.82
44.54
44.76
44.97
45.25
45.76
50.00
44.81
49.63
47.19
48.12
42.38
37.23
39.26
42.99
39.52
42.33
43.12
45.34
45.46
46.16
45.56
44.92
2.95
3.12
3.02
2.91
3.11
2.78
3.08
3.04
2.14
1.84
3.22
4.07
3.76
4.36
4.14
3.13
2.65
3.13
2.64
3.60
4.02
4.78
2.41
4.06
2.29
2.72
1.68
2.39
1.62
4.70
2.97
5.20
2.41
1.41
4.11
5.89
2.22
4.62
2.69
3.65
5.76
4.29
4.83
8.85
7.41
13.30
11.85
13.39
13.72
11.74
11.19
13.03
12.45
11.99
11.71
10.84
11.29
11.69
10.41
11.17
10.43
10.31
10.95
11.15
14.04
13.38
13.45
10.66
10.80
12.36
10.78
12.27
10.39
12.18
13.99
7.74
9.21
13.53
11.92
11.87
13.86
14.54
16.21
11.13
12.95
12.68
Average
0
%
46.45
3.34
11.83
Sample
MnO
MgO
CaO
Na2O
18.90
15.15
14.83
15.38
18.58
16.50
22.28
17.30
17.33
16.08
18.79
19.44
17.95
20.44
17.36
22.94
21.76
19.84
20.49
22.99
16.80
20.77
23.50
21.34
24.57
23.92
19.85
27.82
19.89
22.92
20.95
23.34
39.52
34.88
23.78
26.80
29.04
22.56
21.52
15.35
15.33
13.70
15.52
0.40
0.36
0.24
0.23
0.24
0.15
0.31
0.30
0.21
0.23
0.30
0.23
0.32
0.41
0.40
0.43
0.41
0.41
0.41
0.49
0.43
0.27
0.34
0.30
0.37
0.38
0.27
0.34
0.33
0.34
0.35
0.25
0.49
0.50
0.29
0.31
0.36
0.24
0.28
0.25
1.28
1.21
1.05
3.08
5.72
2.81
4.79
0.76
1.17
1.73
4.37
1.70
2.92
2.29
2.03
4.46
1.59
2.47
2.06
2.32
3.17
3.13
1.17
2.92
0.19
0.29
0.23
2.33
2.11
1.16
1.05
1.13
1.67
0.56
1.57
5.07
3.91
1.25
1.21
2.27
0.90
0.54
0.67
0.45
0.22
0.85
11.61
15.84
8.67
8.93
8.88
8.39
8.18
9.10
8.43
9.40
9.84
7.71
9.03
9.78
11.59
10.48
11.71
12.73
12.35
8.44
12.35
12.22
11.53
12.07
10.85
11.12
9.92
9.45
9.98
10.14
11.44
8.13
4.64
6.58
10.11
10.55
8.74
11.40
11.57
13.45
16.97
16.41
15.04
0.41
0.19
0.91
0.70
0.79
0.90
0.65
0.65
0.90
0.80
0.64
0.55
0.53
1.23
1.14
0.87
0.84
0.50
0.51
0.82
0.75
0.71
0.65
0.70
0.61
0.73
1.02
0.73
0.99
0.83
0.78
0.66
0.42
0.46
0.58
0.52
0.54
0.52
0.57
0.54
1.90
1.91
1.68
20.88
0.39
2.01
10.60
0.78
K2O
P2O5
BaO
Cr2O3
Total
2.57
1.56
2.36
2.02
2.05
2.29
1.63
1.81
2.04
2.14
1.68
2.03
1.74
1.39
1.48
1.75
1.62
2.02
2.06
1.76
1.81
1.90
1.86
1.77
1.91
1.98
2.75
1.98
2.61
2.14
1.88
3.86
2.25
2.49
3.65
2.64
2.72
3.10
3.44
3.54
1.59
2.73
3.19
0.77
0.43
0.13
0.16
0.11
0.23
0.18
0.13
0.15
0.17
0.17
0.09
0.14
0.15
0.21
0.16
0.23
0.27
0.23
0.18
0.19
0.45
0.38
0.46
0.31
0.32
0.27
0.31
0.23
0.20
0.37
0.25
0.20
0.23
0.28
0.22
0.24
0.27
0.30
0.25
0.47
0.34
0.36
0.00
0.00
0.00
0.00
0.00
0.00
0.00
0.00
0.00
0.00
0.00
0.00
0.00
0.18
0.16
0.13
0.17
0.17
0.03
0.18
0.10
0.00
0.00
0.16
0.03
0.00
0.19
0.10
0.12
0.00
0.09
0.00
0.04
0.17
0.15
0.40
0.16
0.16
0.19
0.24
0.03
0.00
0.01
0.00
0.00
0.01
0.32
0.00
0.00
0.00
0.35
0.00
0.00
0.00
0.26
0.54
0.10
0.13
0.08
0.11
0.07
0.08
0.09
0.14
0.01
0.00
0.00
0.05
0.02
0.02
0.03
0.00
0.03
0.03
0.04
0.00
0.04
0.02
0.02
0.02
0.00
0.00
0.04
0.04
0.09
0.06
97.05
97.19
97.41
97.55
98.14
96.72
97.44
97.08
97.20
98.63
97.65
97.46
98.10
98.29
98.67
98.05
98.94
98.84
98.31
97.54
98.47
99.85
99.11
99.53
99.24
99.85
99.50
99.81
98.79
100.54
99.72
99.67
100.01
99.13
100.74
99.99
100.52
100.74
100.99
99.65
101.11
99.40
100.19
2.23
0.26
0.08
0.07
98.90
W.E. SHARP & S.K. MITTWEDE
Table B11. Composition of glass matrix - low iron.
Sample
spot
wt
SiO2
TiO2
Al2O3
FeO
99–09B2
99–10B2
99–03B2
99–03B2
99–04B1
99–04B2
99–04B2
99–04B2
99–04B2
99–04B2
99–04B2
99–04B2
99–04B2
99–09C1
99–09C1
99–09C1
99–09C2
99–09C2
99–03A1
99–03A1
99–03A1
99–04A1
99–04A1
99–04A3
99–04A3
16
40
44
45
2
4
5
6
8
9
10
11
12
47
48
49
51
52
61
64
65
100
101
107
108
%
%
%
%
%
%
%
%
%
%
%
%
%
%
%
%
%
%
%
%
%
%
%
%
%
55.97
51.54
62.19
61.02
51.26
50.44
50.15
51.36
50.30
49.99
50.79
50.12
50.15
52.82
54.37
53.71
53.09
54.61
51.49
48.30
47.24
46.25
46.99
47.08
46.77
8.52
4.27
4.73
5.14
5.03
2.11
4.58
4.74
4.42
4.69
4.94
4.25
4.41
5.57
5.87
6.22
5.90
6.10
1.67
5.07
5.61
3.54
3.39
3.30
3.44
10.95
11.87
11.74
11.81
13.14
22.12
13.04
14.07
12.68
12.74
13.08
13.09
13.17
13.66
13.95
13.70
13.75
13.81
24.30
13.58
13.85
17.63
18.32
17.00
16.61
0
%
51.52
4.70
14.55
Average
MnO
MgO
CaO
Na2O
5.89
9.39
2.19
3.54
8.72
4.92
9.61
8.12
9.83
10.56
9.43
9.77
9.84
10.38
9.95
10.27
10.11
9.77
2.86
8.99
9.78
10.06
10.16
9.09
7.09
0.35
0.43
0.34
0.32
0.51
0.21
0.52
0.41
0.53
0.51
0.52
0.46
0.50
0.50
0.47
0.57
0.49
0.45
0.32
0.56
0.64
1.06
1.01
1.14
0.77
0.30
3.47
1.99
1.46
4.22
1.94
4.48
4.94
4.88
4.41
4.31
4.64
4.61
2.73
2.44
2.42
2.98
2.67
0.85
2.98
2.61
2.94
2.12
3.74
5.32
8.03
13.43
7.99
6.45
12.61
14.31
12.62
13.39
12.83
12.62
12.71
12.78
12.67
9.31
8.89
9.19
9.44
9.26
13.41
14.66
15.23
10.78
9.98
11.99
14.28
1.39
0.66
0.56
0.82
0.58
1.85
0.63
1.36
0.67
0.69
0.72
0.63
0.67
0.65
0.62
0.62
0.58
0.58
3.01
1.83
1.74
0.74
0.78
0.72
0.61
8.41
0.54
3.18
11.55
0.95
MnO
MgO
CaO
Na2O
K2O
P2O5
BaO
Cr2O3
Total
6.16
1.97
4.82
5.83
1.91
0.91
1.75
1.47
1.74
1.65
1.81
1.78
1.83
1.79
1.94
1.82
1.77
1.84
2.05
3.27
3.14
3.73
4.23
3.24
3.23
0.17
0.07
0.07
0.02
0.12
0.07
0.06
0.12
0.13
0.08
0.13
0.09
0.10
0.01
0.00
0.05
0.05
0.06
0.10
0.28
0.43
0.06
0.12
0.14
0.22
0.31
0.17
0.06
0.20
0.10
0.33
0.00
0.24
0.00
0.00
0.02
0.02
0.15
0.00
0.09
0.06
0.10
0.00
0.08
0.10
0.00
0.34
0.26
0.29
0.23
0.05
0.32
0.27
0.19
0.29
0.14
0.36
0.41
0.33
0.36
0.31
0.34
0.32
0.42
0.37
0.47
0.43
0.37
0.10
0.19
0.16
0.00
0.00
0.00
0.00
98.11
97.58
96.95
96.79
98.48
99.35
97.81
100.62
98.33
98.29
98.78
97.95
98.41
97.84
98.96
99.11
98.69
99.54
100.23
99.81
100.43
97.13
97.35
97.73
98.57
2.63
0.11
0.13
0.25
98.51
P2O5
BaO
Cr2O3
Total
Table B12. Composition of glass matrix – high lime.
Sample
spot
wt
SiO2
TiO2
Al2O3
FeO
99–10B1
99–10B1
99–10B2
99–04B3
99–04B3
99–04B3
99–03A1
99–03A1
99–03A1
99–03A1
99–03A4
99–03A4
99–03A5
99–03A5
99–03A6
99–04A3
36
37
41
13
14
15
63
66
67
70
80
82
85
87
91
110
%
%
%
%
%
%
%
%
%
%
%
%
%
%
%
%
51.28
52.26
52.52
53.95
54.11
54.07
46.51
46.62
45.03
44.26
53.70
54.34
53.81
53.05
51.47
49.23
4.26
4.39
4.34
6.41
6.05
6.24
6.16
5.24
5.23
4.88
4.60
3.45
3.60
3.54
4.10
2.96
12.35
12.41
12.18
13.87
13.63
13.55
11.42
13.56
12.93
10.14
11.90
12.71
12.32
11.38
12.91
19.70
8.76
7.91
7.53
4.37
4.00
3.81
11.78
10.26
9.36
14.12
6.23
5.21
5.76
5.73
5.30
6.75
0.52
0.47
0.48
0.62
0.58
0.54
0.82
0.62
0.58
0.77
0.41
0.62
0.56
0.76
0.59
1.02
3.29
2.85
2.93
3.27
3.33
3.44
2.57
2.86
4.16
2.71
2.00
1.95
1.86
2.12
1.90
1.66
14.48
13.89
14.13
13.97
14.08
14.49
15.94
15.90
17.78
18.91
17.45
16.85
17.12
19.81
19.39
10.55
0.65
0.68
0.67
0.15
0.18
0.14
1.28
1.58
1.14
0.94
1.05
1.13
1.10
1.00
1.40
0.92
1.97
2.25
2.08
1.75
1.78
1.76
2.25
3.19
2.41
1.92
1.31
2.01
1.80
1.24
2.43
4.46
0.06
0.08
0.07
0.00
0.00
0.03
0.29
0.35
0.37
0.35
0.09
0.16
0.11
0.17
0.23
0.17
0.23
0.19
0.08
0.00
0.00
0.06
0.00
0.00
0.07
0.07
0.04
0.16
0.20
0.01
0.00
0.31
0.31
0.32
0.32
0.34
0.31
0.33
0.19
0.18
0.33
0.12
0.04
0.33
0.10
0.16
0.03
0.01
98.16
97.69
97.33
98.69
98.05
98.44
99.21
100.37
99.40
99.20
98.83
98.92
98.33
98.98
99.76
97.72
0
%
51.01
4.72
12.94
7.31
0.62
2.68
15.92
0.88
2.16
0.16
0.09
0.21
98.69
MnO
MgO
CaO
Na2O
P2O5
BaO
Cr2O3
Total
Average
K2O
Table B13. Composition of glass matrix – high potash and low lime - leucite normative
Sample
spot
wt
SiO2
TiO2
Al2O3
97–07A1
97–07A1
97–07A1
97–07A7
99–06B2
99–06B2
99–03B2
99–03B2
23
24
25
56
16
17
44
45
%
%
%
%
%
%
%
%
56.86
55.51
56.01
59.06
55.97
61.05
62.19
61.02
3.97
5.31
5.25
1.66
8.52
4.64
4.73
5.14
14.94
13.55
13.14
14.50
10.95
12.61
11.74
11.81
7.51
8.94
7.83
6.93
5.89
5.23
2.19
3.54
0.23
0.45
0.42
0.48
0.35
0.38
0.34
0.32
0.54
0.74
0.79
0.79
0.30
0.45
1.99
1.46
4.85
5.03
5.74
7.26
8.03
5.26
7.99
6.45
1.47
1.28
1.21
0.75
1.39
1.56
0.56
0.82
6.87
6.34
6.14
4.68
6.16
6.97
4.82
5.83
0.54
0.39
0.33
0.54
0.17
0.20
0.07
0.02
0.00
0.00
0.00
0.00
0.31
0.12
0.06
0.20
0.00
0.00
0.00
0.00
0.05
0.01
0.27
0.19
97.79
97.54
96.85
96.64
98.11
98.48
96.95
96.79
Average
0
%
58.46
4.90
12.91
6.01
0.37
0.88
6.33
1.13
5.98
0.28
0.09
0.07
97.39
FeO
K2O
IRON SLAGS OF THE YAPRAKLI AREA (ÇANKIRI), TURKEY
Table B14. Composition of glass matrix – low lime, high iron - hercynite normative.
Sample
spot
wt
SiO2
TiO2
Al2O3
FeO
99–10C3
99–08A1
99–08A1
99–08A4
99–08A4
99–08A4
70
8
10
28
29
30
%
%
%
%
%
%
50.93
50.77
52.41
45.89
48.06
47.79
2.79
3.48
4.05
4.31
1.67
1.53
13.49
10.90
12.06
14.38
14.76
14.00
Average
0
%
49.30
2.97
13.26
MnO
MgO
CaO
Na2O
18.66
24.26
23.53
28.47
26.35
28.46
0.15
0.93
0.94
0.51
0.54
0.57
0.90
1.28
0.85
0.24
0.27
0.35
7.19
4.74
2.62
2.97
4.24
3.24
0.86
0.97
0.86
0.52
0.56
0.64
24.96
0.61
0.64
4.17
0.74
MnO
MgO
CaO
Na2O
K2O
P 2 O5
BaO
Cr2O3
Total
2.40
1.78
1.62
1.81
1.44
1.33
0.21
0.35
0.39
0.34
0.44
0.34
0.00
0.09
0.00
0.07
0.00
0.05
0.00
0.05
0.01
0.03
0.03
0.00
97.56
99.60
99.34
99.54
98.35
98.32
1.73
0.35
0.04
0.02
98.79
P 2 O5
BaO
Cr2O3
Total
Table B15. Composition of glass matrix – low lime, low iron - mullite normative.
Sample
spot
wt
SiO2
TiO2
Al2O3
FeO
K2O
99–10C1
99–10C1
99–03A4
99–03A4
57
58
81
79
%
%
%
%
54.95
59.58
65.80
57.81
0.94
0.83
0.04
0.01
29.42
19.39
19.78
25.01
2.54
4.21
0.84
1.01
0.00
0.00
0.08
0.04
0.34
0.60
0.94
0.65
1.98
3.29
3.04
10.50
1.33
1.71
2.59
2.62
5.47
6.26
6.54
2.00
0.02
0.08
0.09
0.04
0.00
0.00
0.00
0.07
0.00
0.00
0.04
0.11
96.99
95.94
99.77
99.87
Average
0
%
59.54
0.46
23.40
2.15
0.03
0.63
4.70
2.06
5.07
0.06
0.02
0.04
98.14