Impacts of climate change on wave regimes in the east sea
Bạn đang xem bản rút gọn của tài liệu. Xem và tải ngay bản đầy đủ của tài liệu tại đây (2.73 MB, 5 trang )
Environmental Sciences | climatololy
Impacts of climate change on
wave regimes in the east sea
Xuan Hien Nguyen1*, Van Uu Dinh2, Van Khiem Mai 1, Van Tra Tran1, 3, Van Tien Pham1
Vietnam Institute of Meteorology, Hydrology and Climate Change, Vietnam
VNU University of Sciences, Vietnam
3
TU Dortmund University, Germany
1
2
Received 20 July 2016; accepted 25 October 2016
Abstract:
The study applied the PRECIS and SWAN modelling packages to simulate
wind and wave regimes under climate change in the Vietnam East Sea. The
results indicated that under RCP4.5 climate change scenario, by the end of the
century, there are significant changes in both wave height and wave period in
summer and winter months. In the East Sea during July, wave height is expected
to increase 11.5% while wave period expected to increases 3.3%. On the other
hand, wave height in January is projected to decrease approximately 7% while
wave period in the same month is projected to decreases 4.4%. There are no
significant changes in wave direction.
Keywords: climate change, climate change scenario, PRECIS, SWAN.
Classification number: 6.2
Introduction
Climate change causes global
warming and consequently, changes
meteorological, coastal, and wave
conditions, ocean currents, and sea level.
There is a large number of studies within
the last few years assessing the impacts
of climate change on sea wave regimes.
The study by Seneviratne, et al. (2012),
based on a large number of data sources
such as data from monitoring stations,
satellite image and wave hindcasting,
concluded that average weight height
have increased in the Pacific, and
Northern Atlantic within the last 50 years
and at the southern parts of global oceans
in the 1980s [1]. Other studies such as
Woolf, et al. (2002), Allan & Komar
(2006), Adams, et al. (2008), Menendez,
et al. (2008), Izaguirre, et al. (2011)
also based on different data sources,
determined the linkages between changes
in the wave-wind regime and the changes
in climate such as ENSO [2-6]. Other
studies on the impacts of climate change
on oceanic wave regime include Wang &
Swaii (2006), Hermer, et al. (2013), Mori,
et al. (2013), also showed an increase in
average significant wave height, wave
period and wave direction in the oceans.
The region with largest change occurs in
the southern part of global oceans with
an increase in average significant wave
height between 5 and 10% as compared
to now [7-9]. Graham, et al. (2013),
using several models (for the SRES A2
scenario), predicted a decrease in average
significant wave height in winter in the
Northern Hemisphere in the mid latitudes
in the Pacific by the end of the 21st century
[10]. Hemer, et al. (2012) applied various
simulation models (for SRES A2 and B1
scenarios) have also projected a decrease
in average significant wave height in the
South Eastern coastal area of Australia by
the end of the 21st Century as compared
to now [11].
In the East Sea region, the wave
regime is strictly governed by the
monsoon wind system. Under climate
change, however, the East Sea monsoon
is epected to be altered in both intensity
and timing [12], thus leading to changes
in the wave regimes in the East Sea.
Coresponding author:
*
88
Vietnam Journal of Science,
Technology and Engineering
March 2017 • Vol.59 Number 1
Methodology
PRECIS model
Providing Regional Climates for
Impacts Studies (PRECIS) model is a PC
based regional dynamical climate model
developed by the Met Office Hadley
Center. The model is designed to generate
detailed climate change scenarios for
small regions of the world. The basis
of the PRECIS model is the HadRM3P
model developed in 1991 to project
climate change. The PRECIS model has
been widely used globally to generate
regional and national climate change
scenarios. For a more detail description of
the PRECIS model, relevant documents
could be referred to [13].
SWAN model
Simulating Waves Near shore
(SWAN) model is a third generation
wave simulation model which simulates
the 2 dimensional wave spectral through
solving for the spectral action balance
equation. SWAN allows the simulation
of wave characteristics in the coastal
zones close to land, in lakes and estuaries
from input variables such as wind, bed
surface and current conditions. Detailed
description of the SWAN model could be
referred to in relevant documents [14].
Simulation conditions
PRECIS model:
In this study, the PRECIS model
was used in the bounded grid region
between 95oE - 135oE; and 10oS - 30oN,
with a resolution of 1/8 longitude/
latitude degree, and 19 horizontal
levels. Boundary and initial conditions
are updated from output predictions of
the third generation atmosphere-ocean
coupled model HadCM3Q0 of the Hadley
Center, United Kingdom. Five different
runs were performed on PRECIS with
a large scale boundary condition from
the HadCM3Q0 global model. The five
runs include: HadCM3Q0, HadCM3Q3,
HadCM3Q10,
HadCM3Q11
and
HadCM3Q13. In which: (i) HadCM3Q0:
is the base model, run under moderate
emissions. The remaining HadCM3Qx
scenario are dynamically and physically
Environmental Sciences | climatololy
adjusted from the base scenario;
(ii) HadCM3Q3: Small temperature
amplitude changes calibrated; (iii)
HadCM3Q10: Dry skew prediction
calibrated; (iv) HadCM3Q11: Wet skew
prediction calibrated; (v) HadCM3Q13:
Large temperature amplitude changes
calibrated.
SWAN model:
SWAN model was applied for the
entire East Sea region between 1oN-23oN
and 99oE-121oE with a grid size of 1/8
longitude/latitude degree. The boundary
conditions of the model are long term
wave characteristics determined from
global hindcasting data [15].
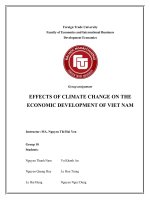
The topography of the study area was
generated from the Gebco database with
a resolution of 30 second. Fig. 1 depicts
the topography of the study area that was
used in the SWAN model.
Wind input data of the model is the
output of the PRECIS simulation from
above.
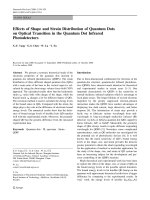
(a) Height and direction
Fig. 1. Topography of the study area.
(b) Period
Fig. 2. Average wave characteristics for January in the East Sea based on average wind data for the period of 19802000.
March 2017 • Vol.59 Number 1
Vietnam Journal of Science,
Technology and Engineering
89
Environmental Sciences | climatololy
(a) Height and direction
(b) Period
Fig. 3. Average wave characteristics for July in the East Sea based on average wind data for the period of 1980-2000.
(a) Height and direction
(b) Period
Fig. 4. Average wave characteristics for January in the East Sea based on average wind data for the period of 2080-2099.
Simulation results
Scenarios and assumptions
To determine the impacts of climate
change on wave regimes in the East Seas, 2
wind system scenarios were used: (i) a status
quo scenario (wind values were determined
from hindcasting in the period between 19802000; (ii) a climate change scenario (wind
was determined from PRECIS under RCP4.5
scenario for the period of 2080-2099).
Results and discussion
The simulated results showed that under
the status quo scenario, in winter months, wave
direction in the East Sea is predominantly
90
Vietnam Journal of Science,
Technology and Engineering
North-East. Largest wave height occurs in the
middle of the East Sea, along the North EastSouth West axis from the Bashi Chanel region
to the Mekong River estuary region with an
average weight height of 2-3 m.
In the coastal zone of Vietnam, the largest
wave height occurs offshore South Eastern
Vietnam with average wave height between
3-3.5 m, wave in the Northern coastal zone
is less in height and lies between 0.5 to 1 m
while wave heights in the Central coastal area
is around 1.5 to 2 m. Common wave period is
in between 5 to 7.5 seconds; with a maximum
reaching up to 8s in the North Eastern part
of the East Sea near the Philippines and
offshore South Eastern Vietnam (Fig. 2). In
March 2017 • Vol.59 Number 1
the summer months, wave direction in the
East Sea is predominantly South-West, with
largest wave height up to 2-2.5 m, occurring
in the middle of the East Sea. For the coastal
zone of Vietnam, largest wave height occurs
offshore South Central Vietnam with height
above 2 m. In the sea of the northern part of
Vietnam, wave heights are between 1.2 to 1.5
m, while in the south, wave only reaches 1m in
height. Wave period in the East Sea fluctuates
between 4 to 7 seconds, reaching a maximum
of 7.5 seconds in the seas of the South Central
Vietnam between Binh Dinh and Ninh Thuan
provinces (Fig. 3). The results agree well with
studies from Nguyen Manh Hung (2005) [15].
Under climate change scenario RCP4.5,
Environmental Sciences | climatololy
wave simulation shows that in comparison to
the 1980-2000 period (baseline), in the 20802099 period, spatial distribution of wave
height and period changes significantly, while
wave direction remains mostly unchanged.
In winter months, wave height and
wave period mostly decrease in the East
Sea, leading to a reduced regional spatial
distribution of wave height (Fig. 2a and 3a)
and wave period (Fig. 2b and 3b) compared
to the baseline scenario.
The changes in wave regimes under
climate change is further assessed at 8
locations through comparing the simulated
wave height and period at 8 representative
points in the East Sea (refer to Table 1).
Table 2. Wave height and period in January comparison for selected locations
in the East Sea for the baseline period and under climate change scenario.
Wave height (m)
Location
Bach Long Vi
Con Co
Cu Lao Cham
Hoang Sa
Phu Quy
Truong Sa
Con Dao
Gulf of Thailand
Baseline
0.99
1.08
1.26
1.68
2.54
1.68
1.97
0.54
CC
0.86
1.02
1.16
1.55
2.34
1.53
1.84
0.55
Change
(%)
-13.1
-5.6
-7.9
-7.7
-7.9
-8.9
-6.6
1.9
Wave period (s)
Baseline
5
6.89
6.82
7.15
7.08
6.59
7.72
5.97
Change
(%)
CC
4.23
6.62
6.68
7.06
6.83
6.13
7.69
5.87
-15.4
-3.9
-2.1
-1.3
-3.5
-7.0
-0.4
-1.7
Note: the “-“ sign indicates a reduction in either wave height or wave period.
Table 1. Data point location.
Coordinates
Longitude
Latitude
Bach Long Vi
107.750
20.125
Con Co
107.375
17.125
Cu Lao Cham
108.500
16.000
Hoang Sa
111.625
16.500
Phu Quy
109.000
10.500
Truong Sa
111.875
8.625
Con Dao
106.625
8.625
Gulf of Thailand
101.875
9.750
Results comparison for January representing winter (Table 2), indicated that
on average, wave height and wave period
in the East Sea decreases approximately
7% and 4.4% respectively. Wave height
reduction in the Bach Long Vi Island in the
Northern Gulf (aka Gulf of Tonkin) is 13.1%
and 15.4% respectively. In Con Co Island,
lowest wave height reduction is at 5.6%,
while lowest wave period reduction is 0.4%
at Con Dao Island. At Cu Lao Cham, Hoang
Sa, Phu Quy, and Truong Sa Islands, wave
height decreases between 7.7% and 8.9%
while wave period decreases between 1.3%
and 3.9%. On the contrary, wave height in the
Gulf of Thailand increases 1.9% while wave
period decreases 1.7%.
It can therefore be seen that changes
in wave height and period in the East Sea
is spatially variable. More specifically the
changing trend of wave height in the middle
of the Gulf of Thailand is in contradiction
with the changes in other regions.
In contrast to winter months, wave height
and wave period in summer mostly increase
in the East Sea, leading to an increase in
spatial distribution of wave height (Fig. 4a
and 5a) and wave period (Fig. 4b and 5b) as
(A) Height and direction
Fig. 5. Average wave characteristics for July in the East Sea, results based
on average wind data for the period of 2080-2099.
Data point
(b) Period
March 2017 • Vol.59 Number 1
Vietnam Journal of Science,
Technology and Engineering
91
Environmental Sciences | climatololy
Table 3. Wave height and wave period in July comparison in selected locations
in the East Sea for the baseline period and under climate change scenario.
Wave height (m)
Wave period (s)
Baseline
CC
Change
(%)
Baseline
CC
Change
(%)
Bach Long Vy
1.22
1.48
21.3
5.92
5.94
0.3
Con Co
0.91
1.1
20.9
4.06
4.08
0.5
Cu Lao Cham
0.21
0.26
23.8
5.54
5.73
3.4
Hoang Sa
1.03
1.16
12.6
6.46
6.69
3.6
Phu Quy
1.73
1.86
7.5
5.97
6.01
0.7
Truong Sa
1.12
1.24
10.7
5.73
5.89
2.8
Con Dao
0.77
0.79
2.6
4.93
4.94
0.2
Gulf of Thailand
0.79
0.73
-7.6
4.34
4.97
14.5
Location
Note: the “-“ sign indicates a reduction in either wave height or wave
period.
compared to the baseline period.
Results comparison for July - representing
summer and results in the baseline period is
depicted in Fig. 5. The results showed that
average wave height increases 11.5% while
average wave period increases 3.3%. The
region with the largest and smallest increase
in wave height as compared to the baseline
is Cu Lao Cham Island and Con Dao Island
with a 23.8% and 2.6% increase respectively.
Wave height in Bach Long Vi and Con Co
Islands increase significantly as compared
to the baseline period with an increase of
21.3% and 20.9% respectively. Wave period
increases most significantly in the middle
of the Gulf of Thailand at roughly 14.5%.
Increase in wave period in Bach Long Vi,
Con Co, Phu Quy, and Con Dao Island is
slightly lower, with values of 0.3%, 0.5%,
0.7%, 0.2% respectively.
Similar to the North-East monsoon
months, wave height during the South-East
monsoon period in the middle of the Gulf
of Thailand exhibit a decreasing trend,
contrasting the trend in the remaining areas
in the East Sea. Wave height decrease in the
area is approximately 7.6% (Table 3).
Overall, changes in wave height and
period in July in the East Sea is highly
variable yet the absolute change in wave
height in July (summer) is greater than in
January (winter) while the contrary is true for
wave period, i.e. the absolute change in wave
period in July is less than January.
There is also a degree of uncertainty in
the assessment of changes in wave regimes
in the East Sea under climate change. The
uncertainties in the study is closely related
to uncertainties in climate change scenarios
and of climate change simulation models and
wave simulation models.
92
Vietnam Journal of Science,
Technology and Engineering
Conclusion
Under RCP4.5 scenario, climate change
significantly affects the wave regime in
the East Sea, the impact is highly variable
depending on the region and the season
assessed.
In January, wave height in the East Sea
decreases on average 7% while wave period
in the East Sea decreases on average 4.4%.
Wave height and wave period decreases the
most at Bach Long Vi Island with predicted
values of 13.1% and 15.4% respectively.
In the middle of the Gulf of Thailand, the
trend of wave height change is reversed with
the trend in other regions, with an increase of
1.9% while wave period follows the similar
trend in other regions with corresponding
value of 1.7%.
In July, wave height increases on
average 11.5%, wave period increase on
average 3.3%. The region with the highest
increase in wave height as compared to the
baseline period is Cu Lao Cham Island at
approaximately 23.8%. The lowest increase
in wave height projected is in Con Dao
Island at approximately 2.6%. Wave period
increases most significantly in the middle
of the Gulf of Thailand, at approximately
14.5%, and least significantly at Con Dao
Island at 0.2%. Wave height in the middle
of the Gulf of Thailand decreases 7.6%,
contradicting the general trend in the East
Sea.
Average absolute changes of wave height
in July in the East Sea is greater than that in
January. On the contrary, average absolute
changees of wave period in July is less than
that in January.
The study provides the assessment of
climate change impacts on wave regimes in
the East Sea for January and July, the two
March 2017 • Vol.59 Number 1
time period representing winter and summer
in the region. There is a degree of uncertainty
related to the study, this mainly spurs from
the uncertainties in climate change scenario
and simulation models. Further detailed
assessment of climate change impacts on
wave regimes in the East Sea in the future
is needed.
References
[1] Seneviratne, et al. (2012), “Changes in climate
extremes and their impacts on the natural physical
environment”, A Special Report of Working Groups I and II
of the Intergovernmental Panel on Climate Change (IPCC),
Cambridge University Press, Cambridge, UK, and New
York, NY, USA, pp.109-230.
[2] D.K. Woolf, P.G. Challenor, P.D. Cotton (2002),
“Variability and predictability of the North Atlantic wave
climate”, J. Geophys. Res. Oceans, 107, C103145.
[3] J.C. Allan, and P.D. Komar (2006), “Climate
controls on US West Coast erosion processes”, J. Coast.
Res., 22, pp.511-529.
[4] P.N. Adams, D.L. Inman, N.E. Graham
(2008), “Southern California deep-water wave climate:
Characterization and application to coastal processes”, J.
Coast. Res., 24, pp.1022-1035.
[5] M. Menéndez, P.L. Woodworth (2010), “Changes
in extreme high water levels based on a quasi-global tidegauge data set”, J. Geophys. Res. Oceans, 115, C10011.
[6] C. Izaguirre, F.J. Méndez, M. Menéndez, I.J.
Losada (2011), “Global extreme wave height variability
based on satellite data”, Geophys. Res. Lett., 38, L10607.
[7] X.L. Wang, V.R. Swail (2006), “Climate change
signal and uncertainty in projections of ocean wave
heights”, Clim. Dyn., 26, pp.109-126.
[8] N. Mori, T. Shimura, T. Yasuda, H. Mase (2013),
“Multi-model climate projections of ocean surface variables
under different climate scenarios - Future change of waves,
sea level, and wind”, Ocean Eng., 71, pp.122-129.
[9] M.A. Hemer, Y. Fan, N. Mori, A. Semedo, X.L.
Wang (2013), “Projected future changes in wind-wave
climate in a multi-model ensemble”, Nature Clim. Change,
3, pp.471-476.
[10] N.E. Graham, D.R. Cayan, P. Bromirski, R. Flick
(2013), “Multi-model projections of 21st century North
Pacific winter wave climate under the IPCC A2 scenario”,
Clim. Dyn., 40, pp.1335-1360.
[11] M.A Hemer, K.L. McInnes, R. Ranasinghe
(2012), “Projections of climate change driven variations in
the offshore wave climate off southeastern Australia”, Int. J.
Climatol., 33, pp.1615-1632.
[12] IMHEN (2014), Applying Norwegian earth
system model for Climate Change scenario development
for Vietnam, monsoon and climate extreme studies, Final
Report, Hanoi.
[13] J.R. Pope, K.M. Willett, Osborn, P. Thorne (2014),
“Investigation and quality assessment of the Past Weather
Code from the integrated Surface Database”, Hadley
Centre Technical Note 97.
[14] Delft University of Technology (2014), SWAN Scientific and Technical Documentation, Environmental
Fluid Mechanics Section.
[15] Nguyen Manh Hung (2005), Wave regimes in the
East Sea, Special issue on the East Sea, Ha Noi, pp.285318.