Rainfall and temperature variability analysis of ZARS, Mandya in Karnataka, India
Bạn đang xem bản rút gọn của tài liệu. Xem và tải ngay bản đầy đủ của tài liệu tại đây (261.03 KB, 7 trang )
Int.J.Curr.Microbiol.App.Sci (2019) 8(5): 44-50
International Journal of Current Microbiology and Applied Sciences
ISSN: 2319-7706 Volume 8 Number 05 (2019)
Journal homepage:
Original Research Article
/>
Rainfall and Temperature Variability Analysis
of ZARS, Mandya in Karnataka, India
B.S. Sowmyalatha1*, K.S. Shubhashree2 and V. Thimmegowda3
1
Department of Agronomy, College of Agriculture, ZARS, V.C. Farm, Mandya-571 405,
University of Agricultural Sciences, Bengaluru, Karnataka, India
2
AICRP on Small Millets, ZARS, V.C. Farm, Mandya-571 405, University of Agricultural
Sciences, Bengaluru, Karnataka, India
3
ZARS, V.C. Farm, Mandya-571 405,University of Agricultural Sciences, Bengaluru,
Karnataka, India
*Corresponding author
ABSTRACT
Keywords
Rainfall,
Temperature,
Karnataka, Mandya,
Variability,
Monsoon, Season.
Article Info
Accepted:
04 April 2019
Available Online:
10 May 2019
No doubt the climatic aberrations will severely set back agricultural development in most
of the tropical countries particularly India, where an increasing share of the poorest and
most vulnerable population resides. Zonal Agricultural Research Station is located at
Mandya district of Karnataka lies under agro-climatic zone 6 (Southern dry zone) having
longitude of 76° 49.8' E and latitude of 12°34.3' N with 697 meters above mean sea level.
Rainfall and temperature data of 28 years (1991-2018) obtained from Agromet
observatory, Zonal Agricultural Research Station (ZARS), Mandya, University of
Agricultural Sciences, Bengaluru was analysed for variability. The mean annual rainfall of
the station is 735.9 mm distributes Pre-monsoon or summer (March-May) of 182.8 mm,
south-west monsoon (June-September)of 313.4mm, north-east monsoon (OctoberDecember) of 235.4mm and winter season (January-March) of 4.2 mm. The trend
indicated that the maximum contribution was from south west monsoon (42.59 %) and
lowest during winter (0.57 %) whereas September was the rainiest month (130.66 mm).
The standard deviation (SD) was highest (123.4) with Co-efficient of variation (CV) of
39.40 %, which indicates high variability and dependability on rainfall from S-W
monsoon. The mean monthly maximum temperature was 34.2°C and mean monthly
minimum temperature was 14.4°C. Mean annual maximum temperature was decreasing in
a linear path contrastingly and mean minimum temperature was increasing linearly over
the years. The annual rainfall variability indicates that 8 years received excess rainfall
(21.6 to 57.5 %), 12 years had normal rainfall (-4.0 to 10.4 %),2 years with slight drought
(-19.1 to -19.2 %) and 6 years of moderate drought (-29.3 to -42.6%) were recorded.
Overall analysis of rainfall and temperature shows variation in distribution and amount of
rainfall received.
productivity and sustainability in tropics
Virmani (1994). Rainfall pattern and the
quantity decide the cropping system in the
rainfed agriculture. The annual and seasonal
Introduction
Rainfall and temperature variability’s are
major factors influencing the agricultural
44
Int.J.Curr.Microbiol.App.Sci (2019) 8(5): 44-50
rainfall received and its variability directly
influences the success or failure of crop
through its favourable or adverse effect on
crop growth and yield. Therefore, the study
on variability of annual rainfall and
temperature are essential in selection of
suitable crops and to take up appropriate
mitigating measures based on rainfall
characteristics and temperature of a given
location. Similar rainfall variability analysis
was done by Mummigatti et al., (2013),
Thimme Gowda et al., (2015) and Hanuman
thappa et al., (2016). The monthly and
seasonal pattern of rainfall and temperature
may helpful in crop planning by identifying
the period of drought, normal and excess
rainfall (Ray et al., 1980). Such analysis is
helpful in prediction of annual and seasonal
rainfall probability for the next one or two
years and in turn crop planning. Hence, a
study was undertaken at Zonal Agricultural
Research Station, Mandya district, Karnataka
to understand the rainfall and temperature
variability for better agricultural planning.
SLD = Slight Drought (> -19 to -25%), MD =
Moderate Drought (-26 to -49%) SD = Severe
Drought (-50% & above) (Anonymous,
2018).
Results and Discussion
Rainfall data for the period of 28 years from
1991 – 2018 was taken and mean was worked
out to estimate the difference in rainfall
pattern (Table 1). The rainfall data was then
grouped to Southwest monsoon (Jun – Sep),
Northeast monsoon (Oct – Dec), Winter (JanFeb) and Summer (March-May).
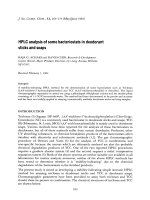
The mean annual rainfall of the station from
the past 28 years was 735.9 mm distributed as
182.8 mm during pre-monsoon or summer
season, 313.4 mm from South-West monsoon
235.4 mm from North-East monsoon and 4.2
mm during Winter season. The trend
indicated that, maximum contribution of
rainfall was from south west monsoon (42.59
%) and lowest during winter (0.57 %). High
variability and dependability of rainfall from
S-W monsoon is indicated by highest
standard deviation (SD) (123.4) with Coefficient of variation (CV) of 39.40 % (Fig.
1).
Materials and Methods
A study was taken on annual and seasonal
rainfall and temperature variability analysis of
Zonal Agricultural Research Station, which is
located at Mandya district of Karnataka and
lies under agro-climatic zone 6 (Southern dry
zone) having longitude of 76° 49.8' E and
latitude of 12°34.3' N situated at 697 meters
above mean sea level. Rainfall and
temperature data of 28 years (1991-2018) was
collected from Agromet observatory, Zonal
Agricultural Research Station (ZARS),
Mandya, University of Agricultural Sciences,
Bengaluru. The rainfall and temperature data
were collected on daily basis and analysed for
standard deviation and Co-efficient of
variance using statistical tools. Per cent
deviation of rainfall from the normal were
categorized using IMD classification viz., E=
Excess RF (>19%), N = Normal RF (± 19%),
Annual drought analysis and rainfall
variability on decadal basis of ZARS,
Mandya
The data on mean annual rainfall, coefficient
of variation, standard deviation and its
classification are given in Table 2 and 3. The
annual rainfall variability during the last 28
years (1991 to 2018) indicates that 8 years
received excess rainfall (21.6 to 57.5 %), 12
years with normal rainfall (-4.0 to 10.4 %), 2
years of slightly drought (-19.1 to -19.2 %)
and 6 years moderate drought (-29.3 to -42.6
%) were recorded. However, the annual
precipitation received in this region was
normal (Table 2).
45
Int.J.Curr.Microbiol.App.Sci (2019) 8(5): 44-50
Table.1 Seasonal rainfall pattern & variability of ZARS, Mandya (1991-2018)
Season
South west Monsoon (JuneSep)
North east Monsoon (Oct- Dec)
Winter (Jan-Feb)
Summer (March- May)
Annual (Total)
Avg. Rainfall
313.4
Per cent (%)
42.59
SD
123.4
CV (%)
39.4
235.4
4.2
182.8
735.9
32.00
0.57
24.84
119.4
7.9
94.0
203.5
50.7
186.4
51.4
27.7
SD -Standard Deviation CV-Co-efficient of variance
Table.2 Annual drought analysis of ZARS, Mandya (1991-2018)
Sl.No.
Year
1
2
3
4
5
6
7
8
9
10
11
12
13
14
15
16
17
18
19
20
21
22
23
24
25
26
27
28
1991
1992
1993
1994
1995
1996
1997
1998
1999
2000
2001
2002
2003
2004
2005
2006
2007
2008
2009
2010
2011
2012
2013
2014
2015
2016
2017
2018
Average Rainfall
(mm)
812.5
425.8
763.6
520.0
617.5
1096.5
903.7
775.0
935.2
1159.2
764.0
436.9
623.0
956.7
1021.6
512.0
630.4
706.5
779.7
752.5
791.0
422.6
595.6
951.1
594.7
485.6
895.0
676.0
% deviation from the
normal
10.4
-42.1
3.8
-29.3
-16.1
49.0
22.8
5.3
27.1
57.5
3.8
-40.6
-15.3
30.0
38.8
-30.4
-14.3
-4.0
6.0
2.3
7.5
-42.6
-19.1
29.3
-19.2
-34.0
21.6
-8.1
Situation
N
MD
N
MD
N
E
E
N
E
E
N
MD
N
E
E
MD
N
N
N
N
N
MD
SLD
E
SLD
MD
E
N
Mean = 735.9 mm, IMD Classification: E= Excess RF (>19%), N = Normal RF (± 19%), SLD = Slight Drought (> 19 to -25%), MD = Moderate Drought (-26 to -49%) SD = Severe Drought (-50% & above)
Source:
46
Int.J.Curr.Microbiol.App.Sci (2019) 8(5): 44-50
Table.3 Annual Rainfall (mm) variability from 1991to 2018on decadal basis for ZARS, Mandya
Decades
Mean
SD
CV (%)
1991-2000
598.8
739.2
123.4
2000-2010
476.2
765.4
160.7
2010-2018
534.0
750.8
140.6
SD -Standard Deviation CV-Co-efficient of variance
Table.4 Monthly rainfall variability of ZARS, Mandya
Month
Max.
Min.
Mean
SD
CV (%)
January
February
March
April
May
June
July
August
September
October
November
December
15.6
29.2
172.0
188.0
304.0
210.2
120.8
217.6
363.5
420.8
256.8
52.6
0.00
0.00
0.00
0.00
0.00
0.00
1.20
0.00
30.40
10.80
0.00
0.00
1.60
1.76
15.25
53.95
109.90
56.59
48.39
75.52
130.66
162.98
55.23
12.60
4.11
5.67
34.97
44.13
81.19
45.96
32.27
67.28
79.95
103.68
56.93
14.84
257.35
321.39
229.28
81.81
73.88
81.21
66.68
89.09
61.19
63.62
103.10
117.74
%
contribution
0.22
0.24
2.11
7.45
15.17
7.81
6.68
10.42
18.04
22.50
7.62
1.74
Max- Maximum Min-Minimum SD -Standard Deviation CV-Co-efficient of variance
Table.5 Characteristics of monthly maximum temperature from 1991-2018 (28 years) at ZARS,
Mandya
Month
January
February
March
April
May
June
July
August
September
October
November
December
Max.
31.7
38.0
37.0
37.0
36.9
32.7
31.5
38.0
33.3
34.5
30.2
29.0
Min.
27.5
29.0
30.0
31.5
29.9
28.3
27.3
27.1
27.7
26.7
27.1
26.8
Mean
29.5
31.7
33.4
34.2
33.3
30.7
29.4
29.7
29.8
29.8
29.4
28.7
SD
1.2
1.8
1.6
1.4
1.7
1.2
1.1
2.1
1.1
1.6
1.5
1.5
Max- Maximum Min-Minimum SD -Standard Deviation CV-Co-efficient of variance
47
CV (%)
4.1
5.7
4.9
4.2
5.2
3.9
3.8
6.9
3.6
5.3
5.3
5.3
Int.J.Curr.Microbiol.App.Sci (2019) 8(5): 44-50
Table.6 Characteristics of monthly minimum temperature
from 1991-2018 (28 years) at ZARS, Mandya
Month
January
February
March
April
May
June
July
August
September
October
November
December
Max.
20.6
21.1
21.3
29.9
22.3
22.8
21.1
21.1
22.4
21.2
19.1
16.7
Min.
12.3
11.0
14.0
16.4
16.5
17.3
16.8
15.8
18.0
17.3
15.3
12.2
Mean
14.4
15.9
18.3
21.0
20.4
20.1
19.6
19.6
19.7
19.4
17.9
15.7
SD
1.7
1.9
1.7
2.2
1.3
1.1
1.1
1.1
0.9
0.9
1.5
2.1
CV (%)
11.9
11.7
9.1
10.6
6.4
5.3
5.4
5.6
4.4
4.6
8.3
13.6
Max- Maximum Min-Minimum SD-Standard Deviation CV-Co-efficient of variance
Fig.1 Seasonwise rainfall (mm) over the period of 28 years (1991-2018)
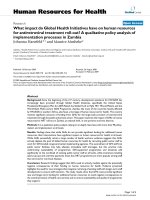
Fig.2 Rainfall trend at ZARS, Mandya (1991-2018)
48
Int.J.Curr.Microbiol.App.Sci (2019) 8(5): 44-50
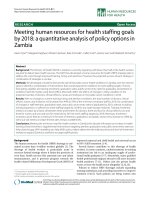
Fig.3 Characteristics of monthly maximum and minimum temperature of ZARS, Mandya
The decadal analysis (Table 3) indicated that
over three decades, the average rainfall
received was fluctuating and coefficient of
variation was also varying. The highest
average rainfall of 598.8mm was received
during 1991-2000 and lowest 476.2 mm
during 2000-2010.
monthly maximum temperature over 28 years
revealed that during summer season (March
to May) maximum temperature ranged from
33.3 to 34.2 °C, whereas in kharif season
(June to September) it was 29.4 to 30.7°C and
in Rabi season (October to February) it varied
between 28.7 to 31.7°C. Higher standard
deviation and co-efficient of variation of 1.7
and 5.2 per cent was observed during the
month of May in summer season, 2.1 and 6.9
per cent during August in Kharif and 1.8 and
5.7 per cent in winter (February),
respectively.
Monthly rainfall variability
The mean annual rainfall of ZARS was found
to be 735.9 mm over the past twenty eight
years. Mean monthly rainfall varied from 1.60
mm (lowest in January) to 162.98 mm
(highest in October) (Table 4 and depicted in
Fig. 2). The overall variability analysis of
rainfall revealed that receipt of rainfall during
the first three months (January to March) was
less than 2.57 %. In the subsequent months
April and May rainfall increased gradually to
22.62 % whereas from June to October it
reached maximum of 65.45%. Similar results
were observed from the findings of Tupe et
al., 2010 and Singh et al., 2009.
Monthly minimum temperature
The mean minimum temperature variability is
presented in table 6 and depicted in Figure 3.
During summer season (March to May) mean
monthly minimum temperature ranged from
18.3 to 21.0 °C, whereas in kharif season
(June to September) it was 19.6 to 20.1°C and
in Rabi season (October to February) it varied
between 14.4 to 19.4°C. Higher standard
deviation and co-efficient of variation of 2.2
and 10.6 per cent was observed during the
month of April in summer season, 1.1 and 5.6
per cent during August in Kharif and 2.1 and
13.6 per cent in winter (December),
respectively.
Monthly maximum temperature
The overall variability of mean maximum
temperature is presented in table 5 and
depicted in Figure 3. The data on mean
49
Int.J.Curr.Microbiol.App.Sci (2019) 8(5): 44-50
In conclusion, the above study clearly
indicates that significant variability in rainfall
and temperature was noticed. The mean
annual rainfall of 735.9 mm was received
with maximum contribution from south west
monsoon and lowest during winter. The
highest standard deviation (SD) with lowest
Co-efficient of variation (CV) indicates high
variability and dependability on rainfall from
S-W monsoon. The annual rainfall variability
during the last 28 years (1991 to 2018)
indicates that 8 years received excess rainfall,
12 years with normal rainfall; 2 years of
slightly drought and 6 years moderate drought
were recorded. However, the annual
precipitation receipt in this region was
normal. Summer season recorded maximum
temperature followed by Kharif and Rabi
season.
Life Sciences. 5(21): 9655-9658.
Ray, C.R., Senapati, P.C., and Lal, R., 1980.
Rainfall analysis for crop planning at
Gopalpur,
Orissa.
Journal
of
Agriculture Enggneering. Pp. 384.
Singh, P.K., Lathore, L.S., Singh, K. K. and
Baxla,
A.
K.,
2009.Rainfall
characteristics of North West alluvial
plains
of
Bihar.
Journal
of
Agrometerology.11(1): 37-41.
ThimmeGowda, P., Shruthi, G. K.,
Yogananda, S. B., 2015. Rainfall
Trend Analysis of Mandya District in
Karnataka. International Journal of
Recent Research in Interdisciplinary
Sciences (IJRRIS). 2(2): 16-20.
Tupe, A.R., Wanjari, S.S., and Bhale, V. M.,
2010. Rainfall variability analysis for
crop planning at Akola. In: Agro
meteorological Services for farmers,
ed. Vyas Pandey, Anand Agriculture
University Anand. Pp. 46-50.
Mummigatti, U.V., Naveen, N.E. and
Ninganur, B.T. 2013. Rainfall and
rainy day trends at Dharwad,
Karnataka. International Journal of
Agricultural Sciences. 9(1): 237-241.
Virmani, S.M., 1994. Climate resource
characterization in stressed tropical
environment.
Constraints
and
opportunities
for
sustainable
agriculture. In: Stressed ecosystem and
sustainable agriculture. Oxford and
IBA publishing Co. (P) Ltd., New
Delhi, India. pp. 149-160.
Acknowledgement
Authors are thankful to ZARS, V.C. Farm,
Mandya, University of Agricultural Sciences,
Bengaluru, 560065, Karnataka, India.
References
Anonymous, 2018.
Hanumanthappa, M., Ranjith, T.H., Sridhara,
S., Nagraj, R., Dhanjaya, B. and
Sudhirkamath,
K.
V.,
2016.
Variability Analysis of Rainfall and
Temperature on Growth and Yield of
Different Kharif Crops at Udupi
District of Karnataka. Advances in
How to cite this article:
Sowmyalatha, B.S., K.S. Shubhashree and Thimmegowda, V. 2019. Rainfall and Temperature
Variability Analysis of ZARS, Mandya in Karnataka. Int.J.Curr.Microbiol.App.Sci. 8(05): 4450. doi: />
50