Cathodoluminescence, fluid inclusions, and trace element data for the syntaxial quartz cementation in the sandstones of the Ora Formation, northern Iraq
Bạn đang xem bản rút gọn của tài liệu. Xem và tải ngay bản đầy đủ của tài liệu tại đây (11.89 MB, 27 trang )
Turkish Journal of Earth Sciences
Turkish J Earth Sci
(2018) 27: 205-231
© TÜBİTAK
doi:10.3906/yer-1707-5
/>
Research Article
Cathodoluminescence, fluid inclusions, and trace element data for the syntaxial quartz
cementation in the sandstones of the Ora Formation, northern Iraq
1,2,
1
3
Muhamed F. OMER *, Henrik FRIIS
Department of Geology, College of Science, Salahaddin University, Erbil, Iraq
2
Faculty of Geology, Warsaw University, Warsaw, Poland
3
Department of Geoscience, Aarhus University, Aarhus, Denmark
Received: 09.07.2017
Accepted/Published Online: 25.12.2017
Final Version: 17.05.2018
Abstract: Quartz cements of the quartz arenitic sandstones from the Chalky Nasara and Ora sections of the (Devonian-Carboniferous)
Ora Formation in northern Iraq have been studied. A combination of hot cathodoluminescence, LA-ICP-MS, and fluid inclusion
microthermometry revealed three syntaxial quartz cement generations (Q1, Q2, and Q3). The early Q1 cementation has gray to slightly
brown luminescences, postdated compaction, and reduced intergranular porosity associated with illite formed during eogenesis. Q2 is
characterized by dark brown luminescence overgrowths and is more voluminous in the thinly bedded sandstones than in the thickly
bedded sandstones filling most of the remaining pore space during mesogenesis. Q3 was formed during the early telogenesis stage fully
cementing the sandstones and the fractures were filled by hydrothermal chlorite and sulfides. Significant amounts of trace elements Al,
Li, Ge, and Fe have been detected in quartz overgrowths. Al varies consistently between each cement with averages of 7125, 4044, and
2036 ppm for the Q1, Q2, and Q3 generations, respectively. A strong linear correlation between Al and Li in the three quartz cements
with an average Li/Al of ~0.02 in Q1 and Q2 indicates sufficient availability of both Al and Li where Li is most likely to be found in highsaline pore waters. Illite is the most probable origin of Li since high salinities favor the mobilization of Li during diagenesis. Germanium
concentrations in quartz cements are slightly less than that in the detrital quartz of the Ora Formation, indicating that the pressure
dissolutions of quartz and feldspar are the dominant sources of cementation in the Ora Formation. Homogenization temperatures of
fluid inclusions indicate precipitation of the Q1, Q2, and Q3 cement generations at temperature ranges of 155–160 °C, 160–166 °C,
and 168–178 °C, respectively, with salinities ranging between 5.0 and 6.4 wt.% NaCl equiv., as an indication of hydrothermal burial
conditions for Q3 cement, which was affected by the major Zagros Thrust Zone faulting.
Key words: Quartz cement generations, cathodoluminescence, trace elements, fluid inclusions, Ora Formation, northern Iraq
1. Introduction
Sandstones have been the target of a large number of
studies because of their capability to become reservoirs
for water and hydrocarbon (Marchand et al., 2002;
Molenaar et al., 2008; Taylor et al., 2010). The evaluation
of reservoir properties in deeply buried sandstones
requires understanding the process and distribution of
authigenically formed quartz, which has an important
impact on the reduction of porosity and permeability of
sandstones (Worden and Morad, 2000; Molenaar et al.,
2007, 2008; Tamer-Agha, 2009). Important aspects are the
estimation of formation temperatures of different phases
of quartz cementation and their possible silica sources.
Techniques for estimating the formation temperature of
diagenetic quartz include oxygen isotope measurements
by means of ion microprobe (Rezaee and Tingate, 1997;
Hiatt et al., 2007; Kelly et al., 2007) and fluid inclusion
*Correspondence:
studies (Roedder, 1984; Demars, et al., 1996; Kraishan et
al., 2000). The rate of quartz cementation as a function of
time, temperature, and the nature of the quartz surface can
also be deduced from such studies (Walderhaug, 1994).
Successive phases of quartz cementation and their possible
silica sources may partly be revealed by trace element
analyses of the quartz cement.
The most significant trace elements incorporated
in authigenic and hydrothermal quartz grown at low
temperatures are Al, Li, Na, and Ge (<300 °C; Bambauer,
1961; Lehmann et al., 2011; Götte et al., 2011, 2013). The
Al content is believed to be related to the diagenesis of
feldspars (Kraishan et al., 2000; Weber and Ricken, 2005).
According to Lehmann et al. (2011), Ge is considered a
proxy element for the silica source while the Al content is
linked to the evolution of the pore water. Ge is considered
to be a proxy element for the silica source and the Al
205
OMER and FRIIS / Turkish J Earth Sci
content is linked to the evolution of the pore water
(Lehmann et al., 2011). Enrichment in Li may indicate
transformation of clay minerals since they are the most
important source of Li (Williams and Hervig, 2005). The
cathodoluminescence (CL) of quartz strongly depends on
the trace element distribution (Demars et al., 1996) and
therefore may contribute to the understanding of various
silica sources.
The Ora Formation (Upper Devonian-Carboniferous)
has been subjected to a complicated geological evolution
in terms of successive phases of burial, oogenesis, and
uplift. The purpose of this study is to clarify the successive
lithification of the Ora Formation during this evolution
with emphasis on the development of quartz cement and
identification of the related silica sources.
2. Geological setting and Late Paleozoic evolution
The siliciclastic Paleozoic successions of the Ora
Formation were first recognized in the Northern Thrust
Zone of northern Iraq, close to the Iraq–Turkey border, by
Wetzel and Morten in 1952 (in Bellen et al., 1959) (Figure
1). The geological development of Iraq is controlled by
its position within the main tectonic units of the Middle
Eastern region, i.e. between the Arabian part of the African
Platform (Nubio-Arabian) and the Asian branches of the
Alpine Tectonic Belt.
Northern and northeastern Iraq is a part of the
extensive Alpine-Himalyan Orogenic Belt in the Near East,
represented by the Taurus-Zagros Mountain Belt, which
was developed as a result of collision between the AfroArabian and Eurasian plates (Sharland et al., 2001). The
Zagros Mountain Belt as part of the Alpine-Himalayan
mountain chain is a well-defined asymmetric mountain
belt (Alavi, 1994). The northwestern boundary of the
Zagros Mountain Belt is chosen to be the East Anatolian
Fault (EAF in Figure 2) in southeastern Turkey. This fault
separates the Zagros from the Eastern Taurides of Turkey
and offsets the two mountain belts left-laterally for ~300
km. The Zagros Mountain Belt consists of three tectonic
zones, the Urumieh-Dokhtar Magmatic Assemblage;
the Zagros Imbricate Zone, which includes both the
Sanandaj-Sirjan Zone and the Zagros Thrust Zone of
Stocklin (1968, 1974); and the Zagros Fold-Thrust Belt
(Figure 2). The boundary between the Sanandaj-Sirjan
Zone of Stocklin and his Zagros Thrust Zone (referred to
as the “Main Zagros Thrust”) has been regarded by many
researchers as the suture between the Afro-Arabian and
Iranian plates (Takin, 1972; Hessami et al., 2001; Talebian
and Jackson, 2004). This zone includes folded and
thrusted sediment from the former northeastern passive
continental margin of the Afro-Arabian continent.
Following this interpretation, the northeastern boundary
of the Zagros Imbricate Zone, where the magmatic
assemblage is juxtaposed against the Zagros Imbricate
Zone, is considered to be suture zone between the AfroArabian and Iranian plates (ZS in Figure 2). According to
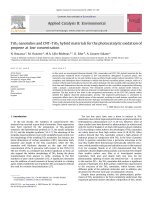
Figure 1. Geological map of northern Iraq showing the location of the studied clastic rocks in the Ora Formation and other Paleozoic
rocks (modified after Sissakian, 2000) (a). Columnar sections of the Ora Formation in two outcrop sections, Chalky Nasara and Ora
sections, with locations of selected samples (b).
206
OMER and FRIIS / Turkish J Earth Sci
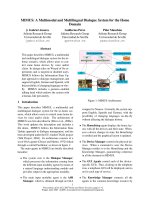
Figure 2. Subdivisions of the Zagros Orogenic Belt. AD- Arak Depression; DR- Dezful Recess; EAF- East Anatolian Fault; FS- Fars Salient;
GKD- Gav Khooni Depression; KR- Karkuk Recess; LS- Lorestan Salient; MAC- Makran Accretionary Complex; MFF- Mountain Front
Flexure; MZT- Main Zagros Thrust; OL- Oman Line; PTC-CCS- Paleo-Tethyan Continent-Continent Collisional Suture; SD- Sirjan
Depression; SRRB- Saveh-Rafsanjan Retroforeland Basin; SSZ- Sanandaj-Sirjan Zone; ZTZ- Zagros Thrust Zone; UDMA- UrumiehDokhtar Magmatic Assemblage; ZDF- Zagros Deformational Front; ZFTB- Zagros Fold-Thrust Belt; ZIZ- Zagros Imbricate Zone; ZSZagros Suture. Hydrocarbon fields of the region, oil in green and gas in red, are shown (Alavi, 2007).
Alavi (2004, 2007), the currently two studied sections (A
and B) of the Ora Formation are situated within Zagros
Imbricate Zone (Figure 2).
The Hercynian orogeny was initiated in the Late
Devonian and resulted in regional uplift in northern
Gondwana. The Arabian plate was tilted eastward, which
resulted in erosion of a thick succession of Devonian and
older deposits and the development of a regional hiatus,
which was called the Hercynian Unconformity or the
Middle Paleozoic Hiatus (Al-Hadidy, 2007).
The Arabian plate was rotated through 90° in an
anticlockwise direction and the northeastern Gondwana
margin transformed from a passive to an active margin
(McGillivray and Husseini, 1992). The Late Devonian-
Early Carboniferous was a period of extension and
compression with Hercynian back-arc rifting, inversion,
and uplift. Chalki volcanics of North Iraq are formed in
a back-arc setting behind the Paleo-Tethyan subduction
zone (Sharland et al., 2001) (Figure 3). Although they are
presently undated and could belong to Late Devonian
periods (Jassim and Goff, 2006), a Hercynian age is
supported by the occurrence of Devonian-Carboniferous
volcanics and metamorphism found in the SanandajSirjan Zone along the southern margin of the Paleo-Tethys
(Davoudzadeh and Weber-Diefenbach, 1987) (Figure 3).
A geochemical investigation of Chalki rocks in northern
Iraq proposed a magmatic evolution of basaltic rocks in a
mafic tholeiitic suite (Ali et al., 2016).
207
OMER and FRIIS / Turkish J Earth Sci
Figure 3. Schematic plate reconstruction and cross-section for megasequence AP4 (Devonian-Carboniferous) (Sharland et al., 2001).
208
OMER and FRIIS / Turkish J Earth Sci
The Paleozoic sedimentary sequences consist of
three characteristic major sedimentary cycles dominated
by siliciclastic or mixed siliciclastic-carbonate units
(Buday, 1980; Table 1). These units are separated by
major unconformities, indicating mainly the effects of
the Caledonian and Hercynian Orogens. The Ordovician
Khabour Formation is the oldest unit exposed in northern
Iraq (Bellen et al., 1959) (Figure 1); the age is based on three
Cruziana ichnotaxa, Fucifera isp., Goldfussi isp., and Rugosa
isp. These three ichnotaxa are considered index fossils
for the Upper Tremadocian Stage (Lower Ordovician)
(Omer, 2012). In western Iraq, the Khabour Formation is
overlain by the Silurian Akkas Formation, which is only
known from wells; the entire Silurian and Early Devonian
succession is missing in outcrop sections of northern Iraq.
Here, the Khabour Formation is unconformably overlain
by the Late Devonian to Early Carboniferous depositional
cycle represented by the Pirispiki, Chalki, Kaista, Ora, and
Harur formations (Table 1). The uppermost depositional
cycle is Late Permian in age and comprises the Chia Zairi
Formation (Figure 1a).
According to Jassim and Goff (2006), the upper part
of the Kaista Formation is now included in the Ora
Formation and the name Ora Shale has been changed to
Ora Formation (Figure 1a). Behnam (2013) studied the
sedimentological features of the Ora Formation and divided
the Ora sequence into two units according to differences
in lithology and a proposed subtidal environment for
the lower part while tidal channel and intertidal flat
environments were proposed for the upper part of the
Ora Formation. This consists of repeated fining-upwards
cycles of thin- to medium-bedded sandstones interbedded
with thin-bedded shale (Figure 1b). Palynological
investigation of the Paleozoic succession revealed that the
Ora Formation is of Late Devonian-Early Carboniferous
age (Barzinjy, 2006; Aqrawi et al., 2010).
3. Materials and methods
A total of 32 fresh samples were collected from thin- to
medium-bedded sandstones of the Chalky Nasara section
(37°17′551″N, 43°09′904″E), in the core of the Chiazinar
fold where Paleozoic formations are successively well
exposed, and 15 samples were obtained from the
measured section of the Ora section (37°16′579″N,
43°21′891″E) (Figure 1b). These sections were selected
because of their accessibility and good exposures. Fortyfive thin sections from both sequences were polished
for investigation under a standard Nikon Eclipse LV 100
POL petrographic microscope with automatic stage and
petrographic examination to determine textures and
mineral identification. The point-counting method of
Ingersoll and Suczek (1979) was employed for quantitative
compositional analysis of the framework grains (Table
2). Scanning electron microscopy (SEM) was performed
using an ∑│GMA™│VP- ZEISS with EDX BRUCKER
X Flash 6/10. The microscope was operated at 20 kV
electron acceleration voltage, using and AsB® detector
and backscattered electron (SEM-BSE) modes. X-ray
diffraction analysis was performed using a Philips PW3710
diffractometer (Cu Kα radiation, 35 kV, 28.5 mA). All these
studies were performed at Warsaw University, Poland.
Twenty samples were studied with hot cathode
microscope HC1-LM at the Institute of Paleobiology,
Polish Academy of Sciences, for visual and spectroscopic
CL analyses (Neuser et al., 1996). The cathode microscope
was connected to a triple-grating spectrograph of EG &
G Princeton Research Instruments for recording the highresolution spectra. The spatial resolution of spectroscopic
analyses was about 30 mm. Electron energy of 14 kV and
a beam current density of 0.1 µA mm2 were used for both
CL microscopy and spectroscopy.
Trace elements in quartz cement phases were analyzed
by means of laser ablation inductively-coupled mass
Table 1. Three cycles of Paleozoic sedimentary sequences in Iraq by
Buday (1980).
209
OMER and FRIIS / Turkish J Earth Sci
Table 2. Modal compositions of Devonian-Carboniferous sandstones from the Ora Formation.
Cha.
Quartz
Mica
Cements
Porosity
samp.
Qm
Qp
K
P
R.F.
Mat
Mu
Ch
Bio
Sil
Cl
Ca
Fer
HM
Pyr
PP
SP
TPC
1
54.5
5.7
2.6
1.9
3.0
1.1
5.4
3.8
1.5
11.3
3.4
0.4
0.6
1.8
1.4
0.4
1.0
364
3
59.0
6.5
0.5
1.8
0.5
1.0
1.7
2.0
0.1
16.5
3.5
0.0
0.5
3.5
0.3
0.8
2.3
318
4
51.9
5.7
1.5
1.0
5.7
1.2
4.3
2.8
2.9
9.9
5.0
1.0
1.3
1.2
1.0
0.7
2.5
322
8
53.8
6.3
1.3
1.0
5.9
1.8
2.5
2.0
1.7
11.3
5.9
0.0
1.2
1.1
1.9
0.5
1.6
303
9
54.4
5.9
3.9
1.3
1.3
1.6
2.1
1.7
2.0
9.6
5.9
0.0
1.1
1.3
2.5
1.3
3.5
394
10
56.6
7.3
2.0
1.1
1.0
1.6
2.5
1.3
2.7
11.2
4.0
0.9
2.1
1.8
1.2
1.0
1.5
341
12
59.0
4.4
1.9
0.8
0.5
1.2
2.0
1.1
0.2
16.9
5.0
0.0
0.7
3.2
0.1
2.0
1.0
389
14
55.7
6.5
3.1
0.7
0.9
1.0
1.9
1.4
1.6
12.2
5.5
0.0
1.3
2.2
1.5
1.1
2.9
322
15
57.5
4.0
2.5
0.9
0.7
0.7
1.3
0.6
1.0
15.0
5.1
0.8
1.2
2.7
1.5
1.5
2.4
391
16
60.0
6.1
1.9
0.3
0.9
0.2
1.7
0.2
0.2
15.1
5.7
0.2
1.9
2.1
0.4
0.9
2.2
312
17
59.2
5.7
1.6
0.3
1.2
1.1
1.9
0.7
1.4
13.9
5.2
0.4
1.8
2.2
0.1
1.0
1.7
397
18
60.7
4.2
1.5
1.0
0.5
1.1
1.3
1.0
1.2
16.0
4.3
0.0
1.6
2.0
0.0
2.2
0.9
304
21
62.3
6.0
1.2
0.6
0.2
0.9
2.2
1.0
1.3
14.2
4.0
0.0
1.1
1.7
1.0
2.0
0.5
356
22
59.7
5.2
1.6
0.2
1.0
0.8
2.0
0.8
1.2
15.1
5.8
0.2
1.3
1.2
1.2
1.7
1.0
331
25
58.4
5.9
1.1
0.3
0.8
0.3
1.7
0.2
0.8
18.3
5.2
0.0
0.9
1.8
0.6
0.8
2.8
357
27
60.4
6.7
1.0
0.4
0.6
0.8
1.6
1.0
1.3
14.0
4.7
0.1
1.6
2.5
0.4
1.3
1.5
337
28
61.7
6.1
1.2
0.2
0.3
0.7
1.7
0.3
0.6
14.7
5.5
0.0
1.3
2.3
0.3
1.3
1.8
355
30
60.1
4.7
1.0
0.5
0.2
1.0
1.6
1.0
1.8
16.7
5.2
0.4
1.3
1.0
0.4
1.1
2.0
340
32
62.0
5.8
0.6
0.2
0.2
0.9
2.2
1.0
1.3
14.2
4.5
0.0
0.8
2.7
1.0
0.9
2.1
359
Range
51.9– 4.0–
0.5–
0.2–
0.2–
0.2–
1.3–
0.2–
0.1–
9.6–
3.4–
0.0– 0.5–
1.0–
0.0–
0.4–
0.5–
62.3
7.3
3.9
1.9
5.8
1.8
5.4
3.8
2.9
18.3
5.9
1.0
2.1
3.5
2.5
2.2
3.5
58.3
5.7
1.7
0.8
1.3
1.0
2.2
1.3
1.3
14.0
4.9
0.2
1.2
2.0
0.8
1.2
1.8
Porosity
Mean
Ora
Quartz
Mica
Cements
samp.
Qm
Qp
K
P
R.F.
Mat
Mu
Ch
Bio
Sil
Cl
Ca
Fer
HM
Pyr
PP
SP
TPC
2
58.5
5.7
1.1
0.2
0.3
1.1
1.7
1.0
0.9
14.3
6.3
0.3
1.3
2.9
0.9
4.0
2.1
332
3
52.2
5.9
1.5
0.3
6.9
1.4
2.3
1.9
1.5
12.2
5.7
0.0
1.9
1.3
1.6
0.6
2.9
335
4
62.6
5.6
1.4
0.2
0.9
0.4
1.1
0.5
0.2
13.8
5.9
0.2
1.8
2.2
0.5
0.9
2.2
363
7
53.0
6.3
5.6
2.0
1.3
1.0
2.0
1.8
2.0
11.4
6.2
0.0
2.4
1.8
1.0
0.4
1.8
383
8
62.0
4.7
1.0
0.4
1.0
0.8
1.6
1.0
1.8
13.6
5.2
0.4
1.3
1.4
0.4
1.1
2.0
385
9
60.9
5.4
0.9
1.0
0.5
1.0
3.2
0.9
1.1
12.6
5.1
0.8
0.9
2.0
1.0
0.6
1.8
326
11
59.3
6.3
1.1
0.9
1.0
1.6
2.3
1.2
1.7
12.6
6.8
0.2
0.0
1.3
1.3
0.8
1.5
379
13
59.5
5.9
1.8
0.3
0.9
1.1
1.9
0.7
1.4
13.9
4.3
0.6
2.0
1.6
0.0
1.5
1.7
371
14
62.4
4.3
1.5
0.3
0.7
1.0
1.6
0.8
0.9
13.2
5.7
0.0
1.6
2.4
0.4
1.3
1.9
366
15
62.1
5.8
1.2
0.6
0.7
1.1
2.3
0.6
1.1
12.8
4.9
0.0
1.8
1.4
0.3
1.3
1.6
359
Range
52.2– 4.3–
0.9–
0.2–
0.3–
0.4–
1.1–
0.5–
0.2–
11.4– 4.3–
0.0–
0.0–
1.3–
0.0–
0.4–
1.5–
62.6
6.3
5.6
2.0
6.9
1.6
3.2
1.9
2.0
14.3
6.8
0.8
2.4
2.9
1.6
4.0
2.9
59.3
5.6
1.7
0.6
1.4
1.0
2.0
1.0
1.3
13.0
5.6
0.3
1.5
1.8
0.7
0.9
2.0
Mean
Cha: Chalky Nasara section; Ora: Ora section; Samp.: Sample number; Qm: Monocrystalline quartz; Qp: Polycrystalline quartz;
K: Potash feldspar; P: Plagioclase feldspar; R.F.: Rock fragment; Mat: Matrix; Mu: Muscovite; Ch: Chlorite; Si: Silica cement;
Cl: Clay cement; Ca: Calcite cement; Fe: Ferruginous; HM: Heavy minerals; Pyr: Pyrite;PP: Primary porosity; SP: Secondary porosity;
TPC: Total point counts.
210
OMER and FRIIS / Turkish J Earth Sci
spectroscopy (LA-ICP-MS) at the Institute of Geosciences,
Goethe University, Frankfurt, Germany. The Thermo
Scientific ELEMENT 2 mass-spectrometer was combined
with an ArF excimer laser (Resonetics M50). Pit sizes
of the laser measurements were commonly 24 µm but
never exceed 32 µm because of the limited size of the
quartz cements. The NIST 612 standard glass was taken
as reference material whereas 29Si was used for the internal
standardization of the isotopes 7Li, 11B, 23Na, 27Al, 39K,
48
Ti, 55Mn, 57Fe, and 74Ge. A hydrothermal quartz
crystal, Gig 1b (Götte et al., 2011), was measured as a
mean of accuracy and reproducibility. The long-term
reproducibility was about 3% and the detection limits were
between 0.5 and 1.5 µmol mol–1 (ppt–ppb).
Microthermometric measurements on fluid inclusions
were performed at Panterra Geo-Consultants in the
Netherlands. Double-polished, uncovered wafers (~80–
100 µm) were prepared for 3 sandstone samples of the
Ora Formation. During wafer preparation, overheating
was avoided and the temperature was kept below 50
°C. These wafers were initially studied with standard
polarized light microscopy to identify areas with
common quartz overgrowths. For the current study, an
Olympus microscope with magnification range between
4× and 50× with a CCD camera attached was used.
Microthermometric measurements on both primary and
secondary inclusions were studied. The temperature of
homogenization of vapor phase into liquid phase (Th) of
aqueous inclusions was measured. Fluid inclusions were
microthermometrically studied using a Linkam THMSG
600 heating-cooling stage. Calibration of the stage at
374.1 °C was performed by measuring phase changes
in synthetic fluid inclusions of known composition
(synthetic pure water). Reproducibility of the final melting
temperature of ice (Tmice) was within ±0.2 °C and that of
the homogenization temperature (Th) was within ±2 °C.
CL analyses were performed on the same wafers after the
standard petrography observations. CL imaging was used
in order to determine with higher accuracy the target
quartz cement phases. CL was carried out using a CITL
Cathodoluminoscope Mk5-1. The following working
conditions were used: ~18–19 kV and 350–450 µA.
4. Results
4.1. Composition of sandstones
The point-counted composition of the sandstones of the
Ora Formation in the two studied sections is presented in
Table 2. Quartz is the predominant detrital component and
is dominated by monocrystalline quartz. The proportion
of monocrystalline quartz (Qm) ranges from 51.9% to
62.3% and from 52.2% to 62.6% in the Chalky Nasara and
Ora sections, respectively (Table 2). Their grain size varies
between fine- to medium-grained and sorted to well-sorted,
rounded to well-rounded, and less commonly subangular
to angular (Figure 4a). In fine-grained sandstones it ranges
from ~0.14 mm to 0.23 mm and is rounded in shape,
while in medium-grained sandstones, the monocrystalline
quartz ranges in size from ~0.27 mm to 0.33 mm. All types
of grain contacts, including long, concave-convex, suture
contacts and less commonly point contacts, are present
(Figures 4b and 4c). Monocrystalline quartz grains (Qm)
occur with nonundulose, slightly undulose (< 5°), and
undulose (˃ 5°) extinction according to the terminology
of Scholle (1979), Basu (1985), and Tortosa et al. (1991).
Most of them show slight undulose extinction (Figure
4b). Polycrystalline quartz (Qp) is mainly composed of
three or more crystals per grain, with straight to undulose
extinction. Some polycrystalline quartz grains have
sutured internal boundaries between composite crystals as
an indication of early-stage development of metamorphic
polycrystalline quartz in the source area.
Thin-bedded
sandstones
consist
of
>90%
monocrystalline quartz grains and are classified as
texturally supermature quartz arenites; the thick-bedded
sandstones contain 84% mainly monocrystalline quartz
and are texturally immature (Omer, 2015).
All studied thin sections contain lower amounts of
feldspar than quartz grains. The average grain size of
feldspars ranges between 0.09 mm and 0.20 mm. K-feldspar
is mostly fresh (orthoclase, microcline, and microperthite;
Figure 4d) and is more abundant than plagioclase in both
sections, ranging in abundance from 0.5% to 3.9% in the
Chalky Nasara section and from 0.9% to 5.6% in the Ora
section (Table 2). It displays blue luminescence in CL,
while that of rare plagioclase (albite-oligoclase) is green.
Some orthoclase and plagioclase grains show alteration to
kaolinite and sericite, respectively (Figure 4e). Omer (2015)
suggested a multiple origin of feldspar in the sandstones of
the Ora Formation as plutonic and metamorphic origin.
Lithic grains are silt-sized and mainly composed
of microcrystalline aggregates of crushed muscovite,
carbonate rock fragments, and less abundant metamorphic
rock fragments. The average content of lithic grains is 1.3%
in the Chalky Nasara and 1.4% in the Ora section.
Mica is dominated by muscovite and occasionally
biotite. It is dominated by elongate muscovite flakes, which
were often bucked and bent around hard detrital grains
(Figure 4f). The proportion of muscovite ranges from
1.3% to 5.4% and 1.1% to 3.2% in the Chalky Nasara and
Ora sections, respectively (Table 2). Random bioclasts,
dominantly calcareous bivalve shells, are also noticed in
these sandstones.
Heavy minerals form minor amounts (˂2.5%) of
the sandstones in the two studied sections. The most
common is zircon, which occurs as well-rounded grains.
211
OMER and FRIIS / Turkish J Earth Sci
Figure 4. Photomicrographs showing framework grains in the sandstones of the Ora Formation under cross-polarized light (XPL).
(a) Packed and rounded grains of monocrystalline quartz arenite sandstones with moderately open framework suggesting early,
precompaction cementation. The dust-line allows the overgrowth proportion to be estimated (Chalky Nasara section, sample 3). (b)
Long contact (red arrow) between monocrystalline quartz grains showing slightly undulose extinction (U) and concave-convex (black
arrow) (Ora section, sample 9). (c) Compound grains with outlines of detrital quartz developed by welding of quartz overgrowth
cements, forming interlocking crystalline aggregates with interpenetration texture with triple grain junctions (straight “Y” and “T”
shapes). Pressure solution and suture contacts between detrital quartz grains (red arrow) (Chalky Nasara section, sample 25). (d)
Microcline grain with tartan twinning and present slight overgrowths on the uppermost right margin (red arrow) (Chalky Nasara
section, sample 9). (e) Early process of alteration feldspar to sericite (red arrow) (Ora section, sample 11). (f) Immature sublitharenite
sandstones rich in muscovite flakes oriented and parallel to the detrital quartz grains, proof of low mechanical compaction process (Ora
section, sample 3).
Other heavy minerals observed in thin sections include
tourmaline, rutile, epidote, and staurolite. According to
the classification of Folk et al. (1970), the sandstones of
212
the Ora Formation are classified as supermature quartz
arenite, as well as subarkose and immature sublitharenite
(Omer, 2015).
OMER and FRIIS / Turkish J Earth Sci
4.2. Diagenetic paragenesis
The sandstones show signs of different diagenetic
alterations including mechanical compaction, pressure
solution, authigenic mineral formation, dissolution, and
albitization of feldspars. These processes have taken place
in three stages: marine eogenesis, meteoric mesogenesis,
and telogenesis (Figure 5).
Quartz cement is the most important cement and
makes up 9.6%–18.3% (Table 2). Three phases of quartz
cement growth have been recorded by hot CL studies and
the quartz cement is described in Section 4.3.
The earliest stage of paragenesis starts with both
mechanical compaction and the formation of pyrite
framboids in the two sections (Figure 5). The mechanical
Figure 5. Sketch of the diagenetic history of the sandstones of the Ora Formation (Devonian-Carboniferous) (top:
sandstones of Ora section; bottom: sandstones of Chalky Nasara section). The thickness of the lines refers to the
predominant or accessory occurrences in the diagenetic minerals assemblages.
213
OMER and FRIIS / Turkish J Earth Sci
compaction is evident from the kink folds of mica
minerals and disaggregation of rock fragments (Figure
6a) and the pyrite occurs in small proportions with a
maximum of 2.5% (Table 2) (Figures 6b, 6c, and 6d).
Calcite occurs in very small amounts (up to 1%; Table 2).
The small amount is partly a result of later dissolution,
and we could not estimate the ordinal amount of calcite.
The dissolution of calcite contributed to the secondary
porosity (up to 3.5%; Table 2). It was not possible to
estimate how large a proportion of secondary porosity
derived from dissolution of calcite and how much derived
from dissolution of the other minerals, mainly feldspar
(Figure 5). Dissolution of feldspar postdates compaction
and clay cementation (Figure 6e). A small proportion of
feldspar has been ablitized (Figure 5), and polysynthetic
twinned plagioclases sporadically have albite overgrowths
marked by lines of fluid inclusions (Omer, 2015).
The authigenic clay minerals form the second-most
abundant cement in the sandstones of the Ora Formation
for both sections (3.4%–6.8%). They are mainly illite and
mixed-layer illite/smectite, while kaolinite constitutes a
minor part in relation to the alteration of K-feldspar. The
presence of illite is visible as fibrous, mat-like, and lathshaped crystals oriented perpendicular to the grain surface
and intergrown with mixed-layer illite/smectite and mud
intraclasts. It occurs within quartz overgrowths in some
samples, filling pores and replacing detrital grains and
earlier clays, sometimes inhibiting the formation of quartz
overgrowth (Figure 6f).
4.3. Cathodoluminescence petrography
4.3.1. Detrital quartz grains
Hot CL studies show that most of the detrital grains in the
sandstones of the Ora Formation are monocrystalline and
rounded to well-rounded in shape while the authigenically
grown quartz are euhedral and rarely of bipyramidal
endings filling open pore spaces (Figures 6c and 7a).
Some moderately rounded grains are present in sample
22 from the Chalky Nasara section, especially in mature
thin-bedded sandstones, and seldom angular grains
were observed in sample 29 of the Chalky Nasara section
(Figure 1b). A significant compaction caused intensive
grain crushing and fragmentation/annealing of detrital
grains (Figure 6c). Furthermore, pressure solution appears
to have taken an important role during cementation of the
sandstones (Figure 4c). Suture contacts between detrital
quartz grains are only observed between grains; however,
some cement has also been involved.
Changes in temperatures and pressure are a main
factor controlling the CL properties of detrital quartz
grains as well as the geochemistry of the depositional
environment during the growth of such quartz grains and
postdated geological events (Zinkernagel, 1978; Matter
and Ramseyer, 1985). Quartz grains with luminescence
214
color of brown to dark brown are the dominant grains
in Ora sandstones and an indication of low-temperature
metamorphic origin, while the bright blue-colored grains
are of felsic magmatic and high-temperature origin
(Omer, 2015) (Figures 6d and 7a–7d). The boundaries and
shapes of individual quartz grains can be detected by using
different CL instruments; their widths are shown in Table 3.
4.3.2. Quartz cement generations
Based on CL properties, three generations of quartz cements
were observed in sandstones of the Ora Formation. The
thickness of quartz overgrowths varies from one sample
to another (Table 3). The first generation (Q1), which is
in direct contact with quartz grains, is characterized by a
thin rim and low luminescence intensity with gray to slight
brown colors (Figures 6c and 7a). This type of cement is
precipitated in primary pores and within mechanical
cracks, reducing the intergranular porosity (Figure 7a). In
some areas, the Q1 generation is volumetrically significant
and postdated the onset of compaction, but it does vary
and commonly has a patchy occurrence on the detrital
grain surfaces with slightly brown luminescence. The Q1
cement is usually between 5 and 10 µm in thickness, but
in places it has grown to larger sizes and it occasionally
forms euhedral overgrowths up to 30 µm thick (Table 3).
This stage is considered to be the earliest quartz cementing
enveloping the margins of most of the detrital quartz grains
(Figures 7a and 7b). Tiny fluid inclusions are located at the
boundary between detrital grains and their overgrowths,
a phenomenon documented by Friis et al. (2010). The
subsequently formed quartz cement generation Q2 has a
very high SEM-CL intensity, characterized by dark brown
luminescing overgrowths, which are volumetrically more
important in the thinly bedded sandstone than in the
thickly bedded sandstones. The thickness of Q2 cement
commonly ranges between 10 and 25 µm and rarely reaches
up 180 µm (Table 3). It is characterized by homogeneous,
strong luminescence and constitutes the final pore-filling
of authigenic quartz cement, which resulted in reduction
of the primary and secondary porosity, which occasionally
engulfs illite (Figures 6c, 6d, 7a, and 7b). The earlier
generation of illite appears to have inhibited the growth
of Q2 cement within secondary pores since it predates the
Q2 cementation. The remaining pore spaces were filled
by the mesodiagenetic illite and Q2 type cement. Both
Q1 and Q2 generations represent the common cements
in the sandstones of the Ora Formation in both studied
sections (Figure 5). The final quartz cementation (Q3)
is observed as cryptocrystalline quartz filling in many
large fractures. This is also accompanied by the filling of
some chlorite sulfides. The Q3 type cement generation
is characterized by darker brown luminescence and has
irregular thickness ranging between 100 and 240 µm. CL
images show that the previous two cement generations
and the detrital quartz grains were cut by fractures filled
OMER and FRIIS / Turkish J Earth Sci
Figure 6. SEM-CL images of quartz arenite and photomicrograph of sublitharenite showing different diagenetic processes. (a) Sublitharenite sandstone
pore fillings are authigenic clay, showing effects of mechanical compaction by moderate bending of muscovite (red arrow) (Chalky Nasara section,
sample 4) (XPL). (b) SEM image of quartz arenite sandstone showing framboidal pyrite (Py) in pore space of sandstones and little bend of mica flakes (red
arrow) of an early diagenetic process (Ora section, sample 2). (c) CL image of fine- to medium-grained quartz arenite sandstones; mechanically crushed
grains are healed by cracks of detrital quartz grains (red arrow). The pore space is almost occluded by dark brown color of Q2 phase cement and thinly by
slight brown color of Q1 phase cement around detrital quartz grain (white arrow) strongly cemented by quartz overgrowth cements and no intergranular
porosity, thus closing primary pore spaces (Chalky Nasara section, sample 7). (d) CL image of the sandstone subjected to a second episode of crushing,
affecting Q1 overgrowths (red arrow). The pervasive and common Q2 cement phase has dark brown fill of pore space (Chalky Nasara section, sample
16). (e) BSE image of feldspar dissolution and the formation of secondary porosity, thus postdating mechanical compaction and clay cement (Ora
section, sample 6). (f) SEM image of quartz arenite showing authigenic illite cement located centrally between detrital quartz grains, inhibiting quartz
overgrowth. K-Feldspar (3–2) alters to form illite (clay mineral), with albitization of feldspar (3–1). Detrital heavy mineral zircon setting between two
quartz grains (3–4). Fluid inclusion within quartz grains that cross-cut other phases of quartz cements (red arrow) (Chalky Nasara section, sample 27).
Qtz = Detrital quartz, Py = pyritization, Q1 = quartz cement generation 1, Q2 = quartz cement generation 2, SP = secondary porosity. Qtz over = Quartz
overgrowth.
215
OMER and FRIIS / Turkish J Earth Sci
Figure 7. CL images and photomicrograph of polarizing microscope of quartz arenite sandstone showing different generations of quartz
cement. (a) Thin rims of first-generation quartz cement (Q1) with slightly luminescent gray to brown color, loosely packed at margin of
quartz grains, and reducing intergranular porosity (white arrow). Dark brown luminescence of second-generation quartz cement (Q2)
filled secondary pores and thus engulfed authigenic illite (red arrow) (Ora section, sample 8). (b) CL image of quartz arenite sandstone,
pervasive of metamorphic quartz grains, strongly cemented by quartz overgrowths of Q1 cement, luminescence and slightly brown in
color (white arrow), thus reduced primary pores (intergranular porosity) (Ora section, sample 13). (c) Medium-grained sandstone was
cut most by detrital quartz grains and other cements by darker brown luminescence of Q3 telogenesis stage, filling fractures, with some
cracks of first crushing episode also present and indication of intensive mechanical compaction. (d) Crossed Nicols of the same view
as in (c) (Chalky Nasara section, sample 22). Qtz = Detrital quartz, white arrow = Q1, red arrow = Q2, Q1 = quartz generation cement
1, Q2 = quartz generation cement 2, Q3 = quartz generation cement 3, I = authigenic illite, Plu = plutonic quartz, Meta = metamorphic
quartz.
by Q3 type cement (Figure 7c) Q3 type cementation is
restricted to the sandstones of the Chalky Nasara section.
Illite also accompanies the Q3 cement generation, which
initially shows a low and weak luminesce that change into
brownish colors.
216
The identification of the Q2 and Q3 cement generations
is basically impossible with optical microscopy alone
(Figures 7c and 7d). Cases similar to that of Q3 cement
have been described by others (e.g., Milliken and Laubach,
2000; Friis et al., 2010; Omer and Friis, 2014).
OMER and FRIIS / Turkish J Earth Sci
Table 3. Widths of detrital quartz grains and quartz generation cements from the
sandstones of the Ora Formation, North Thrust Fault, examined under hot CL.
Sample
Grain size (µm)
Quartz cements width (µm)
Minimum
Maximum
Ch. 4
75
180
Minimum
Maximum
Q1, 3
Q1, 7
Q2, 10
Q2, 17
Q3, 110
Q3, 190
Or. 5
90
200
Or. 8
85
190
Ch. 6
80
210
Ch. 20
55
110
Ch. 28
100
250
Q1, 5
Q1, 9
Q2, 14
Q2, 24
Q1, 7
Q1, 10
Q2, 12
Q2, 20
Q1, 4
Q1, 10
Q2, 50
Q2, 190
Q1, 10
Q1, 30
Q2, 25
Q2, 50
Q1, 5
Q1, 10
Q2, 10
Q2, 20
Q3, 100
Q3, 240
Ch.: Chalky Nasara section; Or.: Ora section; Q1: Quartz generation cement 1; Q2: Quartz
generation cement 2; Q3: Quartz generation cement 3.
4.4. Trace element geochemistry of quartz cements
Trace element CL profiles were determined across the
detrital quartz and quartz cements (Figures 6c, 6d, and 7c)
and the results of trace element analyses of three types of
quartz cements and detrital quartz grains are summarized
in Table 4. The trace element compositions of quartz
overgrowths in the Ora sandstones are very similar to
those reported for other low-temperature authigenic and
hydrothermal quartzes (Rusk et al., 2008; Friis et al., 2010;
Götte et al., 2011, 2013; Lehmann et al., 2011).
The trace element compositions of quartz cements in
the Ora Formation sandstones are dominated by Al, K, Li,
and Fe. The concentrations of these elements vary strongly
and the main differences between detrital quartz and quartz
cements are shown in their Li and Al contents. Aluminum
content shows a much larger variation (up to 39000 ppm)
in the first generation (Q1) of quartz cement in the Chalky
Nasara section than in the detrital quartz (up to 7500 ppm;
Table 4). Li content also shows lower concentrations in the
detrital quartz than in the Q1 cement (up to 70 ppm) in
the Chalky Nasara section. The same phenomena were
described by Demars et al. (1996) in quartz overgrowths
in the Paris Basin Keuper sandstones.
A bright luminescence with a slightly brownish
color is the main feature to distinguish Q1 type cement
from the others (Figures 7a and 7b). Significant positive
correlation of Al with Li has been found in the Q1, Q2,
and Q3 cement generations and detrital quartz in the
Ora section with average correlations (R) of 0.906, 0.832,
0.915, and 0.934, respectively. However, the same elements
in the detrital quartz grains in the Chalky Nasara section
do not show any correlation. The distribution of Al and
Li shows different patterns among samples from the two
Ora sandstones (Figures 8a–8d). Al, Li, and H have been
found as the most important in authigenic hydrothermal
and metamorphic quartz (Götte and Ramseyer, 2012).
Germanium is found in low concentrations in both
quartz cements and detrital quartz, ranging between
0.39 and 6.80 ppm in overgrowth cements and 0.4 and
3.24 ppm in detrital quartz grains (Table 4). There is a
significant positive correlation between Ge and Al in the
Q3 cement (R = 0.899) and quartz grains (R = 0.743) in
the Ora section, while those in the Chalky Nasara section
are weak (R = 0.475) (Figures 9a–9c). Germanium is also
positively correlated with Fe (R = 0.894) in the Q3 cement
(Figure 9d).
Sodium shows a strong positive correlation with Al in
all Q2 quartz cements (R = 0.934) and detrital quartz (R
= 0.921) in the Ora section (Figure 9e), which is not the
case for Q3 cement in the Chalky Nasara section, which
could be the result of ablation of aqueous high-salinity
microinclusions within the authigenic quartz during
217
OMER and FRIIS / Turkish J Earth Sci
Table 4. Results of trace element analyses for the sandstones of the Ora Formation measured by LA-ICP-MS.
Analysis no.
Lippm
Bppm
Nappm
Alppm
Kppm
Tippm
Mnppm
Feppm
Geppm
Li/Al
Ora section - sandstone, quartz cement 1
1
1.01
1.50
4.03
196.78
758.21
2.65
1.00
514.28
1.17
0.01
2
7.82
1.89
131.89
4228.11
2055.72
2.18
n.d.
8923.50
0.67
0.00
3
2.60
1.06
28.23
242.61
93.39
n.d.
1.54
131.47
1.07
0.01
4
3.20
n.d.
3.66
179.73
14.33
0.76
2.20
1938.13
0.98
0.02
5
2.17
n.d.
19.52
1321.03
338.63
5.77
2.21
1365.10
0.75
0.00
6
26.28
n.d.
207.17
25290.17
7347.78
4.66
n.d.
39099.90
1.59
0.00
7
0.32
n.d.
13.95
1786.62
698.97
n.d.
n.d.
318.54
0.65
0.00
8
1.27
0.88
23.51
359.74
83.35
4.62
0.48
212.41
1.58
0.00
9
0.35
0.80
3.82
18.42
7.65
2.35
0.43
143.92
0.61
0.02
10
1.16
0.89
12.60
40.53
4.51
1.49
0.33
69.48
0.59
0.03
11
4.93
n.d.
66.83
10556.84
4710.08
2.42
1.73
3870.90
1.80
0.00
12
0.83
n.d.
15.68
2302.46
1022.05
n.d.
0.71
762.52
1.12
0.00
13
0.67
n.d.
75.41
1303.14
n.d.
8.25
1.82
1140.10
1.25
0.00
14
1.68
n.d.
8.04
34.35
11.51
1.57
0.85
193.59
1.20
0.05
15
6.29
1.68
12.90
239.40
77.03
3.19
0.71
214.44
1.01
0.03
16
9.17
n.d.
1207.40
20376.11
102805.00
n.d.
n.d.
10566.00
2.41
0.00
17
23.16
n.d.
9.75
1090.86
385.56
0.94
0.51
117.77
1.88
0.02
18
37.05
0.08
13.67
6439.26
369.19
1.32
n.d.
19809.30
1.74
0.01
19
10.62
n.d.
59.82
4543.39
2070.64
1.44
n.d.
1964.00
1.98
0.00
20
34.56
n.d.
74.64
757.56
107.21
3.02
n.d.
2100.10
1.49
0.05
21
3.08
n.d.
15.69
77.48
8.04
1.26
0.71
160.70
0.85
0.04
22
1.66
n.d.
31.60
703.55
278.61
n.d.
1.55
230.74
1.18
0.00
23
1.46
0.76
3.50
63.89
n.d.
n.d.
0.28
71.27
0.97
0.02
Average
7.54
1.06
85.13
3571.83
5868.94
2.82
1.06
3913.30
1.24
0.01
Chalky Nasara section - sandstone, quartz cement 1
24
6.89
n.d.
62.42
8619.39
4535.17
n.d.
2.01
11613.90
2.16
0.00
25
0.19
0.59
2.73
8.55
3.86
2.82
0.25
64.45
0.57
0.02
26
11.23
n.d.
13.76
2030.85
907.81
4.97
1.71
2152.00
1.95
0.01
27
41.18
n.d.
118.80
17515.07
6074.14
n.d.
n.d.
37556.00
3.21
0.00
28
1.98
1.63
6.82
417.69
89.33
n.d.
0.67
1017.10
0.99
0.00
29
24.30
n.d.
7.93
410.63
11.81
1.63
0.78
196.12
1.96
0.06
30
73.06
n.d.
301.52
39824.30
9056.20
n.d.
n.d.
111037.00
2.74
0.00
31
20.29
n.d.
68.85
5796.74
1614.52
6.25
n.d.
19296.00
1.55
0.00
32
22.58
1.62
7.00
713.74
46.84
n.d.
1.30
948.37
2.23
0.03
33
20.56
n.d.
493.48
9497.72
13448.32
n.d.
n.d.
241497.00
2.29
0.00
34
5.26
n.d.
16.35
646.79
198.86
n.d.
1.66
2155.70
1.03
0.01
35
1.89
1.35
5.68
22.22
8.68
3.58
0.60
346.31
0.83
0.09
Average
19.00
1.29
92.08
7125.31
2999.66
3.85
1.28
35656.60
1.79
0.02
218
OMER and FRIIS / Turkish J Earth Sci
Table 4. (Continued).
Ora section - sandstone, quartz cement 2
36
6.21
0.84
34.51
452.75
77.67
1.73
1.32
522.38
1.34
0.01
37
5.66
n.d.
13.85
456.76
5.03
2.01
1.42
1026.20
1.39
0.01
38
6.29
0.66
3.56
97.18
4.77
0.57
0.38
102.46
1.74
0.06
39
1.07
0.71
38.47
20.36
4.81
1.06
0.68
107.99
0.58
0.05
40
14.25
0.79
28.35
269.00
5.00
0.62
1.89
114.55
1.88
0.05
41
3.23
n.d.
18.83
705.53
160.66
n.d.
1.41
1865.50
0.81
0.00
42
22.25
n.d.
505.39
25206.09
9459.06
n.d.
n.d.
39271.10
0.80
0.00
43
10.29
0.79
3.74
201.44
5.11
0.68
0.41
15.16
2.00
0.05
44
0.31
0.79
4.72
11.03
4.45
3.76
0.30
73.48
0.61
0.03
45
16.29
n.d.
516.12
14201.41
6159.46
2.06
0.86
206.12
1.21
0.00
46
2.98
n.d.
34.63
1381.62
605.33
n.d.
n.d.
4888.60
0.68
0.00
47
3.48
1.58
163.52
1734.16
649.19
n.d.
2.07
3719.20
0.86
0.00
48
0.49
n.d.
7.05
26.17
10.67
8.06
0.72
178.46
1.00
0.02
49
16.29
n.d.
516.12
14201.41
n.d.
2.06
0.86
206.12
1.21
0.00
50
3.41
1.55
34.01
1700.00
650.30
n.d.
3.10
4698.00
0.77
0.00
Average
7.53
0.96
128.20
4044.33
1271.54
2.26
0.95
3799.70
1.13
0.02
Chalky Nasara section - sandstone, quartz cement 3
51
2.50
0.64
56.26
177.61
65.48
8.43
0.78
95.25
1.46
0.01
52
4.33
1.01
16.41
499.97
126.56
4.63
1.63
251.87
0.47
0.01
53
1.35
0.72
40.78
155.46
37.01
2.49
0.48
98.75
1.24
0.01
54
2.77
n.d.
20.02
1444.51
n.d.
7.15
1.14
636.18
0.73
0.00
55
3.76
n.d.
42.69
662.57
221.35
n.d.
0.56
147.06
0.56
0.01
56
8.10
n.d.
17.83
1278.46
224.27
n.d.
0.14
2337.03
1.58
0.01
57
3.88
0.79
47.01
1071.51
365.00
4.64
0.48
379.07
0.93
0.00
58
1.10
1.31
4.05
84.16
53.60
9.46
0.83
88.24
0.68
0.01
59
10.70
1.88
8.69
3490.51
639.30
7.01
n.d.
11022.40
1.27
0.00
60
10.92
n.d.
n.d.
1068.30
186.59
2.55
n.d.
5786.90
0.57
0.01
61
0.87
1.66
2.61
797.96
246.89
5.08
2.42
3035.60
0.39
0.00
62
3.97
n.d.
39.72
811.26
271.35
1.38
1.18
1482.10
0.88
0.00
63
3.02
1.08
7.45
2227.77
614.16
n.d.
2.63
4982.70
0.49
0.00
64
1.64
n.d.
3.17
197.11
14.21
1.05
n.d.
2369.40
1.72
0.01
65
5.77
0.87
5.89
209.38
5.34
n.d.
0.85
452.54
1.22
0.03
66
16.16
1.47
14.54
1909.87
404.48
7.22
4.51
4925.95
1.60
0.01
67
2.12
n.d.
12.38
263.58
93.29
n.d.
0.26
116.88
1.60
0.01
68
50.44
n.d.
46.60
23810.71
n.d.
n.d.
n.d.
50361.00
6.80
0.00
69
3.26
n.d.
n.d.
1688.29
625.15
n.d.
n.d.
5962.50
2.37
0.00
70
14.99
0.65
n.d.
610.74
72.27
n.d.
1.02
1073.30
2.20
0.02
71
12.17
0.78
36.95
309.42
34.60
4.05
0.47
349.51
0.96
0.04
Average
8.03
1.07
23.73
2036.63
226.36
5.01
1.19
4569.20
1.41
0.00
219
OMER and FRIIS / Turkish J Earth Sci
Table 4. (Continued).
Ora section - sandstone, quartz grains
72
0.63
0.77
3.55
16.82
4.82
2.54
n.d.
126.05
0.63
0.04
73
0.53
0.78
44.35
17.07
7.60
9.60
2.01
330.97
0.58
0.03
74
1.39
n.d.
31.25
19.62
5.43
4.23
1.30
155.00
0.66
0.07
75
0.35
n.d.
3.50
30.66
4.71
2.41
2.08
203.34
1.40
0.01
76
0.48
0.92
3.85
20.87
6.12
1.80
0.38
79.76
0.54
0.02
77
14.07
0.80
10.56
241.58
4.34
0.74
0.31
66.97
1.57
0.06
78
0.22
n.d.
3.93
11.30
3.94
1.32
0.67
62.64
0.41
0.02
79
1.04
n.d.
12.80
144.60
38.88
4.80
0.31
246.29
0.67
0.01
80
0.23
0.82
3.02
269.33
130.01
2.08
0.57
439.89
0.50
0.00
81
0.55
1.82
29.61
459.35
192.46
3.79
0.41
171.25
1.25
0.00
82
3.44
n.d.
7.37
96.78
10.62
n.d.
0.83
185.03
1.18
0.04
83
0.90
0.90
10.18
14.62
4.52
2.74
1.47
82.55
0.73
0.06
84
44.59
n.d.
161.56
3940.57
13532.58
n.d.
n.d.
51451.00
2.38
0.01
85
32.11
n.d.
37.12
1571.99
245.79
5.67
0.83
181.57
0.96
0.02
86
0.22
0.74
10.67
15.60
3.18
6.54
0.26
63.80
0.94
0.01
87
0.57
n.d.
31.79
85.56
40.04
4.21
0.75
301.82
0.56
0.01
Average
6.31
0.94
25.32
437.77
889.68
3.75
0.82
3384.30
0.94
0.03
Chalky Nasara section - sandstone, quartz grains
88
10.65
n.d.
7.78
565.56
174.58
n.d.
0.23
n.d.
1.58
0.02
89
0.34
0.76
4.90
11.35
15.16
3.31
0.13
n.d.
0.48
0.03
90
12.83
n.d.
30.26
1357.69
439.34
n.d.
1.07
380159.00
0.95
0.01
91
1.01
n.d.
14.46
26.89
n.d.
1.26
0.53
3011.30
1.16
0.04
92
44.30
n.d.
104.00
1456.97
7455.78
n.d.
n.d.
34098.00
1.94
0.03
93
2.27
1.62
9.18
227.05
78.48
n.d.
0.47
932.69
1.51
0.01
94
10.89
n.d.
9.35
3124.16
937.23
n.d.
1.30
3847.20
1.37
0.00
95
10.76
1.58
43.96
1141.94
385.22
0.19
2.02
1524.70
0.71
0.01
96
2.66
n.d.
60.01
839.57
346.17
n.d.
2.18
3235.50
0.81
0.00
97
1.14
1.92
29.95
54.43
24.52
4.01
n.d.
2015.70
1.84
0.02
98
15.83
n.d.
198.03
5973.65
24306.72
n.d.
n.d.
4200.50
1.72
0.00
99
0.79
n.d.
30.56
7276.64
3032.91
n.d.
1.98
11634.70
3.24
0.00
100
45.61
n.d.
131.85
2163.54
2864.24
2.85
n.d.
76640.00
1.45
0.02
101
7.33
1.35
4.82
1152.22
198.24
n.d.
2.10
2054.40
1.65
0.01
102
0.87
1.90
8.08
353.64
102.88
0.59
0.80
512.17
1.17
0.00
103
15.60
n.d.
173.69
3389.13
7689.18
n.d.
n.d.
75670.00
2.32
0.00
104
1.16
0.61
2.64
16.11
4.05
n.d.
0.60
66.54
0.85
0.07
105
0.54
1.05
8.07
62.16
33.02
1.36
0.80
198.74
1.58
0.01
106
3.26
1.01
7.38
92.88
15.70
2.43
2.09
181.42
1.09
0.04
Average
9.88
1.31
46.26
1541.35
2672.41
2.00
1.16
31578.00
1.44
0.02
220
OMER and FRIIS / Turkish J Earth Sci
Figure 8. Relationships between trace elements Al and Li in the sandstones of Ora Formation measured by LA-ICP-MS. (a) A positive
correlation coefficient between Li and Al in quartz overgrowth cement (Q1) in Chalky Nasara section. (b) Quartz overgrowth cement
(Q2) in Ora section. (c) Quartz overgrowth cement (Q3) in Chalky Nasara section. (d) A positive correlation coefficient as indicated by
plotted Li versus Al in detrital quartz grains in Ora section.
LA-ICP-MS measurement (Hartmann et al., 2000b).
Potassium content of some detrital quartz grains is higher
than that of Na. Such characteristics have previously been
observed in agates where K is incorporated with Al as
a charge-compensating cation (Merino et al., 1995). A
strong correlation between Al and K is observed in Q3
cement (R = 0.828; Figure 9f). The distributions of the
other analyzed elements (Ti, Mn, and B) do not show any
systematic differences between the quartz overgrowths and
detrital quartz grains in the Ora sandstones. However, the
average Ti contents in Q3 cement and detrital quartz in the
Ora section are up to 5.01 ppm and 3.75 ppm, respectively.
Higher Ti concentrations were observed by Van den
Kerhof et al. (1996), proposed to be due to quartz derived
from granulites. In the current study Ti concentrations are
lower in quartz cements and refer to hydrothermal origin
(Müller et al., 2003).
4.5. Fluid inclusion measurements of quartz cements
The microthermometric measurements of fluid inclusions
in quartz overgrowth cements are given in Table 5.
Synthetic fluid inclusion samples provided by the Linkam
stage manufacturers were used to calibrate the stage before
the measurements of homogenization temperatures of the
studied samples. This standard contains fluid inclusions
with pure water (wt. 0% salinity). At room temperature the
inclusions are liquid/vapor two-phased inclusions; heating
them up to 374.1 °C (pure water critical point) verifies that
the stage is working properly.
On the basis of petrography and CL observations,
each of the fluid inclusions was assigned to different quartz
cement generations: Q1, Q2, and Q3. Three sandstone
samples were examined for their fluid inclusion contents.
Their sample numbers are 16 and 22 from the Chalky
Nasara section and 14 from the Ora section (Figure 1b).
Petrographically, the examined samples of the Chalky
Nasara section are fine- to medium-grained, subrounded
to rounded, well-sorted sandstones with rare ductile clay
grains, clay matrix, and heavy minerals. The fluid inclusions
of three quartz cement generations were identified. The
fluid inclusions entrapped by the quartz overgrowths
are rare, elongated to rounded, two-phased (L/V), and
liquid-dominant at room temperature and inclusions are
221
OMER and FRIIS / Turkish J Earth Sci
Figure 9. Relationships of trace elements in the sandstones of Ora Formation. (a, b, c) Positive correlations between Al and Ge are
found in quartz cement generation Q3 and detrital quartz grains in Ora and Chalky Nasara sections, respectively. (d) A strong positive
correlation between Ge and Fe in Q3 Chalky Nasara section. (e) A positive correlation between Al and Na in Q2 cement Ora section. (f)
A positive correlation between Al and K in Q3 cement Chalky Nasara section.
about 5–15 µm in size. Twenty-two microthermometric
measurements were performed on Chalky Nasara samples
and six on Ora samples (Table 5). Homogenization
temperatures (Th) of the fluid inclusions in the Chalky
Nasara section of the first-generation quartz cements
(Q1) reveal primary inclusions with a homogenization
temperature ranging between 154.5 and 160.0 °C. The
fluid inclusions of the second generation of quartz
222
cements (Q2), which show dark brown luminescence
overgrowths (Figure 6d), are also primary, with a Th
ranging between 160.0 and 165.5 °C (Table 5). The fluid
inclusions within the Q3 cement are of secondary origins
and have a characteristic white-blue fluorescence under
the ultraviolent light and a yellow color under blue light.
They cross-cut other cements and quartz grains and have
a Th ranging between 167.5 and 177.5 °C (Figures 7c, 10a,
25
26
27
28
29
30
31
Quartz overgrowth
Quartz overgrowth
Quartz overgrowth
Quartz overgrowth
Quartz overgrowth
Quartz overgrowth
Detrital quartz
Primary
Primary
Primary
Primary
Primary
Primary
Primary
1
1
1
2
2
2
-
1
1
1
1
2
2
3
3
3
3
3
3
3
3
3
1
1
1
1
2
3
3
Ora section
V/L
V/L
V/L
V/L
V/L
V/L
V/L
V/L
V/L
V/L
V/L
V/L
V/L
V/L
V/L
V/L
V/L
V/L
V/L
V/L
V/L
V/L
V/L
V/L
V/L
V/L
V/L
V/L
V/L
V/L
V/L
Chalky Nasara section
Qtz. cem. gen. Fluid phase
Th: Temperature of homogenization; V: Vapor; L: Liquid; Tm: Temperature of melting ice.
14
22
Primary
Primary
Primary
Primary
Primary
Primary
Secondary
Secondary
Secondary
Secondary
Secondary
Secondary
Secondary
Secondary
Secondary
Primary
Primary
Primary
Primary
Primary
Primary
Secondary
Secondary
Primary
Quartz overgrowth
Quartz overgrowth
Quartz overgrowth
Quartz overgrowth
Quartz overgrowth
Quartz overgrowth
Quartz trail/vein
Quartz trail/vein
Quartz trail/vein
Quartz trail/vein
Quartz trail/vein
Quartz trail/vein
Quartz trail/vein
Quartz trail/vein
Quartz trail/vein
Detrital quartz
Quartz overgrowth
Quartz overgrowth
Quartz overgrowth
Quartz overgrowth
Quartz overgrowth
Quartz trail/vein
Quartz trail/vein
Detrital quartz
16
1
2
3
4
5
6
7
8
9
10
11
12
13
14
15
16
17
18
19
20
21
22
23
24
Type fluid
Sample no. Fluid no. Host mineral
Irregular
Irregular/elongated
Elongated
Irregular
Rounded
Rounded
Irregular
Rectangular
Rectangular
Rounded
Elongated
Elongated
Irregular
Irregular
Rounded
Rounded
Rounded
Elongated
Rounded
Elongated
Irregular
Rounded
Irregular
Irregular/elongated
Irregular/elongated
Irregular/elongated
Elongated
Irregular
Rounded
Rounded
Elongated
Fluid shape
0.22
0.20
0.25
0.33
0.33
0.33
0.27
0.25
0.25
0.25
0.20
0.17
0.22
0.22
0.18
0.19
0.22
0.17
0.18
0.30
0.10
0.30
0.15
0.30
0.25
0.20
0.25
0.27
0.18
0.25
0.20
154.5
156.5
158.5
162.5
160.0
163.5
198.5
155.5
157.5
156.0
160.0
163.0
165.5
167.5
176.5
177.0
177.5
176.5
177.0
169.0
176.5
169.0
194.0
155.0
156.0
156.5
160.0
161.5
177.0
170.5
203.0
V/L ratio Th (°C) Lv to L
Table 5. Microthermometry results of the quartz cement generations in representative samples from the Ora Formation.
–2.30
–2.20
–2.20
–2.00
–1.80
–1.70
-
–2.20
–2.00
–1.70
–1.80
–1.80
–2.00
–3.59
–3.00
–3.24
–3.03
–3.48
–3.84
–3.00
–3.42
–3.54
–2.10
–2.00
–2.30
–1.90
–2.20
–3.09
–3.42
-
Tm ice (°C)
3.90
3.70
3.70
3.30
3.30
2.90
-
3.70
3.30
2.90
3.00
3.00
3.30
6.10
5.00
5.40
5.05
5.80
6.40
5.00
5.70
5.90
3.55
3.30
3.87
3.25
3.70
5.20
5.70
-
Salinity
(mass %)
OMER and FRIIS / Turkish J Earth Sci
223
OMER and FRIIS / Turkish J Earth Sci
10b, 11a, and 11b). The Th for the primary fluid inclusions
in detrital quartz grains ranges between 194 °C and 203
°C. The higher homogenization temperature of inclusions
in the detrital grain shows different temperature regimes,
probably because of their metamorphic or magmatic
origins.
Six microthermometric measurements were carried
out for sample 14 of the Ora section (Figures 10c, 10d,
and 11c). This sample is very fine-grained, subangular, and
moderately sorted with significant clay laminae. Q1 and
Q2 type quartz overgrowths are found as irregular rims
around detrital quartz grain and as filling secondary pores,
respectively. The range of homogenization temperatures
of primary fluid inclusions in the Q1 and the dark brown
luminescent Q2 quartz cements are 154.5–158.5 °C and
160.0–163.5 °C, respectively (Figures 10c and 10d). The Th
for the fluid inclusions in the detrital quartz of this sample
is 198.5 °C (Table 5).
5. Discussion
5.1. Diagenetic history
Except for cases where detrital clay forms the matrix,
textural parameters do not seem to have played an
important role on the distribution of quartz cements in the
sandstones of the Ora Formation. The thin interlaminated
shale layers within the thinly bedded sandstones are
considered to be the main source of quartz cements in these
sandstones. This is supported by the high concentrations of
clay-compatible trace elements in the quartz cement. Thus,
depositional facies have played an indirect controlling role
on the distribution of the three quartz cement generations
by the facies control on the content of detrital matrix. The
sandstones of the Ora Formation from the two studied
sections were subjected to quartz cement generation in
three episodes. These are the episodes of marine eogenesis,
meteoric mesogenesis, and telogenesis (Figure 5). The
main diagenetic stages observed in the Ora sandstones are
(1) mechanical and chemical compaction; (2) authigenic
clay; (3) quartz cement generation in three episodes; (4)
formation of calcite cement; (5) dissolution of calcite
and feldspar; and (6) albitization of feldspar (Figure 5).
The earliest stage of eogenesis is the formation of pyrite
framboids, which are related to the local conditions of the
sulfide concentration formed by sulfate-reducing bacteria
being higher than the concentration of available ferrous
iron (Postma, 1982); this stage was observed in the two
sections of the Ora sandstones (Figure 5). Furthermore,
mechanical compaction took place in the eogenesis stage,
which is evident from the bending of mica flakes and tighter
packing of detrital grains. The eogenetic compaction
caused a significant reduction of primary porosity (Figures
4a and 6a). The effect of compaction is also evident from
the concave-convex suture contacts of neighboring quartz
224
grains (Figure 4c). Mechanical compaction is also partly
caused by intense grain fracturing (Figures 6c and 6d),
which also affected the Q1 and Q2 cement generations.
Brittle deformation is a common feature of the studied
Devonian-Carboniferous sandstones and significantly
contributed to compaction (Figures 6c, 6d, and 7c). When
associated with the total annealing of crushed grains, brittle
deformation cannot be distinguished without the aid of
SEM-CL studies (Dickinson and Milliken, 1995; Makowitz
and Milliken, 2003). Because the brittle deformation also
affected the Q1 and Q2 cement generations, it must have
occurred late in the mesogenesis stage or in the telogenesis
stage. Therefore, it may have been caused by the high stress
level associated with tectonic thrusting and uplift.
The chemical compaction occurred by pressure solution
along both intergranular contacts and fractures during
meteoric mesogenesis (Zhang et al., 2008). Textural traces
of this compaction can be observed along detrital grains
and more evidently along the pervasive microstylolites
produced by pressure solution. Microstylolite is a
ubiquitous feature of the supermature sandstones of
the Ora Formation and has taken place prior to any
significant cementation (Figure 4c). However, the pressure
solution is known to start at grain contacts as a result of
gradually increasing stress, which generally originated
from increasing load pressure during advancing burial of
siliciclastic sediments (Sibley and Blatt, 1976; Tada and
Sieve, 1989; Dutton and Diggs, 1990). As a consequence,
accumulation of dissolved quartz in intergranular pores
under lower pressures relative to those along the grain
contacts reduces porosity (Angevine and Turcotte, 1983).
This phenomenon is a common feature in the sandstones
of Chalky Nasara section (Figures 4c and 10a).
As a paragenetic mineral, calcite cementation played
a significant role in reducing the porosity of sandstones
from the Chalky Nasara section. During the meteoric
mesogenesis stage, authigenic illite and minor amounts of
mixed layer illite/smectite formed as grain coats on detrital
grains or as pore-filling cement and occluded primary
porosity and inhibited quartz overgrowths (Figures 6f and
7a). Illite, which typically forms during a progressive burial
stage at temperatures of 90–130 °C (Morad et al., 2000),
requires K-rich pore water. Mixed-layer illite/smectite is
also observed as pore-lining to pore-filling and having
ragged-platy morphology and a honeycomb-like texture,
which predate the quartz cementation. It is possible that
a younger generation of ferruginous cement was coevally
formed on the surface or the oxidized zone of the water
table, which predated tectonic fractures. In the thickly
bedded sandstones altered K-feldspar contains kaolinite
and sericite where sericite may be the alteration product
from plagioclase mineral inclusion in the K-feldspar.
The petrography indicates that the alterations took place
OMER and FRIIS / Turkish J Earth Sci
Figure 10. CL image and photomicrographs of fluid inclusions. (a) CL image of fractured detrital quartz grain in the quartz arenite
sandstone Q3 (yellow arrow). Pressure solution at a grain contact (P). (b) Fluid inclusion photomicrographs of the same view in (a)
showing secondary inclusions of Q3, visible distinctly due to their white-bluish fluorescence (Chalky Nasara section, Sample 16). (c)
Fluid inclusions within the quartz cements of primary inclusions of Q1 at the boundary of the detrital quartz grain (yellow arrow) (Ora
section, sample 14). (d) Fluid inclusions within quartz rims of primary inclusions of Q2 cement (yellow arrow) (Ora section, sample 14).
prior to the precipitation of authigenic clay and carbonate
cement and therefore probably were a result of freshwater
near-surface alteration (Figures 4e and 6f).
The late diagenetic stages started by dissolution of
carbonate cement and unstable detrital grains such as
feldspar and indicate that acidic fluids were flowing freely
through most of the sandstones and generated a secondary
porosity, which postdated mechanical compaction and
clay cement (Figure 6e).
5.2. Sources of quartz cement generations
Different silica sources for quartz cement generations
can be active when sediments are subjected to various
conditions during diagenesis. This was tested for the
sandstones of this study by using hot CL for detrital quartz
grains and syntaxial overgrowths, LA-ICP-MS for trace
element concentrations, and microthermometric study
for fluid inclusions in quartz cement (Tables 4 and 5).
Changes in the temperature, pressure, and geochemistry
of depositional environments affect the CL properties of
quartz grains (Zinkernagel, 1978; Matter and Ramseyer,
1985). Most of the studied detrital quartz grains display
a brown or dark brown CL color (Figures 7a and 7b),
indicating that they are of low-grade metamorphic
origin (Richter et al., 2003). According to Zinkernagel
(1978), quartz overgrowths are often nonluminescent.
The sharp boundaries of distinct quartz cement phases
indicate discontinuous growth, which was interrupted or
temporarily extremely slow prior to more rapid growth of
the following phase of quartz cement as also observed in
five phases of quartz cement in the Ordovician Khabour
Formation in northern Iraq (Omer and Friis, 2014). The
first quartz cement generation (Q1) was presumably
225
OMER and FRIIS / Turkish J Earth Sci
Figure 11. Homogenization temperatures of quartz overgrowths for individual samples.
Fluid inclusion homogenization temperatures of each quartz cement generation, Q1, Q2, and
Q3, are shown with different patterns from the sandstone of the Ora Formation (DevonianCarboniferous).
formed together with illite at the expense of feldspar
during a relatively early diagenetic stage. Q1 cement is
characterized by rims, ranging in thickness from 3 to 30 µm,
226
around detrital quartz grains with low luminescent gray to
slightly brown colors (Table 3). This process occasionally
leads to reduction in most of the intergranular porosity
OMER and FRIIS / Turkish J Earth Sci
around detrital quartz grains and closes permeable
surfaces (Figure 7b). The other probable source of quartz
cement is the grain-crushing that is developed in two
stages; the first one predates the early quartz cement and
the second one affected the cracks healed by Q1 cement
(Figures 6c and 6d). According to Haddad et al. (2006)
and Kraishan et al. (2000), the uniform CL patterns in
the quartz cements of sandstone are mostly due to trace
element content rather than defects. Based on the work
of Kraishan et al. (2000), Weber (2000), and Weber and
Ricken (2005), a common source of aluminum in quartz
cement is dissolution of feldspar or replacement by clay
minerals. The Al concentration in the three quartz cement
generations in the Ora Formation is variable (Table 4). The
Al concentration in diagenetic quartz cement is controlled
by the activity of Al in the aqueous solution, which,
assuming equilibrium conditions, is mainly controlled by
pH (Marino et al., 1989; Rusk et al., 2008).
The formation of illite as cement during eogenesis and
mesogenesis was possibly associated with the formation of
Q1 cement generation. Furthermore, the characteristic of
other eogenetic quartz cement is the slightly brownish CL
color of Q1 cement (Richter et al., 2003). This is supported
by the fluid inclusion data for the Q1 cement, which
shows moderate homogenization temperatures between
155.0 and 160.0 °C and between 154.5 and 158.5 °C in the
Chalky Nasara and Ora sections, respectively (Figures 11a,
11b, and 11c). Salinities for Q1 and Q2 cements are 2.90–
3.70 wt.% NaCl equiv. and 3.25–3.87 wt.% NaCl equiv.,
respectively, in the sandstones from the two sections of
the Ora Formation. This is believed to represent moderate
meteoric influence on originally saline sea water (Table 5).
The middle-stage quartz cementation (Q2) reaching
up to 180 µm in thickness (Table 3) is volumetrically
much more important in the thin-bedded sandstone than
in the thick-bedded sandstones. The Q2 cementation,
which is in places formed as large syntaxial overgrowth,
has provided significant contributions to the reduction
of porosity and permeability in deeply buried sandstones
(Figure 6d) (Weibel et al., 2010). The moderate albitization
and alteration of feldspars to kaolinite and sericite, and
the dissolution of quartz grains (Figures 4e and 6f) in
thick-bedded sandstones, are considered to be sufficient
to balance and provide a silica source for this cement
generation.
The concentration of Al in quartz, which is strongly
controlled by the pH of the solution, reflects its solubility
in hydrothermal fluids and thus may be considered as a
monitor of pH fluctuations of fluids, especially in the lowtemperature type of quartz (Rusk et al., 2008). There is a
good correlation coefficient between Al and Li in three
quartz cement generations (Figures 8a–8d) with average
Li/Al of ~0.02 in Q1 and Q2. This is an indication of the
availability of sufficient amounts of both Al and Li. Such
a correlation was documented by Demars et al. (1996) for
quartz cement that precipitated at a temperature <150 °C; a
similar Li/Al ratio was observed in sandstones elsewhere in
the world (Demars et al., 1996; Lehmann et al., 2011; Götte
et al., 2013). Since illite is the main clay mineral affecting
the sandstones of the Ora Formation, the major source of
Li is considered to be detrital clays, primarily smectite and
illite; this element may be released as a result of interaction
of pore water with smectite-illite and illite ripening
(Williams and Hervig, 2005). Kaolinite, which is present
in some samples, may locally have been replaced by illite
at the expense of K-feldspar and excess silica precipitated
as quartz cement (Bjørlykke et al., 1989; Bjørlykke and
Aagard, 1992). Lithium content of authigenic quartz is
thought to be controlled by salinity because of enrichment
of Li in high-saline pore waters (Kloppmann et al., 2001;
Chan et al., 2002). The average salinity for Q2 quartz
cement generation is around 3.4 wt.% NaCl equiv., which
is in the range of salinity of sea water.
Following the complete cementation of the sandstones
by Q1 and Q2 generations, they were subsequently
fractured during telogenesis. The fractures cut detrital
grains and all other cements (Figures 7c and 7d), and they
were then filled by the Q3 cement generation. However,
most of the fractures were filled by chlorite, similar to the
phenomenon described by Friis et al. (2010). LA-ICP-MS
data of authigenic quartz reveal a significant correlation
between Al and Ge, particularly in Q3 cements (Figure 9a).
This is an indication that the source of Ge is not related to
Al. However, Ge within the detrital quartz grains may be
the source of Ge in cement of the Chalky Nasara section.
This means that the Ge concentration in the detrital grains
is sufficient to provide Ge up to 6.5 ppm in the Q3 quartz
cement generation (Table 4). An additional source for Ge
is possibly abundant mica flakes (Figure 4f) (Hörmann,
1970) or mica illitization (Evans and Derry, 2002).
Pressure-induced contacts can occur at grain boundaries
during advanced burial of siliciclastic rocks (Dutton
and Diggs, 1990). The CL images (Figure 10a) show that
pressure solution and microstylolites are common in Q3
cement-rich sandstones in the Chalky Nasara section. It is
therefore proposed that pressure solutions of detrital quartz
and feldspar are the major sources of Ge in Q3 cements
(Hartmann et al., 2000a). Analysis of the secondary fluid
inclusions of the investigated samples in the Chalky Nasara
section showed that the Q3 cement generation has the
highest homogenization range, between 167.5 and 177.5
°C with salinity ranging between 5.00 and 6.40 wt.% NaCl
equiv., which is much higher than the Th and salinity of the
Q1 and Q2 cement generations (Table 5).
Aluminum variations may be caused by changes in the
fluid composition (Monecke et al., 2002; Rusk et al., 2008)
227
OMER and FRIIS / Turkish J Earth Sci
and/or changes in the paragenetic assemblage. A specific
change of trace element concentration within a few
micrometers of hydrothermal quartz has been reported
by Rusk et al. (2008) and Jourdan et al. (2009) and was
interpreted to have been caused by variations in fluid
composition rather than changes in temperature or growth
speed. As a second approach to assess our data, cross-plots
of the fluid inclusions of the investigated samples between
homogenization temperatures (Th) and salinity for the
quartz cements revealed three distinct groups representing
the three cement generations (Figure 12). The first group
(Q1) has lower Th, followed by the second group (Q2),
which has slightly higher Th, while the third group (Q3)
is characterized by the highest salinity and Th. The salinity
of the two first groups (2.9–3.9 wt.% NaCl equiv.) is close
to sea water salinity and reflects burial modification of
moderate meteoric influence on originally saline sea
water. On the other hand, group three has salinity of about
twice that of Q1 and Q2, indicating that its precipitation
occurred during deep burial conditions of telogenesis.
Rusk et al. (2008) and Müller et al. (2010) suggested
that the Al concentration in hydrothermal quartz reflects
that Al in the fluid is related to fluid pH, similar to that in
Q3 cement. The difference in homogenization regime and
brine salinity between Q3 and Q1–Q2 indicates different
burial conditions for the Chalky Nasara section and reflects
a hydrothermal source for Q3 cement. A hydrothermal
source of Q3 cement is supported by the occurrence of Q3
cement in cross-cutting fractures, which often have linings
of chlorite and sulfides (Figure 7c).
Trace element compositions and fluid inclusion studies
can be used as tools to indicate changes of physicochemical
conditions during burial diagenesis of the basin, which
further supports the CL results. Fluctuations of the Al
content in quartz cement are best explained by changes
of CO2 concentrations in the pore fluids and changes of
the paragenetic sequence from quartz-kaolinite to quartzillite, which is also related to depositional facies.
6. Conclusions
The following conclusions can be drawn from the CL,
LA-ICP-MS, and microthermometric studies of the three
quartz cement generations (Q1, Q2, and Q3) during the
deposition of the Ora Formation in northern Iraq in
subtidal, tidal channel, and intertidal flat environments.
1) CL investigation identifies two quartz cement
generations (Q1 and Q2) in the Ora section and three
quartz cements (Q1, Q2, and Q3) in the Chalky Nasara
section.
2) The Q2 quartz cement generation, of dark
brown luminescences and up to 180 µm in thickness, is
volumetrically a much more important cement generation
in the thinly bedded sandstone than in the thickly bedded
sandstone facies, which in some cases developed as a
large syntaxial overgrowth that has a major influence
on reducing porosity and permeability under deep
burial conditions. Moderate albitization of feldspar and
alteration to kaolinite and sericite is another source for
this generation.
3) Fluid inclusion in Q1 and Q2 cements showed similar
homogenization temperatures in the two studied sections,
whose ranges were between 154.5 and 160.0 °C and 160.0
and 165.5 °C, respectively. Crushed grains and illite
were considered the main sources for Q1 cement, while
dissolution of feldspar is the source of Q2. Both cements
have similar salinity, close to the salinity of sea water.
Salinity mass %
Figure 12. Cross-plots between homogenization temperatures versus salinity of three
quartz cements in the quartz arenites of the sandstones of the Ora Formation.
228
OMER and FRIIS / Turkish J Earth Sci
4) The range of homogenization temperatures of the
Q3 quartz cement generation formed through telogenesis
of deep burial diagenesis was 167.5–177.5 °C, which is
higher than those of the Q1 and Q2 quartz generations.
5) Quartz cement generation Q3 formed at higher
homogenization temperatures than Q1 and Q2, which
were in the range between 167.5 and 177.5 °C, being rather
different from other quartz cements and formed through
telogenesis of deep burial diagenesis.
6) A significant correlation coefficient was found
between Al and Li in the three quartz cement generations
with average Li/Al of ~0.02 in Q1 and Q2, independent of
total availability of both Al and Li where Li is most likely to
have been found in high saline pore waters.
7) A strong positive correlation between Al and Ge,
particularly in the Q3 quartz cement generation (R =
0.889++), suggests that the pressure solution of detrital
grains for supermature quartz arenite and microstylolites
at grain margins is the main source for Q3 cement with
higher precipitation salinities of 6.10 wt.% NaCl equiv.,
suggesting hydrothermal precipitation after major thrust
fault reaction.
Acknowledgments
The first author would like to thank the Erasmus Mundus
Action Program of the European Union for funding
this research project as a postdoctorate fellowship,
project number SALA1206157, at Warsaw University,
Poland. We would like to express our thanks to Professor
Boguslaw Bagiñski for assistance and for making all SEM
research facilities available for this project in the Faculty
of Geology, Warsaw University, Poland. Thanks also to
Professor Jarosław Stolarski at the Polish Academy of
Sciences for making the hot CL available for this study.
Furthermore, we are also grateful to helpful Research
Associate Dr Hans-Michael Seitz at Goethe University,
Frankfurt (Germany), for analyzing trace elements in
detrital quartz and cements by LA-ICP-MS.
References
Alavi M (1994). Tectonics of the Zagros Orogenic Belt of Iran: new data
and interpretations. Tectonophysics 229: 211-238.
Alavi M (2004). Regional stratigraphy of the Zagros fold-thrust belt in
Iran and its proforeland evolution. Am J Sci 304: 1-20.
Alavi M (2007). Structures of the Zagros Fold-Thrust Belt in Iran. Am
J Sci 307: 1064-1095.
Al-Hadidy AH (2007). Paleozoic stratigraphic lexicon and hydrocarbon
habitat of Iraq. Geo-Arabia 12: 63-130.
Ali SA, Omer M.F, Aqrawi AM (2016). Petrography geochemistry and
provenance of the Chalki rocks in Kurdistan region, North Iraq.
Arab J Geosci 9: 1-15.
Angevine CL, Turcotte DL (1983). Porosity reduction by pressure
solution: a theoretical model for quartz arenites. Geol Soc Am
Bull 94: 1129-1134.
Aqrawi AAM, Goff JC, Horbury AD, Sadooni FN (2010). The Petroleum
Geology of Iraq. Beaconsfield, UK: Scientific Press Ltd.
Bambauer HU (1961). Spurenelementgehalte und γ-Farbzentren in
Quarzen aus Zerrklüften der Sweizer Alpen. Schweiz Miner
Petrog 41: 335-369 (in German).
Barzinjy DN (2006). Sedimentology and palynology of Kaista and
Ora formations in Zakho area Iraqi Kurdistan Region. MSc,
Salahaddin University, Erbil, Iraq.
Bellen RC, Dunnington HV, Wetzel R, Morton DM (1959). Lexique
Stratigraphique Internal Asia, Fascicule, 10a, Iraq. Paris,
France: Central National deal Recherches Scientifique (in
French).
Bjørlykke K, Ramm M, Saigal GC (1989). Sandstone diagenesis and
porosity modification during basin evolution. Geol Rundsch
78: 243-268.
Bjørlykke K, Aagard P (1992). Clay minerals in North Sea sandstones.
Origin, diagenesis and petrophysics of clay minerals in
sandstones. SEPM Spec P 47: 65-80.
Buday T (1980). The Regional Geology of Iraq, Stratigraphy and
Paleontology. Mosul, Iraq: Dar Al-Kutb Publishing House,
University of Mosul.
Chan LH, Starinski A, Katz A (2002). The behavior of lithium and its
isotopes in oil field brines: evidence from the Heletz-Kokhov
field, Israel. Geochim Cosmochim Ac 66: 615-623.
Davoudzadeh M, Weber-Diefenbach K (1987). Contribution to
the paleogeography, stratigraphy and tectonics of the Upper
Paleozoic of Iran. Neues Jahrb Geol P-A 175: 121-146.
Demars C, Pagel M, Deloule E, Blanc P (1996). Cathodoluminescence
of quartz from sandstones: interpretation of the UV range
by determination of trace element distributions and fluid
inclusion P-T-X properties in authigenic quartz. Am Mineral
81: 891-901.
Basu A (1985). Reading provenance from detrital quartz. In: Zuffa
GG, editor. Provenance of Arenites. NATO ASI Series, C 148.
Dordrecht, the Netherlands: D. Reidel Publishing Company, pp.
231-247.
Dickinson WW, Milliken KL (1995). The diagenetic role of brittle
deformation in compaction and pressure solution, Etjo
sandstone, Namibia. Geology 103: 339-347.
Behnam WM (2013). The sedimentology of Ora Formation (Upper
Devonian-Lower Carboniferous) in north and west of Iraq. PhD,
University of Baghdad, Baghdad, Iraq.
Dutton SP, Diggs TN (1990). History of quartz cementation in
the Lower Cretaceous Travis Peak Formation, East Texas. J
Sediment Petrol 60: 191-202.
229