The physical and physicochemical properties of some Turkish thermal muds and pure clay minerals and their uses in therapy
Bạn đang xem bản rút gọn của tài liệu. Xem và tải ngay bản đầy đủ của tài liệu tại đây (2.26 MB, 15 trang )
Turkish Journal of Earth Sciences
Turkish J Earth Sci
(2017) 26: 395-409
© TÜBİTAK
doi:10.3906/yer-1707-8
/>
Research Article
The physical and physicochemical properties of some Turkish thermal muds and pure
clay minerals and their uses in therapy
1,
1
2
Muazzez ÇELİK KARAKAYA *, Necati KARAKAYA , Senar AYDIN
Department of Geological Engineering, Faculty of Engineering, Selçuk University, Konya, Turkey
2
Department of Environmental Engineering, Faculty of Engineering and Architecture, Necmettin Erbakan University, Konya, Turkey
1
Received: 10.07.2017
Accepted/Published Online: 09.11.2017
Final Version: 23.11.2017
Abstract: The physical and physicochemical properties of thermal muds (peloids) from 20 spas in Turkey were defined and compared
with those of naturally pure clay minerals, smectite, illite, sepiolite, and kaolinite, to define the suitability of their use in pastes, masks,
creams, and/or mud baths. The liquid and plastic limit values of the peloids show medium to high plasticity. The values of the pure clay
minerals vary from 110 to 369 and 60 to 130, respectively, being higher than those of the peloid samples except for illite and kaolinite.
The peloid samples show very soft, soft, semihard, hard, and fluid properties according to the consistency index. The CEC values of the
peloids vary from 10.11 to 36.01 meq/100 g. The abrasivity of the peloids and clay minerals ranges from 0.58 to 3.12 mg/m2 and 0.05 to
0.37 mg/m2, respectively. The viscosity values of the peloid samples are variable and the thixotropic values are considerably higher in
some peloid samples. In the pure clay minerals, sepiolite shows high values. The oil absorption capacity of sepiolite is higher than that
of the other clay minerals. The peloids with high CEC, swelling, and absorption capacity may be suitable for the removal of oils, toxins,
and contaminants from the skin.
Key words: Abrasivity, consistency limits, absorption, peloid, therapy, viscosity
1. Introduction
The physical properties of peloids, such as the ease of
use, ease of removal from the skin, and the potential
for irritating the skin, are important parameters in the
determination of their suitability for use in cosmetics or
therapy (Summa and Tateo, 1998; Viseras and LopezGalindo, 1999; Cara et al., 2000a, 2000b; Carretero, 2002;
Veniale et al., 2004, 2007; Carretero et al., 2006, 2007, 2010;
Carretero and Pozo, 2007, 2009, 2010; Lopez-Galindo et
al., 2007; Tateo and Summa, 2007; Dolmaa et al., 2009;
Karakaya et al., 2010, 2016a; Matike et al., 2011; Rebelo et
al., 2011).
The physical and physicochemical properties of
peloids play a key role in their use as masks, cures, pastes,
and bandages. Peloids prepared as clay/water mixtures can
display different properties such as plasticity, consistency,
acquisition of colloidal state, and thixotropy, depending
on the clay mineral type and the peloid content. The
rheological properties of peloids, such as fluidity and
consistency, depend on the mineralogical composition
and maturing conditions (Carretero et al., 2006). Those
parameters affect the chemical reaction and heat transfer
between the peloid and the body (Yvon and Ferrand, 1996;
*Correspondence:
Bettero et al., 1999). The rheological properties and the
stickiness of the muds used in pelotherapy are important.
The viscosity of the mud increases with the addition of
Ca- and Mg-sulfate fluids and decreases in association
with other fluids (Viseras et al., 2006). Gomes and Silva
(2007) explained the use of clay minerals, specifically for
local applications dermocosmetic applications. Carretero
and Pozo (2009) reported that the use of various clay
minerals in hot springs and therapy depends on the grain
size, low hardness, rheological properties, high moisture
content, cation exchange capacity (CEC), and heat
retention properties. The high proportion of the smectite
group minerals in peloids makes them suitable for use
in healing applications due to their swelling potential
(water absorption), surface area and CEC (enabling
the retention of unwanted elements), and specific heat
(enabling the application of the mud bandage/mask for
long periods of time) (Cara et al., 2000a, 2000b). Peloids
containing carbonate group minerals, on the other hand,
are especially suitable for psoriasis because they improve
the subcutaneous circulation and suitable layering of the
epidermis (Lopez et al., 2008). The apparent viscosity
is observed in many cosmetic products that are used,
395
ÇELİK KARAKAYA et al. / Turkish J Earth Sci
similarly to peloids, in contact with the epidermis (Viseras
et al., 2006).
Peloids are used in spas for patients with
musculoskeletal system problems to reduce/prevent aches,
to improve the quality of life, and in cosmetics. Therefore,
therapeutic applications do not only benefit from the
heating effect (vein widening, sweating, and heartbeat
and respiration enhancement), but also the healing effect
of the peloid from absorption by the skin (Quintela et al.,
2012). Clay minerals, e.g., kaolinite, smectite, palygorskite,
sepiolite, and talc, are defined in pharmacopoeias, and
being accepted medicines they could contribute in
pharmaceutical formulations as active principles and/or
excipients (Gomes et al., 2015 and reference there in).
Peloids (thermal mud) have been used in many
Turkish thermal resorts for healing, therapy, and cosmetic
uses, from ancient times to the present day (Karakaya et
al., 2010, 2016a, 2016b). Peloid materials with different
mineralogical, chemical, and physicochemical properties
show different therapeutic and cosmetic effects, and
their effects also depend on which materials are used.
The physicochemical and chemical properties of peloids
and their therapeutic effects can vary due to the different
compositions of the materials used and their effects also
depend on how the materials are used. There are few
detailed studies on the suitability of peloids in Turkey.
For the first time, Karakaya et al. (2010) studied solely
the mineralogical and chemical properties of nine spa
peloids. In this study, the rheological and physicochemical
properties of peloids are investigated and compared
with those of pure clay minerals such as smectite, illite,
kaolinite, and sepiolite to make recommendations for
the preparation of suitable peloids. Additionally, it is also
aimed to suggest which types of clay minerals can be used
for healing, wellness, and cosmetics because clay minerals
and clay/water mixtures are the main controlling factors of
peloid properties and uses.
2. Materials and methods
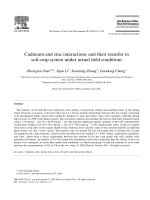
Twenty-three peloid samples were taken from different spa
centers together with a volcanic center in Turkey (Figure
1). All physical and physicochemical analyses of the peloids
and naturally pure clay minerals were made in the peloid
laboratory of the Department of Geological Engineering
of Selçuk University, except for particle size analysis. The
peloid samples were dried, washed with distilled water,
and sieved under water to separate the silt-clay size (<63
µm) fraction from the bulk materials. Distribution of the
silt-clay fraction was studied using the Micromeritics
SediGraph 5200 Particle Size Analyzer (Micromeritics
Instrument Corporation, Norcross, GA, USA) in the SEM
laboratory of Anadolu University (Eskişehir, Turkey).
Mineralogical analyses of the bulk samples were made by
X-ray diffraction using randomly oriented powders and
oriented samples (<2 µm).
After drying of wet and sieved samples, they were
homogenized, dried, and pulverized for 5 min in a
porcelain ball mill for the analyses. The naturally pure clay
Figure 1. Location of the peloid samples and main tectonic lineaments, volcanic centers, and geothermal areas of Turkey
(simplified from Şimşek, 2015).
396
ÇELİK KARAKAYA et al. / Turkish J Earth Sci
minerals, with mineralogical and chemical properties as
previously defined by Çelik et al. (1999), Karakaya MÇ
et al. (2001, 2011a, 2011b, 2012), and Karakaya N et al.
(2011) were collected from different areas of Turkey. The
pure illite and smectite samples were collected from the
vicinity of Ordu in the northern part of Turkey (Çelik et
al., 1999; Karakaya MÇ et al., 2011a, 2011b). The kaolinite
and sepiolite samples were taken from the Konya and
Ankara regions located in central Turkey, respectively
(Karakaya et al., 2001; Karakaya N et al., 2011). The pure
clay minerals, smectite, illite, sepiolite, and kaolinite, were
used for comparison of their physical and physicochemical
properties with those of the peloids. The mineralogical
compositions and types of the samples were published by
Karakaya et al. (2016b).
The consistency of the peloid and clay minerals
was determined with the Casagrande system using the
Atterberg method in accordance with the ASTM 4318-00
standard (ASTM, 1994). The samples were dried in an oven
at 50 °C and sieved to <63 µm. The consistency indexes (Ic)
of the studied peloids were calculated with the equation [Ic
= (LL – wn)/LL – PI], where LL is the liquid limit, wn is
the natural water content (%), and PI is the plasticity index
(Means and Parcher, 1963). The naturally present water
content was calculated from the weight loss at 50 °C. The
activity index (AI) shows the change in volume of the clays
associated with the change in water content. It is calculated
from the ratio of the plasticity index to the weight of the
<2 µm clay size fraction (%) (Skempton, 1953) and is
expressed as a percentage.
The moisture content of the peloid samples was
measured in accordance with the relevant Turkish standard
(Turkish Standards Institution, 1978). The moisture of the
sample was determined from 1 g of sample after drying for
1 h at 105 ± 5 °C. The dry mass and the moisture content
of the sample were then calculated.
The CEC values of the peloids were determined by
means of the ammonium acetate method as described by
Busenberg and Clemency (1973).
The oil absorption tests were carried out following the
relevant Turkish standard (Turkish Standards Institution,
1997) using surface oil absorption tester Model AI 3016
(Angel Instruments, Sharanpur, India) at 20 °C and 50%
room temperature and humidity, respectively. Cotton
oil was used in the experiment; every drop of 0.0015 mL
was dripped using the syringe of the 2.03 kg cylinder. The
cylinder was rolled over the sloped surface (approximately
33.4 cm) and some of the oil was absorbed by the sample.
Five measurements were taken from each sample, and
an average was taken; the measurement error was ±0.3.
Samples of 100 g were prepared from the bulk samples
using the quartering method.
The apparent viscosity of the material was measured
with a Brookfield viscometer on a 10% peloid-water
dispersion. The dispersion was prepared by mixing 15 g
of sieved (<63 μm) peloid sample with 360 mL of distilled
water. This methodology is concordant with the ASTM
(2010) standards, better describing non-Newtonian
materials. The apparent viscosity measurements were
carried out at different turning speeds. The apparent
viscosities of the samples kept in a 40 °C hot water bath
were measured using a Brookfield LVDVIII+PRO Ultra
Rheometer (Brookfield, Middleboro, MA, USA) and a
number 73 spindle. The measurements were made in 30min intervals at different cutting ratios (2.5, 5, 10, 20, 50,
and 100 rpm). The measurements were repeated after 24 h.
The thixotropic index is defined as the ratio of the viscosity
at 2.5 rpm to the viscosity at 20 rpm (Singer and Galan,
1984). The thixotropic percentage is the percentage ratio
of the viscosity difference from 5 rpm to 20 rpm to the
second viscosity.
The abrasivity of the sieved (<63 μm) peloid and pure
clay samples was determined on 50 g of sample (< 63 μm)
dried for 15 min at 60 °C and disaggregated in 400 mL
of distilled water until a homogeneous dispersion was
obtained using the Einlehner AT 1000 Abrasivimeter
(Angel Instruments), as defined by Klinkenberg et al.
(2009) and Rebelo et al. (2011). Before and after the testing,
the mass of the clean and dry bronze wire was measured.
The dispersed sample was stirred at 43,500 revolutions for
30 min. The mass loss (mg) of the wire, as the accepted
Einlehner abrasion and abrasivity index, was calculated as
the ratio of the wear area to the mass loss.
The Brunauer–Emmett–Teller (BET) surface areas of
samples were measured by standard multipoint techniques
using Gemini VII 2390 V1.03 equipment (Micromeritics
Instrument Corporation). The samples were subjected to
a degassing process conducted at 150 °C under vacuum
for 3 h to attain a constant weight. Surface area values
were determined using the BET equation (Brunauer et al.,
1938) using a P/Po range of 0.06–0.30 of the branch of the
isotherm and pore size distribution was determined from
the desorption branch of the isotherms. The degassing of
the powder samples was performed under vacuum (10–
2
Torr) at temperatures ranging from 50 to 150 °C.
3. Results
3.1. Mineralogical properties
The mineralogical composition of the peloids is generally
homogeneous and composed mainly of smectite, illite,
and mixed-layer illite-smectite, with smaller proportions
of quartz and feldspar, calcite, dolomite, and amorphous
silica and rarely of kaolinite, halite, serpentine, and gypsum
(Karakaya et al., 2016a). The proportion of the clay minerals
is generally between 50% and 60%, and the most abundant
clay mineral is Ca-montmorillonite (Table 1).
397
ÇELİK KARAKAYA et al. / Turkish J Earth Sci
Table 1. Mineralogical composition (rare components were omitted) of the samples (Karakaya
et al., 2016b).
Sample
number
Mineralogy and mineral contents (wt.%)
P-1
Sme(60)+Cal(12)+Ms/Bt(10)+Fsp(8)+Qz(5)+Kln(3)+Dol(2)
P-1/1
Sme(65)+Cal(15)+Ms/Bio(8)+Fsp(6)+Qz(6)
P-2
Sme(65)+Cal(13)+Dol(8)+Ms/Bt(6)+Qz(4)+Kln(4)
P-3
Cal (95)+Sme(3)+Dol(2)
P-5
Sme(38)+Ms/Bt(30)+Cal(13)+Fsp(9)+Qz(5)+Kln(3)+Dol(1)+Gp(1)
P-5/1
Cal(34)+Ms/Bt(32)+Sme(18)+Fsp(5)+Qz(4)+Kln(4)+Dol(2)+Gp(1)
P-6
Sme(36)+Ms/Bt(27)+Cal(22)+Qz(5)+Dol(4)+Fsp(3)+Kln(3)
P-6/1
Sme(58)+Cal(20)+Ms/Bio(16)+Qz(2)+Dol(2)+Fsp(1)+Kln(1)
P-6/2
Sme(47)+Cal(23)+Ms/Bio(18)+Qz(4)+Dol(3)+Kln(3)+Fsp(2)
P-7
Sme(31)+Dol(18)+Cal(17)+Srp(10)+Kln(8)+Qz(7)+Py(5)+Gp(4)
P-8
Sme(42)+Srp(18)+Cal(9)+Ms/Bt(8)+Dol(6)+Kln(6)+Qz(5)+Fsp(4)+Hl(2)
P-9
Sme(66)+Hl(11)+Cal(8)+Fsp(7)+Qz(5)
P-10
Sme(14)+Fsp(21)+Qz(28)+Ms/Bt(18)+Hem(10)+Kln(5)+Py(4)
P-11
Sme(52)+Ms/Bt(21)+Fsp(9)+Qz(8)+Dol(6)+Kln(4)
P-12
Sme(57)+Ms/Bt(15)+Cal(11)+Fsp(8)+Qz(4)+Kln(3)+Gp(2)
P-14
Sme(32)+Ms/Bt(22)+Cal(17)+Fsp(11)+Qz(7)+Kln(4)+Py(4)+Hl(2)
P-15
Sme(36)+Ms/Bt(26)+Cal(12)+Kln(10)+Dol (7)+Qz(4)+Fsp(3)+Gp(2)
P-16
Sme(73)+Fsp(6)+Qz(6)+Kln(4)+Gp(4)+Py(4)+Cal(3)
P-16/1
Sme(47)+Cal(37)+Fsp(6)+Qz(4)+Kln(4)+Gp(2)
P-16/2
Sme(61)+Ms(11)+Fsp(7)+Qz(6)+Kln(4)+Gp(4)+Py(4)+Cal(3)
P-17
Sme(60)+Cal(15)+Fsp(12)+Kln(4)+Qz(4)+Py(4)
P-18
Sme(52)+Cal(40)+Fsp(3)+Qz(3)+Do(2)
P-19
Man(90)+Sep(10)
P-19/1
Man(82)+Spe(18)
P-20
Ms/Bt(37)+Cal(18)+Sme(7)+Fsp(26)+Qz(12)
P-20/1
Ms/Bt(38)+Cal(17)+Sme(11)+Fsp(21)+Qz(13)
Bt: Biotite, Cal: calcite, Dol: dolomite, Fsp: feldspars, Gp: gypsum, Hem: hematite, Hl: halite, Hyl:
halloysite, Ilt: illite, Kln: kaolinite, Man: magnesite; Ms: muscovite, Qz: quartz, Sme: smectite,
Sep: sepiolite, Srp: serpentine, Py: pyrite (abbreviations from Whitney and Evans, 2010).
3.2. Particle size distribution
The particle size distributions of the peloid samples are
highly heterogeneous. The fraction below 2 µm of peloids
P-2, 5/1, 6, 11, 15, 16, 17, and 18 are less than 50% (Table
2). For the fraction under 2+5 μm (fine silt and clay)
determined in P-16, the content of this fraction is 77%.
The samples with the highest fraction content of fine sand
are P-2, 5/1, 6, 11, 15, 16, 17, and 18. The fraction content
below 20 μm is less than 50% in P-10, 11, and 15.
3.3. Consistency properties
The consistency parameters are the key factors in the
adhesion strength (or bond strength) between the
398
particulate material grains, the slip resistance against load
and stability, changing stiffness with water, and the stiffness
acquired from different waters. The liquid limit and plastic
limit values of the samples vary (Figure 2; Table 3). The
consistency limits of samples P-3 and P-10 could not be
determined because they have high calcite concentration
(<10% clay) and contain almost no clay. Peloid samples
P-2, 12, and 16 have the highest liquid limit values, while
P-5, 8, 11, 18, 19, and 20 have the lowest values. The
liquid limit values of the peloid samples are between 22%
and 84%, which may indicate very low smectite content
(Table 3). The liquid limit values of montmorillonite, illite,
ÇELİK KARAKAYA et al. / Turkish J Earth Sci
Table 2. Particle size distribution of the peloid samples (µm).
P-1
P-1/1 P-2
P-5
P-5/1 P-6
P-7
P-8
P-9
P-11 P-12 P-13 P-14 P-15 P-16 P-17 P-18 P-19 P-20 P-20/1
0.3
0.3
0.1
0.3
0.1
0.2
0.1
0.1
0.2
0.3
0.5
0.3
0.2
0.1
0.2
0.2
0.1
0.4
0.3
0.3
63–50 1.5
0.0
0.0
0.0
0.0
0.0
0.0
1.8
0.0
0.0
0.1
0.0
0.0
0.0
0.0
2.0
0.0
0.0
0.0
0.0
50–10 8.1
7.9
20.0 5.0
22.1
20.0 0.1
0.0
1.8
21.9
9.0
13.0
2.9
27.0 1.0
15.0 36.0 0.0
9.9
10.2
10–2
27.2
28.2
45.7 23.1 31.9
41.0 7.5
1.9
6.0
26.1
25.0
22.0
20.1
36.0 83.1
27.0 31.9 5.0
24.1 23.1
<2
64.4
63.6
34.2 71.6 45.9
38.8 92.3 98.0 92.0
51.7
65.6
64.7
76.8
36.9 15.7
57.8 32.0 94.8 65.7 66.4
>63
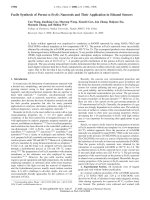
Figure 2. Plasticity of the peloid samples. Explanation: for fine materials, L: low,
I: middle, H: high, V: very high, M: extremely high plasticity. Line A is an empirical
boundary for classification of cohesive soils (Bain, 1971). CV, CH, CI, and CL: Very
high, high, intermediate, and low plasticity clays, respectively; ML and MH, silt and
organic soils of low and high plasticity. The A line separates clay type materials from silt
and the U line shows the upper bound of the ground.
kaolinite, and palygorskite are 100-900, 60-120, 30-110,
and 160-230, respectively (Mitchell, 1993). The plastic
limit values of the samples (5.1% to 41.5%) are lower
than the limit values given by Mitchell (1993) for clay
minerals. The liquid limit, plastic limit, plasticity index,
activity index, and consistency index are considerably
lower in P-19, which contains 90% magnesite. According
to the liquid limit and plasticity limit values of the studied
peloid samples, one sample is CL (low plasticity clay), six
samples are CI (intermediate plasticity clay), eight samples
are CH (high plasticity clay), three samples are CV (very
high plasticity clay), and the other five samples are MH
(high plasticity silt), as shown on the graph by Holtz and
Kovacs (1981, references therein) (Figure 2; Table 3). The
investigated peloids generally have a high clay content
and medium to high plasticity. Samples P-11 and P-15
have a higher proportion of silt size material and plot in
the high plasticity silt area of Figure 2. Samples P-7 and
P-16 plot on the clay–silt boundary shown by line A. The
consistency limits of the peloid samples were compared
with measurements made on pure clay minerals (Tables 3
and 4). The liquid limit values of the pure clay minerals
range from 110 to 125 in smectite, 32 to 35 in illite, 286 to
369 in sepiolite, and 43 in kaolinite (Table 4). The plastic
limit values of the peloids are significantly lower than those
of the pure clay minerals, which could be attributed to
the high quantities of nonclay components in the peloids
(Tables 3 and 4).
According to the consistency index, samples P-5 and
19 are fluid; P-5/1, 6/2, and 18 are very soft; and the other
peloids are soft, semihard, and hard in character (Table 3)
(Means and Parcher 1963). Samples P-6 (immature) and
P-6/2 (pool) show similar properties. The AI represents
the change in volume depending on the water content
399
ÇELİK KARAKAYA et al. / Turkish J Earth Sci
Table 3. Consistency limits and other physical characteristics of the peloid samples.
Sample
number
Liquid
limit (LL %)
Plastic
limit (PL %)
Plasticity
index (PI %)
Plasticity
expandability potential
Activity
index (AI %)
Consistency
index (Ic)
Swelling
(%)
Consistency
status
P-1
68.00
20.87
47.13
HPL/HS
0.60
0.73
8.71
SR
P-1/1
66.50
27.00
39.50
VHPL/HS
1.09
0.28
8.80
Soft
P-2
83.00
25.36
57.64
VHPL/HS
1.68
0.53
8.91
Soft
P-5
54.50
20.65
33.85
HPL/MS
0.47
-0.19
8.80
Fluid
P-5/1
42.00
15.72
26.30
HPL/MS
0.57
0.04
6.70
VS
P-6
64.50
26.92
37.58
HPL/HS
0.96
0.51
9.20
SR
P-6/1
39.50
18.55
21.00
HPL/LS
0.49
0,31
4.70
Soft
P-6/2
54.00
28.38
25.60
HPL/MS
0.71
0.12
6.70
VS
P-7
73.00
34.74
38.26
VHPL/HS
0.41
0.77
8.10
Rigid
P-8
45.00
22.77
22.23
IPL/LS
0.23
0.35
3.40
Soft
P-9
58.00
25.36
32.64
HPL/MS
0.35
0.95
7.50
Rigid
P-10
Not determined (nonplastic)
0.40
SR
P-11
54.00
32.33
21.67
HPL/LS
0.42
0.82
4.50
Rigid
P-12
82.00
25.92
56.08
VHPL/HS
0.85
0.41
8.30
Soft
P-13
63.00
22.12
40.88
HPL/HS
0.63
0.61
9.50
SR
P-14
56.50
24.40
32.10
HPL/MS
0.42
0.73
6.10
SR
P-15
62.00
41.52
20.48
HPL/LS
0.55
0.91
8.50
Rigid
P-16
88.50
36.24
52.26
VHPL/HS
3.29
0.70
8.40
SR
P-17
68.50
25.47
43.05
HPL/MS
0.75
0.90
5.10
Rigid
P-18
44.00
11.61
32.40
HPL/MS
1.01
0.25
4.70
VS
P-19
22.00
5.12
16.90
IPL/LS
0.18
-0.62
0.90
Fluid
P-20
48.00
16.20
31.80
HPL/MS
0.51
0.70
7.70
SR
P-20/1
42.00
21.49
20.50
IPL/LS
0.31
0.59
7.10
SR
VHPL: Very highly plastic clay, HPL: highly plastic clay, IPL: intermediate plastic clay, HS: high swelling, MS: medium swelling, LS: low
swelling; measurement errors of the consistency parameters and swelling are ±0.2 and 0.3, respectively. SR: Semirigid, VS: very soft.
and is defined as the ratio of the plasticity index to the
weight percentage (%) of the clay size by weight (<2 µm)
(Skempton, 1953). Apart from six of the studied peloid
samples (P-1/1, 2, 6, 12, 16, and 18), the activity values are
lower than 0.75 in the samples (Table 4).
In the studied peloid samples with high carbonate
mineral content, the swelling percentage could not be
determined for P-3 and is significantly lower for P-10,
at approximately 0.4%, due to their high carbonate and
nonclay mineral content. The swelling percentage of
the other samples varies from 3.4% to 9.5% (Table 1).
In the samples with high smectite content, the swelling
percentage is generally high. Some samples containing
high levels of smectite show low swelling capacities,
which could be partially attributed to the smectite being
Ca-smectite showing high to medium crystallinity. The
moisture content of one of the peloid samples is greater
400
than 50% (P-16), while that of the other samples is 16%–59%
(except P-3).
3.4. Oil absorption
The oil absorption capacities of the peloid samples are
between 26.51% and 59.95%. There are no correlations
between the oil adsorption and CEC in the peloids or
between BET and oil adsorption. Generally, the samples
with high moisture content also show high oil absorption
capacities (Table 5). The water and oil absorption capacities
of the materials used as peloids were compared to those
of various pure clay minerals (Table 5). The moisture
of the studied peloids is similar to that of smectite and
kaolinite, higher than illite, and lower than sepiolite. From
the perspective of oil absorption, all peloid samples are
noticeably lower than sepiolite and, except for a few samples,
all capacities are lower than those of other clay minerals. The
studied peloids absorbed oil in a shorter time compared to
the clays (Table 5).
ÇELİK KARAKAYA et al. / Turkish J Earth Sci
Table 4. Some consistency limits of examined pure clay minerals.
Mineral
Liquid limit
Plastic limit
Plasticity index
Plasticity
expandability
potential
Ca-Smectite
111.0
65.8
45.2
VHPL/HS
Ca-Smectite
110.0
65.2
44.8
VHPL/HS
Na-Ca-Smectite
125.0
60.6
64.4
VHPL/HS
Illite-1
35.0
29.7
5.3
IPL/LS
Illite-2
32.0
23.6
8.4
IPL/LS
Sepiolite-1
286.0
109.0
177.0
VHPL/HS
Sepiolite-2
369.0
130.0
239.0
VHPL/HS
Kaolinite
43.0
39.0
4.0
IPL/LS
Consistency limits
Explanations were given in Table 1.
3.5. Abrasion properties
The Einlehner abrasion (at 43,500 rpm) of the peloid and
pure clay samples ranges from 24 to 102 mg and 2 to 7 mg
(Table 3). The abrasion index of the peloids varies from
0.58 to 3.12 g/m2. The highest abrasion index was observed
in sample P-10, while P-19 showed the lowest value. The
abrasivity of the pure clay minerals is lower than that of
the peloid samples. The abrasion index of the sepiolite and
kaolinite is lower than that of illite and smectite (Table 5).
3.6. Viscosity and thixotropy properties
The apparent viscosities of the studied peloids were 9.03–
90.66 Pa s in the first measurement at 2.5 rpm. During
the measurements after 24 h, values of 7.02–88.30 Pa
s were obtained (Table 6). The highest viscosities (at 2.5
rpm) were observed in samples P-6, 8, 9 16, 10, 14, 18,
and 20. There is a general parallelism in the graphs of the
measurements taken after 24 h, with a slight decrease or
increase of the apparent viscosity in samples allowed to
stand for 24 h (Figures 3 and 4). Where the viscosity curves
do not match after wait time, samples other than P-1/1, 2,
3, 6, and 19/1 showed an increase in the viscosity values
after 24 h. This indicates that the clay/water dispersions are
appropriate to use in the implementation process. Samples
P-1, 1/1, 5, 6/1, 6/2, 7, 11, 12, 15, and 16 with viscosity
values very close to or somewhat close to 4 Pa s at 10 rpm
also show suitability for use when required to stay on the
skin (Viseras et al., 2006). Samples numbers P-13 and
P-14, and partially P-15, have lower thixotropic properties
than the other peloid samples (Table 4). Because peloid
samples P-1/1, 2, 5/1, and 15 do not show a change in
viscosity behavior after 24 h, their flow behavior will not
change considerably over time. The viscosity properties
of the studied peloids were compared with those of pure
clay samples. The measurements were completed on pure
smectite (one pure Ca and two Na-Ca montmorillonite),
three illites, two sepiolites, and one kaolinite (Figure 4).
The viscosity of Na-Ca-smectite is higher than that of Casmectite, while the sepiolite viscosity is higher than that
of the other clay minerals. The lowest viscosity is 2.8 Pa
s in the kaolinite sample at 2.5 rpm. The most suitable
value at 10 rpm was determined for the Na-Ca-smectite
sample. All samples showed an increase in viscosity after
being allowed to stand for 24 h. The highest viscosity was
observed in sepiolitic clays, showing 9–10 Pa s at 10 rpm,
which is higher than the 4 Pa s value; however, viscosity
values too low for use as peloids were observed in the
samples of Ca-smectite and kaolinite, and partially in illite
(Figure 4).
Thixotropic studies were carried out on the peloids as
fluid muds, which lose their fluidity and start to solidify
when not moving but return to their fluid state when
stirred. The thixotropic values taken initially and after 24
h are generally similar. Thixotropy is important for peloids
used in masks. It provides information on the cracking
and falling period of the mud spread on the skin.
3.7. BET surface area and CEC properties
BET surface areas for the majority of the samples are
greater than 20 m2/g; samples P-1, 2, 16, 20, and 20/1 show
greater values. The lowest values were obtained for samples
P-10, 11, and 19 (Table 3). The highest BET values were
determined in smectites and sepiolites while kaolinite and
illite had the lowest values from pure clay samples.
The CEC of the studied samples is 10.11–36.01
meq/100 g. Sample P-19 containing 90% magnesite shows
the lowest CEC value, and sample P-10 shows the lowest
smectite content (Table 3).
4. Discussion
The peloids and pure clay minerals have very high, high,
intermediate, and weak plasticity values. The particle sizes
401
ÇELİK KARAKAYA et al. / Turkish J Earth Sci
Table 5. Moisture, oil adsorption capacity, duration, abrasivity, abrasivity index, BET surface area, and CEC of the analyzed peloid and
pure clay minerals.
Sample
number
Moisture
%
Oil adsorption
capacity (mL/100 g)
Oil adsorption
duration (±5 s)
Abrasion
(mg)
Abrasivity
index (g/m2)
BET surface
area (m2/g)
CEC
(meq/100 g)
P-1
36.45
33.19
39.74
36
133
42.46
26.79
P-2
46.54
39.94
54.30
37
136
55.88
36.01
P-5
36.54
39.95
35.62
34
134
26.86
30.89
P-6
43.09
46.60
39.08
46
153
22.26
31.07
P-7
46.39
46.61
29.12
46
181
20.67
33.83
P-8
33.22
33.26
39.54
41
122
28.49
29.12
P-9
33.20
33.27
47.01
58
153
21.47
33.34
P-10
16.96
26.57
52.63
98
312
8.12
10.11
P-11
29.91
33.22
48.41
69
193
13.49
19.58
P-12
43.09
43.15
34.13
43
131
26.80
24.41
P-13
33.22
29.92
55.42
55
159
30.40
28.84
P-14
39.86
43.23
32.71
71
195
22.34
27.20
P-15
46.47
46.46
26.83
62
186
20.92
29.06
P-16
59.91
59.95
10.01
40
125
34.67
32.66
P-17
43.25
33.23
49.21
55
167
29.72
35.54
P-18
40.06
30.00
29.33
59
178
22.47
26.30
P-19
32.43
36.00
25.74
24
63
15.78
10.87
P-20
25.76
32.00
30.22
76
254
80.35
32.61
P-20/1
29.80
34.00
35.28
73
251
65.57
33.48
Ca-smectite
55.00
71.00
20.78
7
28
73.60
nm
Na-Ca-smectite-1
57.00
73.00
23.34
6
30
86.22
nm
Na-Ca-smectite-2
74.00
83.00
23.15
5
21
108.53
nm
Illite-1
32.00
38.00
21.10
7
37
17.92
nm
Illite-2
39.00
45.00
18.40
6
30
30.24
nm
Illite-3
31.00
35.00
22.30
5
29
21.78
nm
Kaolinite
45.00
54.00
27.98
2
5
32.90
nm
Sepiolite-1
73.00
150.00
16.29
2
6
198.88
nm
Sepiolite-2
60.00
130.00
18.54
3
7
211.00
nm
CEC values of Benetutti mud (Cara et al., 2000a) and Morinje mud (Mihelčić et al., 2012) are 30 and 18.0 meq/100 g, respectively. nm:
Not measured.
of some of the peloids are suitable for peloid applications
because the clay content is between 70% and 80% (Veniale
et al., 2007) (Table 2). Therefore, the most suitable peloids
without mechanical grinding were P-5, 7, 8, 9, 14, and 19.
Other samples are not suitable, but their application may
be advisable especially if sand-sized particles are separated
from the material before application.
The low-plastic clays that plot below the theoretical
line are low and medium plasticity clay and silt (Bain,
1971) (Figure 2). There is a strong positive correlation (r
= 0.86) between liquid limit and plasticity index in the
402
peloid samples. A high percentage of clay fraction and
water absorption capacity also result in high liquid limit
values. The varying plastic limits of the peloid samples are
due to different clay contents. Therefore, depending on the
plasticity properties of the peloids, some of them will dry in
a shorter time, crack, and show more fluidity. The majority
of the peloids have plasticity indexes above 15% and
liquid limits above 50% (except for P-8), and are therefore
suitable as peloids. Similar to the liquid limit values, the
plastic limit values are lower than the values determined
by Mitchell (1993), which is due to the peloids containing
ÇELİK KARAKAYA et al. / Turkish J Earth Sci
Table 6. Viscosity of peloid samples at different shear rates (rpm).
Sample / shear
rate (rpm)
2.5
5.0
10.0
20.0
50.0
100.0
Thixotropy
Sample / shear
rate (rpm)
2.5
5.0
10.0
20.0
50.0
100.0
Thixotropy
Sample / shear
rate (rpm)
2.5
5.0
10.0
20.0
50.0
100.0
Thixotropy
Sample / shear
rate (rpm)
2.5
5.0
10.0
20.0
50.0
100.0
Thixotropy
Sample / shear
rate (rpm)
2.5
5.0
10.0
20.0
50.0
100.0
Thixotropy
TÇ-1
0h
18.10
9.63
5.27
2.81
1.28
0.72
6.44
TÇ-6
0h
64.21
33.16
17.62
10.34
5.30
3.85
6.23
TÇ-9
0h
70.00
32.39
15.34
7.49
3.00
1.58
9.35
TÇ-14
0h
54.21
35.11
24.62
16.18
9.72
7.31
3.23
TÇ-19
0h
22.06
11.03
8.52
2.76
1.10
0.55
7.99
TÇ-1/1
24 h
23.21
13.14
7.12
3.99
1.81
1.01
5.82
24 h
54.22
29.15
15.51
8.81
4.51
3.27
5.95
24 h
76.42
36.51
17.30
8.50
3.46
1.82
8.99
24 h
66.20
32.11
19.62
12.10
6.51
4.82
5.52
24 h
18.02
10.42
7.36
2.23
1.03
0.10
8.08
0h
17.49
8.52
4.12
2.05
0.82
0.43
8.54
TÇ-6/1
0h
19.22
9.80
4.97
2.54
1.06
0.55
6.57
TÇ-10
0h
79.83
45.30
26.83
14.99
7.54
4.39
5.32
TÇ-15
0h
14.04
7.72
4.26
2.58
1.27
0.78
5.44
TÇ-19/1
0h
45.53
23.16
11.93
6.26
2.71
1.50
7.30
TÇ-2
24 h
16.29
7.89
3.89
1.93
0.78
0.41
8.44
24 h
21.58
10.94
5.51
2.76
1.10
0.55
6.83
24 h
46.94
30.18
14.49
9.63
4.43
3.08
4.87
24 h
15.40
8.22
4.61
2.56
1.24
0.78
6.02
24 h
48.39
34.90
18.15
9.55
4.17
2.28
7.16
0h
16.68
8.16
3.49
1.74
0.81
0.17
9.59
TÇ-6/2
0h
16.22
10.31
9.75
4.95
2.45
1.28
3.28
TÇ-11
0h
37.30
16.55
7.72
3.71
1.55
0.89
10.05
TÇ-16
0h
22.06
10.10
5.52
2.76
1.10
0.55
7.79
TÇ-20
0h
90.66
61.07
28.63
8.03
2.19
1.11
12.60
TÇ-5
24 h
16.68
8.24
2.35
1.67
0.32
0.17
6.97
24 h
19.43
14.01
8.16
5.18
2.57
1.37
2.38
24 h
50.35
23.07
10.58
5.04
2.08
1.19
9.97
24 h
19.56
9.81
5.02
2.62
1.10
0.55
7.47
24 h
88.30
70.02
32.11
17.82
8.01
5.13
4.29
0h
28.28
14.14
6.82
3.28
1.31
0.71
8.62
TÇ-7
0h
36.71
17.45
8.42
4.16
1.79
1.05
8.82
TÇ-12
0h
37.11
18.05
8.63
4.19
0.17
0.95
8.86
TÇ-17
0h
23.07
8.22
3.86
1.91
0.92
0.58
12.08
TÇ-20/1
0h
20.06
18.12
18.50
10.28
6.02
4.66
9.51
TÇ-5/1
24 h
37.91
17.45
8.07
3.74
1.46
0.79
10.14
24 h
41.12
19.36
9.33
4.61
1.95
1.09
8.92
24 h
43.15
20.86
10.08
4.91
2.04
1.11
8.79
24 h
26.68
9.03
4.31
2.21
0.95
0.55
12.07
0h
39.31
20.06
11.21
6.01
2.61
1.41
6.58
TÇ-8
0h
64.38
27.58
12.03
5.84
2.62
1.54
11.02
TÇ-13
0h
32.09
19.06
12.03
7.27
3.71
2.56
4.41
TÇ-18
0h
56.96
25.37
12.03
5.99
2.54
1.54
9.51
24 h
40.51
21.41
11.31
5.91
2.61
1.41
6.82
24 h
70.40
31.79
14.19
6.64
2.78
1.62
10.60
24 h
48.12
25.21
13.10
7.15
3.91
2.16
6.42
24 h
69.40
29.99
14.19
6.87
2.92
1.63
10.10
24 h
26.08
23.07
17.55
12.03
6.92
4.96
10.81
Bolded values are appropriate for peloids; measuring error is ±0.2.
403
Figure 3. Apparent viscosity curves of some peloid samples.
ÇELİK KARAKAYA et al. / Turkish J Earth Sci
404
Figure 4. Apparent viscosity curves of the pure clay minerals.
ÇELİK KARAKAYA et al. / Turkish J Earth Sci
405
ÇELİK KARAKAYA et al. / Turkish J Earth Sci
nonclay materials and low smectite (montmorillonite)
contents. Because the plasticity provides information on
how the material will behave and change shape when
applied, the suitability of the components should be
analyzed. Plasticity is related to the mineral type, water
content, grain size, and CEC of clay minerals. Materials
with low plasticity show poor adhesion to the skin surface,
so they easily flow through the skin and thermal therapy
effects on the body will be low. Snethen et al. (1977)
stated that the liquid limit and plasticity index are the best
indicators of potential swelling and classified the swelling
potential of the material as low, intermediate, or high
swelling capacity. When the limits given by Snethen et al.
(1977) are taken into account, samples other than P-6/1, 8,
11, 15, and 19 have low swelling potential, and the others
have intermediate or high potential. The experimentally
determined swelling percentage is generally comparable
with the swelling potentials (Table 1).
Skempton (1953) reported AI values of 0.3–0.5 for
kaolinite, 0.5–1.2 for illite, 0.5–1.2 for palygorskite, and
1.5–7.0 for montmorillonite. He also classified clays
according to the AI values as AI < 0.75 for inactive clays,
0.75 < AI < 1.25 for normal clays, and AI > 1.25 for active
clays. Apart from two peloid samples (P-2 and 16), the
AI in all peloids is <1.25, reflecting inactive clays. Four
peloids (P-1/1, 6, 12, and 17) were defined as normal clays,
while the other peloids were defined as inactive clay or
peloids with low montmorillonite content (Skempton,
1953; Mitchell, 1976). When inactive peloid samples are
mixed with water, they will show low swelling ratios. The
workability of the material depends on the consistency
and activity index, and it is important to determine the
properties that create problems when in contact with skin.
It is clear from the limits given above that workability
increases with an increase in montmorillonite. For that
reason, soft or semihard peloids are advisable, but fluid or
very soft peloids are difficult to keep in place on the skin
due to their fluidity. Hard peloids are not suitable for use as
pastes, masks, or bandages. High moisture percentage was
generally found in samples with high smectite content.
Some of the samples with high smectite content showed
relatively low swelling capacities, possibly due to the
smectite being Ca-smectite. The swelling potential of one
the samples is less than 50%, whereas the others were high
(apart from P-3 and 10). Pastes with high clay mineral
content show a high swelling potential and can retain large
quantities of water and heat, making them suitable for
use in pelotherapy (Yvon and Ferrand, 1996). Therefore,
clay-rich peloids with a high moisture content also have a
high smectite content and consequently high CEC values
(Veniale et al., 2004).
The higher abrasivity of samples P-5/1, 10, 14, 15, 20,
and 20/1 may be related to the high content of detrital
406
tectosilicates and nonclay minerals (Tables 1 and 2). The
hardness of the minerals, i.e. quartz, feldspar, dolomite,
and pyrite, in the samples may lead to too much abrasion.
Therefore, these samples may cause some discomfort
or irritation when used as masks (Rebelo et al., 2011).
The abrasivity of the peloid samples is higher than or
comparable to that of the pure clay samples. The low
abrasivity of the clay minerals may be related to their low
hardness and particle size and micromorphology (platy
shapes and pseudospherical aggregates) (Klinkenberg
et al., 2009; Rebelo et al., 2011). The types and amounts
of hard minerals and the degree of rounding or grinding
of sharp edges also have great influence on the abrasivity
(Klinkenberg et al., 2009). It is recommended that the
abrasivity of a clay material for application onto skin
should not exceed 200 g/m2 at 43,500 rpm (Gomes, 2002;
Rebelo et al., 2011). Thus, nearly all of the peloid samples
can be considered as suitable peloids without producing an
undesirable sensation, except for P-10, 20, and 20/1. The
pure clay minerals show the lowest abrasivity. Therefore,
they do not cause any irritation or scratching of the skin.
The lower abrasivity of sepiolite and kaolinite than of illite
and smectite may be related to their micromorphologies.
Clay pastes used in pelotherapy should have apparent
viscosities of approximately 4 Pa s at 10 rpm and peloids
with very low viscosities are not suitable for use in therapy
(Cara et al., 2000b; Yvon and Ferrand, 1996). Viscosities
closest to this value were measured in samples P-1, 1/1, 6/1,
15, and 16. Samples 2, 5, 6/2, 7, 11, 12, and 19 were fairly
close (Table 4; Figure 3). Furthermore, samples P-6/1, 11,
13, 17, 20, and 20/1 showed increased thixotropic values
after 24 h, demonstrating that the peloid material tends
to solidify over time. The materials in the samples show
decreasing thixotropy (P-1, 2, 3, and 6/2) and tend to
become partially fluid over time. The apparent viscosity
curve shows a sudden decrease in the shear stress at 20
rpm; the dispersions have a thixotropic character. This
causes the peloids to flow when mixed with water and
preserves their shape when applied to the skin (Viseras et
al., 2006). This behavior of the materials shows that the
clays are suitable for many semisolid medical/cosmetic
creams, ointments, pastes, gels, and makeup (Rebelo et
al., 2011). The increase in the viscosity values after 24 h
could cause difficulties for the removal of the material
from the skin, working, and drying. The viscosity and
thixotropic properties are important for choosing a peloid.
The thixotropic properties cause solid particles to remain
in suspension and resist sinking. These properties decrease
when the suspension becomes active and increase when
the suspension is inactive. Samples P-3, 6/2, 13, and
14, and partially 15, have very low thixotropic values
compared with the other peloid samples. Samples P-8, 11,
18, and 20/1 have thixotropic values higher than the other
ÇELİK KARAKAYA et al. / Turkish J Earth Sci
samples (Table 4). A high viscosity in peloids could mean
that the peloid cannot be not spread evenly on the skin
and will crack in a shorter time. Very high viscosity and
thixotropy, however, make the peloid too sticky (fluidity is
very reduced) and therefore shaping/working the peloid is
more difficult, drying times are longer, removal from the
skin after drying is harder, and removal from the container
(or storage) is more difficult, an unwanted situation.
In the literature, CEC values of various clay minerals
vary depending on structural properties from 10 to 160
meq/100 g (Grim, 1968). The clay minerals with the
highest CEC values are the smectite and vermiculite
group minerals. Other clay minerals have a CEC value of
10–50 meq/100 g (Grim, 1968). There is an intermediately
positive (r = 0.82) correlation between CEC and the
smectite content of the studied samples. The smectite
minerals are accepted as the clay minerals with the highest
ion exchange capacity (Grim, 1968). The CEC values of the
studied peloids are lower than those of the clays used as
peloids by Veniale et al. (2004) (virgin clay = 63), but many
samples have higher values than Benetutti mud (Cara et
al., 2000a) and Morinje mud (Mihelčić et al., 2012) (Table
3). The CEC of peloids suitable for the use in therapy was
given by Rebelo et al. (2005) and Quintela et al. (2012)
as 16–25 meq/100 g and 10–30 meq/100 g, respectively.
Therefore, the majority of the investigated samples are
suitable because their CEC values are above these results.
High moisture capacity is an important characteristic of
medicinal muds. High values of CEC permit the mud
to trap a higher amount of these elements, e.g., Ca, Mg,
and Sr (Karakaya et al., 2010). Compared with other clay
minerals commonly used for therapeutic or cosmetic
purposes, the investigated samples have higher CEC than
kaolinite (5–15 meq/100 g) and a value similar to illite and
sepiolite (10–40 and 10–45 meq/100 g, respectively), but
lower than that of montmorillonite (80–120 meq/100 g)
(Christidis, 2011). Especially when applied directly to the
skin, the peloids with high CEC can play a role in removing
toxins, bacteria, and unwanted components by absorbing
them but can also carry a health risk as this can change
the compounds into harmful compounds (Carretero et al.,
2006, 2007; Tateo and Summa, 2007; Matike et al., 2011).
Peloids with CEC values lower than 15 meq/100 g have
a low absorption capacity and cannot absorb ions from the
skin, but they also can transfer some ions from the peloid
to the skin depending on the concentration (Matike et al.,
2011).
The oil absorption capacity can be used to eliminate
excessive oil and toxins from the skin. It is used effectively
in the treatment of skin conditions such as boils, acne,
ulcers, abscesses, and seborrhea (increased secretion from
the sebaceous glands) (Carretero et al., 2006). Peloids
with high oil absorption and moisture capacity can cause
dryness of the skin and therefore should not be kept
on the skin for a long period of time in the case of dry
skin types. The water retention/absorption capacity and
similarly the moisture content are parameters related to
the organic matter and smectite content and should be
considered when packaging and applying the peloid to the
skin. The positive relationship between the oil absorption
and the moisture content of peloid samples is related to
the clay minerals, specifically to the smectite content. As
a result, the oil and partially the moisture capacity do not
have an apparent relationship with the oil absorption time
and absorption can take longer for materials with higher
capacity. Therefore, the oil absorption capacity should
be taken into account when the application method is
considered, especially for skin treatments. Peloids with
high oil absorption capacity are useful for the absorption
of excess oils from oily skin or skin with acne when they
are used as masks or bandages. However, they may be
unsuitable for normal to dry skin because they may cause
too much drying and loss of the natural moisture of the
skin. Such peloids, when mixed with pure smectite, will
not be a problem for normal to dry skin and will not cause
dryness.
Smectite-rich peloid and pure smectite and sepiolite
samples have high BET surface areas. The low BET
values of kaolinite and illite samples may be related to
nonexpanding properties and having only external surfaces
of the minerals. The BET surface areas of the minerals vary
from 10 to 70 m2/g, while smectite group minerals have
extensive internal as well as external surfaces, giving high
specific surfaces areas (800 m2/g; Carter et al., 1986). Low
BET values of some smectite-rich peloids may be sourced
from low particle size, low layer charge, pore water
chemistry, and particle aggregation (Yong and Warkentin,
1975). Preparing peloids from low CEC and BET clays is
unsuitable for skin cleansing, while clay with high CEC
is more suitable for removing toxins, bacteria, and other
unwanted components from the skin. Sepiolite with high
BET can be added to peloid materials for use in treating
some skin problems (acne, seborrhea, eczema, etc.).
5. Conclusions
The viscosities of some of the peloids are higher or lower
than the viscosity values required. Sepiolite showed the
highest values, and its use in large quantities in peloids
is therefore unsuitable. The Na-Ca-smectite has a more
suitable viscosity. Spa centers using or planning peloid
therapy should take the characteristics of peloids, such
as unsuitable physical parameters, into account. The
variations of the CEC of different peloid types are due to
the clay mineral content. Peloids should be prepared from
clays with high CEC and BET values, which are more
suitable for removing toxins, bacteria, and other unwanted
407
ÇELİK KARAKAYA et al. / Turkish J Earth Sci
components from the skin. Sepiolites can be added to peloid
materials for the use in treating some skin problems (acne,
seborrhea, eczema, etc.). Peloids with high oil absorption
properties are not suitable for use on normal to dry skin
or skin without an acne problem because they will cause
the skin to dry excessively and the natural moisture will be
reduced. The viscosity of pure sepiolite is higher than that
of the other clay minerals, while kaolinite shows the lowest
viscosity. The viscosity of some peloids is not appropriate
for therapeutic application. All samples displayed an
increase in viscosity after 24 h. The viscosity values were
too low in Ca-smectite and kaolinite, and partially in
illite, for the use as peloids. The abrasivity of most of the
peloids is appropriate for use in masks or bandages and
pure clay minerals can be added to the peloids to prepare
more suitable materials. Finally, the usage areas of peloids
should be determined on the basis of their clay types and
physicochemical features.
Acknowledgments
The project was funded by the Scientific and Technological
Research Council of Turkey (TÜBİTAK 110Y033) and the
Selçuk University Scientific Research Projects support
program (BAP 11401045).
References
ASTM (1994). Annual Book of ASTM Standards, Standard Test
Methods for Laboratory Determination of Liquid Limit, Plastic
Limit and Plasticity Index of Soil, D 4318. Philadelphia, PA,
USA: ASTM.
ASTM (2010). Standard D2196-10: Standard Test Methods for
Rheological Properties of Non-Newtonian Materials by
Rotational (Brookfield Type) Viscometer. West Conshohocken,
PA, USA: ASTM International.
Carretero MI, Pozo M (2010). Clay and non-clay minerals in the
pharmaceutical and cosmetic industries. Part II. Active
ingredients. Appl Clay Sci 47: 171-181.
Carretero MI, Pozo M, Martin-Rubi JA, Pozo E, Maraver F (2010).
Mobility of elements in interaction between artificial sweat and
peloids used in Spanish spas. Appl Clay Sci 48: 506-515.
Bain JA (1971). A plasticity chart as an aid to the identification and
assessment of industrial clays. Clay Miner 9: 1-17.
Carretero MI, Pozo M, Sánchez C, Garcia FJ, Medina JA, Bernabé
JM (2007). Comparison of saponite and montmorillonite
behavior during static and stirring maturation with sea water
for pelotherapy. Appl Clay Sci 36: 161-173.
Bettero A, Marcazzan M, Semenzato A (1999). Aspetti reologici
e tensiometrici di matrici fangose di impiego termale e
cosmetico. Proposta di un protocollo per la loro qualificazione.
Acta Mineral Petrogr 42: 277-286 (in Italian).
Carter DL, Mortland MM, Kemper WD (1986). Specific surface. In:
Klute A, editor. Methods of Soil Analysis, Part 1, Agronomy
Monograph 9. Madison, WI, USA: Soil Science Society of
America, pp. 413-423.
Brunauer S, Emmett PH, Teller E (1938). Adsorption of gases in
multimolecular layers. J Am Chem Soc 60: 309-319.
Busenberg E, Clemency CV (1973). Determination of the cation
exchange capacity of clays and soils using an ammonia
electrode. Clay Clay Miner 21: 213-217.
Cara S, Cargangiu G, Padalino G, Palomba M, Tamanini M (2000a).
The bentonites on pelotherapy: chemical, mineralogical and
technological properties of materials from Sardinia deposits
(Italy). Appl Clay Sci 16: 117-124.
Çelik M, Karakaya N, Temel A (1999). Occurrences of clay minerals
in hydrothermally altered volcanic rocks, Eastern Pontides,
Turkey. Clay Clay Miner 47: 708-717.
Christidis GE (2011). Industrial minerals: significance and
important characteristics. In: Christidis GE, editor. Advances
in the Characterization of Industrial Minerals. EMU Notes in
Mineralogy. Jena, Germany: European Mineralogical Society,
pp. 341-414.
Cara S, Cargangiu G, Padalino G, Palomba M, Tamanini M (2000b).
The bentonites on pelotherapy: Thermal properties of clay
pastes from Sardinia (Italy). Appl Clay Sci 16: 125-132.
Dolmaa G, Tserenpil S, Ugtakhbayar O, Shevchenko SG, Kliba LV,
Voronkov MG (2009). Characterization and organic compounds
in peloids from Mongolia. Proceedings of the Mongolian
Academy of Sciences 49: 3-21.
Carretero MI (2002). Clay minerals and their beneficial effects upon
human health: a review. Appl Clay Sci 21: 155-163.
Gomes C (2002). Argilas: aplições na indústria Aveiro, Portugal: O
Liberal - Empresa de Artes Gráficas (in Portuguese).
Carretero MI, Gomes C, Tateo F (2006). Clays and human health.
In: Bergaya F, Theng BKG, Lagaly G, editors. Handbook of
Clay Science. Developments in Clay Science. Amsterdam, the
Netherlands: Elsevier, pp. 717-741.
Carretero MI, Pozo M (2007). Mineralogía Aplicada: Salud y Medio
Ambiente. Madrid, Spain: Ediciones Paraninfo (in Spanish).
Carretero MI, Pozo M (2009). Clay and non-clay minerals in the
pharmaceutical industry. Part I. Excipients and medical
applications. Appl Clay Sci 1: 73-80.
408
Gomes C, Silva J (2007). Minerals and clay minerals in medical
geology. Appl Clay Sci 36: 4-21.
Gomes CSF, Silva JBP, Gomes JHC (2015). Natural peloids versus
designed and engineered peloids. Bol Soc Esp Hidrol Méd 30:
15-36.
Grim RE (1968). Clay Mineralogy. New York, NY, USA: McGraw-Hill.
Holtz RD, Kovacs WD (1981). An Introduction to Geotechnical
Engineering. London, UK: Prentice-Hall.
ÇELİK KARAKAYA et al. / Turkish J Earth Sci
Karakaya MÇ, Karakaya N, Bakır S (2011a). Some properties and
potential applications of the Na- and Ca-Bentonites of Ordu
(N.E. Turkey). Appl Clay Sci 54: 159-165.
Karakaya MÇ, Karakaya N, Küpeli Ş (2011b). Mineralogical and
geochemical properties of the Na- and Ca-bentonites of Ordu
(N.E. Turkey). Clay Clay Miner 59: 75-94.
Karakaya MÇ, Karakaya N, Küpeli Ş, Yavuz F (2012). Properties of
hydrothermal alteration in the vicinity of volcanogenic massive
sulfide deposits in northeast Turkey. Ore Geol Rev 48: 197-224.
Karakaya MÇ, Karakaya N, Sarıoğolan Ş, Koral M (2010). Some
properties of thermal muds of some spas in Turkey. Appl Clay
Sci 48: 531-537.
Karakaya MÇ, Karakaya N, Temel A (2001). Kaolin occurrences in
Erenler Dağı volcanics, southwest Konya province, Turkey. Int
Geol Rev 43: 711-722.
Karakaya MÇ, Karakaya N, Vural HC (2016a). Microbiological
viewpoint to pelotherapy from Turkey. Ulutas Medical Journal
22: 107-116.
Karakaya MÇ, Karakaya N, Vural HC (2016b). Thermal properties
of some Turkish peloids and clay minerals for their use in
pelotherapy. Geomaterials 6: 79-90.
Karakaya N, Karakaya MÇ, Temel A (2011). Mineralogical and
geochemical characteristics and genesis of the sepiolite deposits
at Polatlı Basin (Ankara, Turkey). Clay Clay Miner 59: 286-314.
Klinkenberg M, Rickertsen N, Kaufhold S, Dohrmann R, Siegesmund
S (2009). Abrasivity by bentonite dispersions. Appl Clay Sci 46:
37-42.
Lopez E, Rousseau M, Bourrat X (2008). La Nacre, les biominéralisations
et la pharmacopée. Biofutur 27: 53-56 (in French).
Lopez-Galindo A, Viseras C, Cerezo P (2007). Compositional,
technical and safety specifications of clays to be used as
pharmaceutical and cosmetic products. Appl Clay Sci 36: 51-63.
Matike DME, Ekosse GIE, Ngole VM (2011). Physico-chemical
properties of clayey soils used traditionally for cosmetics in
Eastern Cape, South Africa. Int J Phys Sci 6: 7557-7566.
Means RE, Parcher JW (1963). Physical Properties of Soils. Columbus,
OH, USA: Charles E. Merrill.
Mihelčić G, Kniewald G, Ivanišević G, Čepelak R, Mihelčić V, Vdović
N (2012). Physico-chemical characteristics of the peloid mud
from Morinje Bay (eastern Adriatic coast, Croatia): suitability
for use in balneotherapy. Environ Geochem Hlth 34: 191-198.
Mitchell JK (1976). Fundamentals of Soil Behavior. New York, NY,
USA: John Wiley and Sons.
Mitchell JK (1993). Fundamentals of Soil Behavior. New York, NY,
USA: John Wiley and Sons.
Quintela A, Terroso D, Ferreira da Silva E, Rocha F (2012).
Certification and quality criteria of peloids used for therapeutic
purposes. Clay Miner 47: 441-451.
Rebelo M, Gonçalves P, Silva E, Rocha F (2005). Studies on physical
and chemical properties of some Portuguese Mesocenozoic
clayey formations traditionally used as curative or healing
materials. Acta Geodyn Geomater 2: 151-155.
Rebelo M, Viseras C, López-Galindo A, Rocha F, Ferreira da Silva E
(2011). Rheological and thermal characterization of peloids
made of selected Portuguese geological materials. Appl Clay Sci
51: 219-227.
Şimşek Ş (2015). Geothermal developments in the world and Turkey.
In: III. Geothermal Resources Symposium Proceedings, pp. 1-17
(in Turkish with an abstract in English).
Singer A, Galan E (1984). Palygorskite-Sepiolite. Occurrences, Genesis
and Uses. Developments in Sedimentology 37. Amsterdam, the
Netherlands: Elsevier.
Skempton AW (1953). The colloidal activity of clays. In: Proceedings
of the Third International Conference on Soil Mechanics and
Foundation Engineering, pp. 57-61.
Snethen DR, Johnson LD, Patrick DM (1977). An Evaluation of
Expedient Methodology for Identification of Potentially
Expansive Soils. Rep. No. FHWA-RE-77-94, NTIS PB-289-164.
Washington, DC, USA: Federal Highway Administration.
Summa V, Tateo F (1998). The use of pelitic raw materials in thermal
centres: mineralogy, geochemistry, grain size and leaching tests.
Examples from Lucania area (Southern Italy). Appl Clay Sci 12:
403-417.
Tateo F, Summa V (2007). Element mobility in clays for healing use.
Appl Clay Sci 36: 67-76.
Turkish Standards Institution (1978). TS 3245 Methods for the Analysis
of Ceramic Whiteware Clays-Determination of Moisture and
Loss on Ignition Contents. Ankara, Turkey: TSI (in Turkish).
Turkish Standard (1997). TS 2583 EN ISO 787-5 General Methods of
Test for Pigments and Extenders-Part 5: Determination of Oil
Absorption Value. Ankara, Turkey: TSI.
Veniale F, Barberis E, Carcangiu G, Morandi N, Setti M, Tamanini M,
Tessier D (2004). Formulation of muds for pelotherapy: effects
of “maturation” by different mineral waters. Appl Clay Sci 25:
135-148.
Veniale F, Better A, Jobstraibizer P, Setti M (2007). Thermal muds:
perspective of innovations. Appl Clay Sci 36: 141-147.
Viseras C, Cerezo P, Mirchandani JN, Aguzzi C, López-Galindo A
(2006). Efecto de la “maduración” en las propriedades reológicas
de peloides empleados en balneários españoles e influencia en la
mineralogia y textura del componente arcilloso. In: Suárez M,
Vicente MA, Rives V, Sánchez MJ, editors. Materiales Arcillosos:
de la Geologia a las Nuevas Aplicaciones. Armilla, Spain:
Sociedad Española de Arcillas, pp. 279-290 (in Spanish).
Viseras C, López-Galindo A (1999). Pharmaceutical applications of
some Spanish clays (sepiolite, palygorskite, bentonite): some
preformulation studies. Appl Clay Sci 14: 69-82.
Whitney DL, Evans BW (2010). Abbreviations for names of rockforming minerals. Am Mineral 95: 185-187.
Yong RM, Warkentin BP (1975). Soil Properties and Behaviour. New
York, NY, USA: Elsevier.
Yvon J, Ferrand T (1996). Preparation ex-situ de peloides. Proprietés
thermiques, mecaniques et d’exchange. In: Veniale F, editor.
Argille Curative, Salice Terme PV (Italy). Milan, Italy: Atti
Conv., Tipografia Trabella, pp. 67-78 (in French).
409