The risk of typhoon and storm surge along the coast of Vietnam
Bạn đang xem bản rút gọn của tài liệu. Xem và tải ngay bản đầy đủ của tài liệu tại đây (1.1 MB, 10 trang )
Vietnam Journal of Marine Science and Technology; Vol. 19, No. 3; 2019: 327–336
DOI: /> />
The risk of typhoon and storm surge along the coast of Vietnam
Nguyen Ba Thuy
Vietnam National Hydro-meteorological Forecasting Center, Hanoi, Vietnam
E-mail:
Received: 20 April 2019; Accepted: 16 June 2019
©2019 Vietnam Academy of Science and Technology (VAST)
Abstract
The history (1951–2016) and the risk of typhoon and storm surge in coastal areas of Vietnam are analyzed
and evaluated based on the observation data, results of statistical and numerical mo dels. The Monte Carlo
method was used to construct a bogus typhoon. A coupled numerical model of Surge, Wave and
Tide (called SuWAT) was used for simulation of storm surge. The results show that in the period of
1951–2016 there were many typhoons which landed and induced high storm surge on the coast of the
North and the North of Center of Vietnam. During one thousand years, there have been 4,678 typhoons
entering the coastal zone from Quang Ninh to Ca Mau. In particular, the most severe typhoon in coastal
area from Quang Ninh to Thanh Hoa is at level 16 (Beaufort scale), Nghe An - Quang Tri at level 16,
Quang Binh - Phu Yen at level 17, Binh Dinh - Ninh Thuan at level 15 and Binh Thuan - Ca Mau at level
13. The coastal areas with highly vulnerable storm surge are provinces from Quang Ninh to Hai Phong
(4.5 m), Thanh Hoa to Nghe An (4.0 m), Quang Tri (5.0 m). The results of this study are the basis for the
preparation to cope with strong/super typhoon in the coast of Vietnam.
Keywords: Typhoon, storm surge, Monte Carlo, SuWAT.
Citation: Nguyen Ba Thuy, 2019. The risk of typhoon and storm surge along the coast of Vietnam. Vietnam Journal of
Marine Science and Technology, 19(3), 327–336.
327
Nguyen Ba Thuy
INTRODUCTIONS
Typhoon
is
a
dangerous
hydrometeorological disaster whose consequences
are coastal inundation, erosion and saltwater
intrusion caused by storm surge in combination
with high tide and wave. Especially in the
context of climate change, it is stated that there
will be many strong/super typhoons which
could influence the mainland of Vietnam. The
world has witnessed several strong typhoons
causing flooding in coastal areas on a large
scale, resulting in human and property damage,
including hurricane Katrina in New Orleans
state (the US) in August 2005, and typhoon
Nargis in Myanmar in May 2008 and especially
the recent typhoon Haiyan with level 17 across
the Philippines in November 2013 causing
severe damage mainly due to storm-surgeinduced inundation. The coastal areas of
Vietnam have also recorded typhoons that
cause strong winds, high waves and high storm
surge such as typhoons Dan (1989), Becky
(1999), Damrey (2005), Xangsane (2006),
Ketsana (2009) (Chien, 2016).
Study on typhoon and storm surge has been
conducted for a long time, mainly focusing on
numerical model for operational forecasting.
The risk assessment of storm surge due to the
impact of climate change currently attract the
interest in some countries such as Japan and
South Korea, which suffer damages from
typhoon and storm surge. Accordingly, storm
surge is calculated by synthetic typhoon data
from the global storm statistics model,
previously verified with historical storm data
[1]. These results provide elementary
information on planning and designing coastal
facilities and mitigations. On the other hand, in
the developed countries such as the United
States, Canada, Australia, the European Union,
Japan, and Taiwan the risk assessment of
natural disasters including typhoon and storm
surge has been studied to develop response
strategies. In the United States, scientists have
used simulation data of 2,000 years of typhoons
from 100 year historical typhoon data as input
to the storm surge model and constructed a
storm surge frequency curve for repeated
cycles from 2 to 100 years [2]. In Vietnam,
Manh et al., (2010) has constructed a set of data
328
on tides, storm surge and total water levels
(tide+storm surge) along the coast from Quang
Ninh to Quang Nam. In particular, the
statistical set of storms is established by the
Monte Carlo method based on the probability
distribution of the typhoon parameters
occurring in the past. In this way, Uu et al.,
(2009) [3] have combined statistical methods
and numerical models to calculate and analyze
extreme storm surge with respect to sea level
rise due to impacts of climate change in the
coastal areas and islands of Vietnam. Most
recently, Chien (2016) [4] calculated the risk of
storm surge from the coastal area from Quang
Binh to Quang Nam based on the bogus
typhoon data for 1,000 years, which is
determined by the Monte Carlo method.
In order to have a scientific basis for the
preparation to deal with strong/super typhoon
affecting Vietnam, the government has recently
asked the hydro-meteorological sector to study
the risk of typhoon and storm surge for each
coastal zone of Vietnam. In this study, typhoon
and storm surge, which occurred during the
period of 1951–2016, as well as the possibility
of super/strong typhoon and storm surge in the
coastal areas of Vietnam were analyzed. In
addition to historical typhoon data for the
period 1951–2016, a set of bogus typhoons in
1,000 years has been constructed using the
Monte Carlo method. A coupled numerical
model of Surge, Wave and Tide is used to
simulate storm surge in historical and bogus
typhoons.
STUDY AREAS AND METHODS
Study areas
The study area is the coastal area from
Quang Ninh to Ca Mau. Due to the change in
geographic location, climate, terrain and tides,
the frequency, duration and intensity of
typhoon and storm surge are various. The
history and risk of typhoon and storm surge are
analyzed for each coastal area of Vietnam.
Research methods
Statistical methods are used to analyze
storm characteristics in each region.
Meanwhile, the Monte Carlo method is used to
determine the possibility of occurrence of
super/strong typhoon in each area and used as
The risk of typhoon and storm surge along the coast
input data for storm surge simulation. Based on
the Monte Carlo method, a set of bogus
typhoons for 1,000 years has been constructed.
The theoretical basis of the Monte Carlo
method is based on the probability distribution
of the historical typhoon parameters to build a
set of bogus typhoons for many years [2–4].
The typhoon data in the period from 1951 to
2016 were collected at the National Center for
Hydro-meteorological Forecasting and from the
website of the Japan Meteorological Agency.
Storm surge was calculated by SuWAT model.
The theoretical basis and calibration of the
SuWAT model in the study area was presented
in detail in the works of Kim et al., (2010) [5],
Chien (2016) [4], Thuy et al., (2017) [6]. In this
study, the SuWAT model was designed on
rectangular grids and three domains to simulate
storm surge. Information about the domains
and grids is shown in table 1.
Table 1. Information of computational domains
Area
North of Vietnam
Domain number
D1
D2
D3
Center of Vietnam
D1
D2
D3
South of Vietnam
D1
D2
D3
Computational Domain
103–120oE, 6–22oN
105–110.5oE, 16–21.5oN
106–107.5oE, 20.0–21.0oN
(for typhoon hitting Hai Phong )
103–120oE, 6–22oN
106–111oE, 12.0–18.5oN
107.5–109oE, 15.5–16.5oN
(for typhoon hitting Da Nang)
103–120oE, 6–22oN
105–110oE, 8.0–13.0oN
106.3–107.6oE, 9.7–10.7oN
(for typhoon hitting Vung Tau)
For the simulation of storm surge, the wind
and pressure fields were calculated from
empirical typhoon model [7]. According to
previous study [6] tides only have a significant
effect on storm surge when typhoon landfall
occurs during spring tides. Meanwhile, storm
waves caused most significant effects on storm
surge in strong/supper typhoon. As a
consequence, the results of storm surge for all
historical typhoons take into account the effect
of tide, surge and wave. For the case of bogus
typhoons, the effect of tide was not considered
due to unknown landfall time.
HISTORY AND THE RISK OF TYPHOON
AND STORM SURGE IN COASTAL
AREAS FROM QUANG NINH TO CA MAU
History of typhoon and storm surge in
coastal areas from Quang Ninh to Ca Mau
The present status of typhoon and storm
surge is understood as typhoon and storm surge
that have occurred in the area. In order to
assess the present status of typhoon affecting
Num.Grid (m)
226 × 211
181 × 241
Grid Size
7,400 × 7,400
1,850 × 1,850
181 × 121
925 × 925
226 × 211
301 × 361
7,400 × 7,400
1,850 × 1,850
181 × 121
925 × 925
226 × 211
301 × 301
7,400 × 7,400
1,850 × 1,850
157 × 121
925 × 925
the coastal areas from Quang Ninh to Ca Mau,
the typhoon data in the period of 1951–2016
were analyzed by location of landfall and
intensity for each area. To assess storm surge in
the area, not only typhoons with eyes across
area but also those with eyes outside the area,
which are likely to cause significant storm
surge in the area are included. Table 2 shows
the number of typhoons affecting areas in the
East Sea and in Vietnam coast during the
period of 1951–2016. Accordingly, the number
of typhoons tends to decrease from North to
South. The coastal areas from Quang Ninh to
Ha Tinh experienced the highest number of
typhoons with 342 times, including two
typhoons at level 13. The area from Quang
Binh to Quang Nam witnessed the highest
number of typhoons at level 12–13. The coastal
provinces from Vung Tau to Ca Mau showed
the least number of typhoons, with only two
typhoons at level 12–13. The distribution of
typhoon by level in the East Sea and in
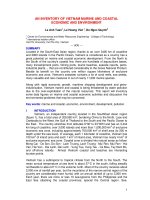
Vietnam is shown in fig. 1. Statistical analysis
329
Nguyen Ba Thuy
shows that during the first half of the typhoon
season, the typhoon directions tend to be
Northwest, North and Northeast, and have a
landfall in the Southeast China. In the rest of
the typhoon season, it tends to go to West of
Vietnam. On average, from January to May,
typhoons are less likely to affect Vietnam.
From June to August, typhoons are more likely
to affect the North. From September to
November, typhoons are more likely to affect
the Center and South of Vietnam. In the first
half of the typhoon season, the track of typhoon
is less complicated; however, the track of
typhoon is often more complicated in the
second half of the typhoon season.
(a)
(b)
(c)
Fig. 1. The track of typhoons in the East Sea of Vietnam: (a) Level 8–11, (b) Level 12–13,
(c) Level 13 and higher
Table 2. The number of typhoons affecting areas of the East Sea
and coastal area of Vietnam in the period of 1951–2016
Areas
Quang Ninh - Ha Tinh
Quang Binh - Phu Yen
Khanh Hoa - Binh Thuan
Vung Tau - Ca Mau
North East Sea
Central East Sea
South East Sea
Total
330
Level 8–11
317
307
94
46
1,816
747
144
3,471
Level 12–13
23
55
12
2
339
97
6
534
≥ Level 13
2
11
1
0
90
41
0
145
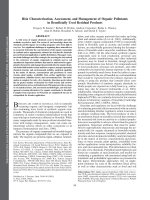
The risk of typhoon and storm surge along the coast
(a) Quang Ninh - Thanh Hoa
(b) Nghe An - Quang Binh
(c) Quang Tri - Quang Ngai
(d) Binh Dinh - Ninh Thuan
(e) Binh Thuan - Ca Mau
Fig. 2. Distribution of maximum storm surge in the period of 1951–2016
Due to the lack of storm observation data,
the way using the numerical model with high
reliability is most suitable for assessment of
storm surge in the area. Fig. 2 shows the
distribution of largest storm surge in coastal
areas during 1951–2016, and it is divided into 5
regions: Quang Ninh - Thanh Hoa (a), Nghe An
- Quang Binh (b), Quang Tri - Quang Ngai (c),
Binh Dinh - Ninh Thuan (d), Binh Thuan - Ca
Mau (e). This is the highest storm surge
determined by the numerical model for all
typhoons entering Vietnam’s coast in the
period of 1951–2016. Accordingly, in coastal
areas from Quang Ninh to Thanh Hoa, storm
331
Nguyen Ba Thuy
with height of 3.0 m has appeared in some
provinces such as Quang Ninh, Hai Phong,
Thai Binh and Nam Dinh. Most of these areas
experienced a storm surge of 2.0 m in height.
Some of the typhoons in the area causing high
storm surge include Frankie (1996), Damrey
(2005) and Kalmaegy (2014). In the coastal
zone from Nghe An to Quang Binh, many
typhoons have caused high storm surge such as
DAN (1989) landing in Ha Tinh, Becky (1990)
landing in Nghe An, Harriet (1971) landing in
Quang Tri. In which, although typhoon Harriet
had a landfall in Quang Tri, it caused a sea
level rise over 2.0 m in some areas in Southern
Quang Binh. The South of this area saw higher
storm surge than in the North, the highest up to
4.0 m. In the coastal zone from Quang Tri to
Quang Ngai, the height of storm surge
decreases from the North to the South with the
decline in frequency and intensity of typhoon in
the area. In the north coast, there are many
strong typhoons hitting the coast causing high
storm surge such as typhoons Harriet (1971),
Cecil (1985), Betty (8/1987), Xangsane
(September 2006), Ketsana (September 2009)
causing a rise of over 2.0 m. In which typhoon
Harriet (7/1971) caused a storm surge over 4 m
in Quang Tri. In coastal areas from Quang Ngai
to Ninh Thuan, storm surge also tends to
decrease in level from North to South. The
storm surge up to 1.0 m is mainly located in the
north of the area. The storm surge in this area is
low due to two reasons: Firstly, this is the area
with few strong typhoons, although in fact a
strong typhoon landed in this area but its
direction is not favorable to cause high storm
surge (typhoon Durian, 2006 moved obliquely
to the shoreline); secondly, its deep sea and
steep bed slope reduce the increase of storm
surge. The coastal area from Binh Thuan to Ca
Mau is very little impacted by typhoon,
however, recent storm surge up to 1.5 m (in
Ghenh Hao) during typhoon Linda (1997) was
recorded. The number of strong typhoons is
small, but this area has shallow water depth,
therefore many places in this area have faced
the surge of 2.0 m.
The risk of typhoon and storm surge form
Quang Ninh to Ca Mau
Based on the probability distribution
functions of the obtained historical typhoon
parameters, a set of bogus typhoons for 1,000
years has been constructed, including 6,213
typhoons, in which 4,678 typhoons hit the coast
of Vietnam from Quang Ninh to Ca Mau. The
average number of typhoons entering the
Quang Ninh - Ha Tinh waters is 2.35 per year;
the waters of Quang Binh - Phu Yen have
experienced 1.48 typhoons/year; and those
from Khanh Hoa to Binh Thuan and from Vung
Tau to Ca Mau are 0.50 and 0.36, respectively.
Table 3. Statistics of typhoons for 1,000 years by Beaufort scale (the number of
typhoon/percentage) in four areas from Quang Ninh to Ca Mau
Beaufort
scale
Tropical
depression
8
9
10
11
12
13
14
15
16
17
Total
332
Study Areas
Quang Ninh - Ha Tinh
Quang Binh - Phu Yen
Khanh Hoa - Binh Thuan
Vung Tau - Ca Mau
663/14.17%
413/8.83%
139/2.97%
105/2.24%
483/10.32%
505/10.80%
196/ 4.19%
144/ 3.08%
316/ 6.76%
18/ 0.38%
8/ 0.17%
6/ 0.13%
1/ 0.07%
330/ 7.05%
310/ 7.05%
122/ 2.61%
100/ 2.14%
183/ 3.91%
10/ 3.91%
7 / 0.15%
2/ 0.04%
1/ 0.02%
1/ 0.02%
1479/31.62
105/ 2.97%
112/ 2.39%
38 / 0.81%
24/ 0.51%
74/ 1.58%
1/ 0.02%
2/ 0.04%
2/ 0.04%
72/1.54%
78/1.67%
28/0.60%
29/0.62%
44/0.94%
6/0.13%
467/10.62
362/7.74%
2340/50.02
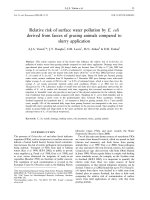
The risk of typhoon and storm surge along the coast
b)
a)
d)
c)
e)
Fig. 3. The track of bogus typhoon landfall at: Level 16 of Quang Ninh (a), level 15 of Quang
Binh (b), level 17 of Quang Tri (c), level 15 of Phu Yen - Khanh Hoa (d) and level 12
of Binh Thuan -Vung Tau (e)
333
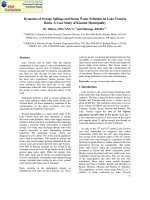
Nguyen Ba Thuy
(a)
(b)
(c)
(d)
(e)
Fig. 4. The distribution of highest storm surge in areas according to the bogus typhoon data:
(a) Quang Ninh - Thanh Hoa, (b) Nghe An - Quang Binh, (c) Quang Tri - Quang Ngai,
(d) Binh Dinh - Ninh Thuan and (e) Binh Thuan - Ca Mau
334
The risk of typhoon and storm surge along the coast
The statistical results of the number of
typhoons by Beaufort scale in four areas:
Quang Ninh - Ha Tinh; Quang Binh - Phu Yen;
Khanh Hoa - Binh Thuan and Vung Tau - Ca
Mau are shown in table 3. Accordingly, the
number of tropical cyclones is in parentheses,
while the next one is the corresponding
percentage in each area compared to the whole
coast of Vietnam from Quang Ninh to Ca Mau.
The results showed that in Quang Ninh - Ha
Tinh strongest typhoon at level 16 could occur,
particularly coastal areas from Quang Binh to
Phu Yen could have typhoon at level 17, the
Khanh Hoa - Binh Thuan waters could have
typhoon at level 15, and from Vung Tau to Ca
Mau the strongest typhoon appeared at level
13. Fig. 3 shows the orbits of some strongest
typhoons hitting the areas.
Based on the statistical summation of
typhoons in the 1,000 years, the risk of storm
surge is calculated for all typhoons hitting each
area. Fig. 4 shows the distribution of maximum
storm surge in the coastal areas of Quang Ninh
- Thanh Hoa (a), Nghe An - Quang Binh (b),
Quang Tri - Quang Ngai (c), Binh Dinh - Ninh
Thuan (d) and Binh Thuan - Ca Mau (e). The
results show that for each coastal area, the
storm surge does not follow a common trend
from North to South. The maximum storm
surge depends not only on typhoon parameters
(intensity and direction), but also on the terrain
(water depth, slope and shape of the coast line).
The areas with shallow water and gentle slope
often have higher storm surge. The whole
coastal zone from Quang Ninh - Thanh Hoa is
at the risk of surge over 3.0 m. Due to the high
number of strong typhoons concentrated in
Quang Ninh, Hai Phong and Thanh Hoa, these
areas are at higher risk of storm surge. The
highest storm surge may occur in Quang Ninh
and Hai Phong at 4.5 m, and in Thanh Hoa at
4.0 m. The coastal area of Nghe An, North of
Ha Tinh and Quang Binh have faced storm
surge at 4.0 m. In the coastal zone from Quang
Tri to Quang Ngai the areas with high storm
surge are Quang Tri, Hue and Da Nang bay. In
the southern part of Da Nang, Quang Nam and
Quang Ngai, the storm surge is smaller. The
storm surge in Quang Tri reaches the highest
level at 5.0 m. In the coastal zone from Binh
Dinh - Ninh Thuan, although present typhoon
at level 15 hit Khanh Hoa, storm surge is not
high (above 2.0 m) because this is deep water
area. In the coastal area of Southern Vietnam
(Binh Thuan - Ca Mau), except for Ca Mau, the
other areas are at risk of storm surge up to
2.0 m. In which, the risk of highest surge up to
2.5 m is concentrated in the coastal areas of
Vung Tau, Tien Giang and Bac Lieu.
The assessment of current status and risk of
typhoon and storm surge in Vietnam’s coastal
zone will serve as basis for the preparation to
cope with typhoon and storm surge in Vietnam.
CONCLUSIONS
In this study, the history and risk of
typhoon and storm surge in coastal areas from
Quang Ninh to Ca Mau were analyzed based on
observation data, statistical and numerical
modeling results. In addition to the typhoon
data in the period of 1951–2016, a set of bogus
typhoons for 1,000 years has been constructed
by using the Monte Carlo method to obtain
enough data to assess the risk of typhoon and
storm surge. The results can be summarized as
follows:
The number of typhoon tends to decrease
from North to South. In the period 1951–2016,
the coastal area from Quang Ninh - Ha Tinh
experienced the highest number with 342
typhoons, including two strongest typhoon of
level 13. The area of Quang Binh - Quang Nam
has recorded the strongest typhoons, at level
12–13. The coastal area from Vung Tau - Ca
Mau had the least number of typhoons, with
strongest ones at level 12–13. The coastal
provinces from Quang Ninh to Thanh Hoa
experienced storm surge up to 3.0 m. In the
South area of Nghe An - Quang Binh and the
North of Quang Tri to Quang Ngai, storm surge
can reach over 4.0 m. Binh Thuan - Ca Mau
also recorded storm surge up to 1.5 m.
In the 1,000 years there were 6,213
typhoons, in which 4,678 typhoons hit the
coastal region from Quang Ninh to Ca Mau, in
particular Quang Ninh - Thanh Hoa at level 16,
Nghe An - Quang Tri at level 16, Quang Binh Phu Yen at level 17, Binh Dinh - Ninh Thuan at
level 15 and Binh Thuan - Ca Mau at level 13.
335
Nguyen Ba Thuy
The risk of storm surge in the 1,000 year
period shows that the trend of storm surge is
not quite geographical and the areas with high
storm surge are Quang Ninh - Hai Phong
(4.5 m), Thanh Hoa - Nghe An (4.0 m), Quang
Tri (5.0 m). The coastal area of southern part is
also at risk of storm surge up to 2.5 m.
Acknowledgments: This research is funded by
Vietnam National Foundation for Science and
Technology Development (NAFOSTED) under
grant number 105.06-2017.07, which the
authors gratefully acknowledge.
REFERENCES
[1] Yasuda, T., Nakajo, S., Kim, S., Mase, H.,
Mori, N., and Horsburgh, K., 2014.
Evaluation of future storm surge risk in
East Asia based on state-of-the-art climate
change projection. Coastal Engineering,
83, 65-71.
[2] Manh, D. V., et al., 2010. Sea level
calculations for the design of coastal
works. Publishing House for Science and
Technology, Hanoi.
336
[3] Uu, D. V., et al., 2010. Assessment of
extreme sea level changes due to the
effects of climate change for the marine
economic strategy. Final Report KC09.23/06–10, Hanoi.
[4] Chien, D. D., 2016. Research on
calculating and assessing the magnitude of
storm surge in the sea from Quang Binh to
Quang Nam. Doctoral Thesis of
Oceanography, Hanoi University of
Sciences, Vietnam National University.
[5] Kim, S. Y., Yasuda, T., and Mase, H.,
2010. Wave set-up in the storm surge
along open coasts during Typhoon Anita.
Coastal Engineering, 57(7), 631–642.
[6] Thuy, N. B., Kim, S., Chien, D. D.,
Dang, V. H., Cuong, H. D., Wettre, C.,
and Hole, L. R., 2016. Assessment of
storm surge along the coast of central
vietnam. Journal of Coastal Research,
33(3), 518–530.
[7] Fujita, T., 1952. Pressure distribution
within typhoon. Geophysical Magazine,
23, 437–451.
[8] />nter/rsmc-hp-pub-eg/besttrack.html.