The effect of climate change on abundance and diversity of ant in Tuhaha forest at mollucas province on Indonesia
Bạn đang xem bản rút gọn của tài liệu. Xem và tải ngay bản đầy đủ của tài liệu tại đây (767.84 KB, 12 trang )
Int.J.Curr.Microbiol.App.Sci (2019) 8(5): 2391-2396
International Journal of Current Microbiology and Applied Sciences
ISSN: 2319-7706 Volume 8 Number 05 (2019)
Journal homepage:
Original Research Article
/>
The Effect of Climate Change on Abundance and Diversity of Ant in
Tuhaha Forest at Mollucas Province on Indonesia
Fransina Latumahina* and Gun Mardiatmoko
Forestry Department, Faculty of Agriculture, Pattimura University
Ambon-97237, Indonesia
*Corresponding author
ABSTRACT
Keywords
Protection Forest,
Species abundance,
Climate change,
Ants
Article Info
Accepted:
18 April 2019
Available Online:
10 May 2019
The study was conducted in the Protected Forest area of Tuhaha Village, Saparua SubDistrict, Mollucas Province, in May - July 2018 to determine the presence, abundance,
diversity and evenness of ant species in relation to climate change in Mollucas. Ants were
collected by three methods, namely Hand Collecting, Pitfall trap with soapy water bait
using a detergent brand Rinso, bait trap with sugar water bait and tuna fish. The results of
the study found 35 species of ants as many as 1866 tails, the diversity of species 1.47 were
classified as moderate, species richness 4.51 and evenness of type 0.41 with a distribution
pattern of 0.19, which was classified as grouped type. Correlation analysis on factors of air
temperature climate and air humidity found that the results of R square of air temperature
were 0.003%, air humidity was 0.63%, and rainfall was 3.25% for the number of ants.
Introduction
Ecosystem changes due to climate warming
have become a serious problem because
climate change occurs in almost all types of
ecosystems gradually. The increase in the
surface temperature of the earth, the melting
of snow at the North Pole and rising sea levels
and disturbances of biodiversity are a picture
of the impact of climate change. When climate
change occurs, ants will respond to changes
that occur in ecosystems, ants can become
indicator species to monitor environmental
changes due to active colony habits, long
activity seasons, high diversity and density,
and high relationships with environmental
factors. A total of 31 researchers from six
countries proposed standard monitoring
methods to activate ant monitoring (Agosti et
al., 2000). Distribution of Argentine ants,
Linepithema humile Mayr has changed due to
warming of air temperatures in a period of 1
year
(Roura-Pascual
et
al.,
2004),
consequently moving from Southwest Asia,
and if climate change continues, the
distribution of Argentine ants will decline in
the tropics and extends to high latitudes area.
Even in Korea, it is no longer found because it
has moved to Manchuria. Fire ants (Solenopsis
invicta Baren) from South America, invaded
the southern United States and weregrowing
rapidly due to changes in temperature and
2397
Int.J.Curr.Microbiol.App.Sci (2019) 8(5): 2391-2396
rainfall over the past 10 years (Sutherst and
Maywald, 2005). Ant communities in
Australia responded actively to disruption of
human presence and change climate. The
diversity and composition of ants found for
more than 20 years in Australia has undergone
changes due to human disturbances and
climate change. (Majer 1983; Andersen 1990,
1997a, b; Bestelmeyer and Wiens 1996; Majer
and Nichols 1998; Peck et al., 1998; Bisevac
and Majer 1999; Agosti et al., 2000; Mitchell
et al., 2002). Majer and Nichols (1998) found
that ant communities in damaged ecosystems
and increased air temperatures had a lower
diversity of species and a greater number of
Dolichoderines (subfamily of highly active
ants). Distribution of ants in Jeju Island in
2006 decreased vertically every 0.50C
temperature increase and every 100 m height
increase in the mountain region, Kwon et al.,
(2014). The Latumahina study, 2014, found
changes in microclimate and the presence of
humans reduced ant populations in the
Sirimau Protection Forest area in Mollucas by
40%. From the above phenomena, this study
helped to predict the relationship of climate
change with the abundance and diversity of
ant species in the protected forest of Tuhaha
Village, Saparua District, Central Mollucas
Regency.
Materials and Methods
Time and location of research
The study was conducted in the Protected
Forest of Tuhaha Village, Central Mollucas
Regency, Mollucas Province, which is
astronomically located at 3o 32 '00 "to 3o 34'
00" South Latitude and 128o 40 '30 "East
Longitude, at an altitude of 68 m asl.
Tools and materials
The equipment used was plastic cups, plastic
plates, cameras, raffia, machetes, pH meters,
electron microscopes, lux meters, roll meters,
phi bands, meter meters, Garmin GPS,
hygrometers, earth drills, soil and air
thermometers. Materials included ants, canned
fish, vegetation, soil, water, sugar, and
detergent.
Research procedure
Taking ants used the method (1) Hand
Collecting (2) Pitfall trap and (3) Bait trap.
The Pitfall trap method used a mixture of
water and detergent, the bait trap method used
Tuna bait and sugar solution. Samples were
grouped based on sampling methods and
preserved with 70% alcohol, then identified up
to species level using the book of
Identification Guides to the Ant Genera of The
World (Bolton, 1997). Vegetation inventory
used Continuous strip sampling methods on
plots measuring 20m x 20 m for tree level , 10
mx 10 m for pole level, 5 mx 5 m for sapling
and 2 mx 2 m for seedlings. Micro climate
data in the form of air temperature and
humidity, and soil data such as temperature
and soil moisture.
Data analysis
Ant potential was known from species
richness, diversity using diversity index,
similarity types using similarity index,
evenness using Jaccarrd index and similarity
using index evenness similarity. Distribution
patterns and to compare the presence of ants
used Multi-dimensional scaling MDS) as well
as to determine the relationship between the
characteristics of protected forests and the
diversity of ants depicted in two-dimensional
graphs. Vegetation closure was analized by
using NDVI, microclimate that included air
temperature, air humidity and rainfall. The
relationship of climate factors to the diversity
of species and the abundance of ant species
was known by correlation and regression
analysis.
2398
Int.J.Curr.Microbiol.App.Sci (2019) 8(5): 2391-2396
Results and Discussion
Species wealth, type abundance, diversity
and evenness of ant types
The spread of ants in the Tuhaha Village
Protection Forest can be seen in Table 1 and
Figure 1.
The results of the ants collection with 3
methods found 35 types with species richness
of 4.51 classified as moderate, type evenness
index of 0.41 where the spread of ants in the
Tuhaha Village Protected Forest was uneven
(<1). The distribution pattern was 0.19 where
ants in the protected forest live spreadly. The
type diversity (H ') value is 1.47 as medium.
The values of the three parameters above were
influenced by a) Composition of species and
structure of vegetation. Changes in vegetation
cover are related to food availability and
nesting for activities. The results of the NDVI
analysis showed that vegetation density in
Tuhaha Village Protected Forestwas classified
as medium with an area of 441.132 ha.
Changes in plant structure on a land always
correlate with the diversity and abundance of
ants (Agosti et al., 2000) so that the presence
of certain ants is assumed to be determined by
the constituent vegetation of the region. The
composition of ant types will be different
based on the type of vegetation (Herwina
AND Yaherwandi, 2012) b) Availability of
nests. The availability of nests affects the
abundance, productivity and structure of ant
colonies. The nest is used as a place to store
food, food cultivation, and a sanctuary for
queens and colonies. At the time of the study,
it was found the nest of Dolichoderus
thoracicus on the mound around Acasia
(Acacia mangium), so that it was suspected
that this species like the Acacia Tree as a
shelter. c) Availability of food, Foods
containing glucose and protein will affect the
development and reproduction of ants
(Latumahina, 2015). At the time of the study,
it was found ants that like the solution of sugar
and fish together, only sugar or fish solutions
and vice versa or not even found in both types
of food. The types of food and foraging
activities greatly influence the composition of
ants in protected forests. Foraging activities
are influenced by three factors, namely
internal needs (hunger and production), food
sources and microclimates. The composition
of ants in forested areas is higher and varied
compared to non-forest areas because of
physical differences in ecosystems, food
availability, nest availability, predation and
competition among ants. The distribution of
ants in each lane varied, where Anochetus
Graeffa predominating in lanes I and IV with
a total of 82 individuals. Echinoplalineata
dominated lane II, V and IX with 108
individuals. Polirachys dives dominated lane
III and VII with 131 tails. Leptogenys
diminuta dominated lane VI with 94
individuals.
Dolichoderus
thoracicus
dominated lane VIII with 86 individuals, and
Meranoplus bicolor dominated lane X with a
total of 32 individuals.
Anochetus graeffeid was found by using the
hand collecting method around the roots of
Acacia (Acacia mangium) and Siripopar
(Piper miricatum). This type was also found
with sugar solution bait because it was found
as many as 20 tails more than the tuna fish
feed (5 tails). Many of Echinoplalineata,
Polirachys dives and Leptogenysdiminutawere
found with a tuna fish bait. It was assumed
that Tuna is a source of protein for 3 types of
ants because tuna can form hormones,
enzymes, and maintain the muscle tissue of
ants. Tuna is a source of mineral-rich protein,
especially magnesium, selenium, phosphorus
and is thought to be highly preferred by all
three types. Tuna with high protein content
was thought to help the ants produce eggs and
larvae to grow into adult ants.
The black ant Dolichoderus thoracicus
dominated lane VIII found at an altitude of 65
m above sea level around the roots of Oranges
2399
Int.J.Curr.Microbiol.App.Sci (2019) 8(5): 2391-2396
(Citrus
sinensis),
Srikaya
(Annona
squamosal), Guava (Syzigium cumini L) and
Mango (Mangifera indica). Ants clustered on
plant stems and leaves, dried leaf foliage and
plant litter of forest nutmeg (Myristica
fragrans). At the time of the study, the rainfall
was very high, with air humidity 83.2%, air
temperature 28OC. Dolichoderus thoracicus
were active on the top of plants to get sunlight,
but during the day when the temperature of air
was hot, they hide between the leaves and
bottom of the rock which was protected from
the sun's rays. Dolichoderus thoracicus was
found more because the research was carried
out during the rainy season in Mollucas.
Presumably, food sources and vegetation were
available to make nests in supporting the
growth of coloniesduring the rainy season.
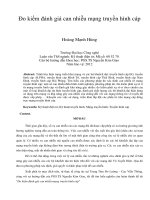
Multi Dimensional Scaling (MDS) analysis
was carried out to find out the relationship
between habitat characteristics with soilpH
variable, organic matter, soil temperature (0C),
air temperature (0C), air humidity (%), soil
moisture (%), rainfall (mm / day), and Noise
(db) with ant diversity can be seen in the twodimensional graph below.
the medium category. This was caused by
anthropogenic damage due to illegal hunting
of wild boar (Susscrofa) and wild dogs
(Cuonalpinus) by residents, clearing of forests
for
cassava
gardens,
taking
Aren
(Arengapinnata) on a regular basis for making
"Saparua" brown sugar and home-made
materials. This condition has shown symptoms
of deforestation in protected forests. Panta et
al., (2008) stated that deforestation, which is
the change in forest cover to non-forest due to
forest degradation, can reduce the quality of
forest canopies and the vertical structure of
forest canopies in the long term. The reason
for the decision of the Tuhaha Village
community was to convert the forest due to
clearing of forests with reduced costs, weak
village supervision, and economic factors of
the people. Suhendang (2002) states that the
area of permanent forestlandand forest
carrying capacity is limited, while human
needs continue to increase due to a decrease in
the area and quality of the forest.
Based on Figure 2, the diversity of ant species
on Lanes 6, 7, 8, and 9 was closely related to
soil pH, soil temperature, and air noise. On
lane 10, it tended to be related to the humidity
of air and organic matter. Soil moisture was
closely related to the diversity of ant species
on lanes 1, 2, 3, and 4, while the diversity of
ant types in lane 5 was closely related to
rainfall and air temperature.
The results of R square value of soil
temperature is 0.21%, air temperature 0.05%,
air humidity, 2.02% and soil moisture 1.47%
against the abundance of ants. In Tuhaha
Village Protected Forest, It was known that air
humidity variable has the highest correlation
with the abundance of ants of 2.02% and the
lowest correlation of air temperature with a
correlation value of 0.05%. This showed that
the four variables above have a relationship
with the abundance of ants but there were
other variables that were more influential than
this correlation.
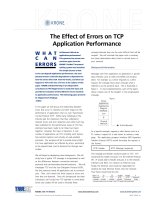
Vegetation closure
The results of the NDVI analysis can be seen
in Figure 3 below.
This study used NDVI values, which were
reclassified into three categories as in Table 2.
Table 2 shows the vegetation density in
Tuhaha Village Protected Forest classified in
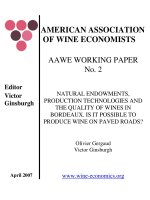
Relationship between climate change and
the abundance and diversity of ants
The results of the correlation analysis with soil
temperature, air temperature, soil moisture and
air humidity there are variations in the
response of each type to the four parameters
(Fig. 4 and 5).
2400
Int.J.Curr.Microbiol.App.Sci (2019) 8(5): 2391-2396
Table.1 Species Wealth, Species Abundance, and Diversity of Ant Types
Lane
Species name
Number of Type
individuals abundance
Species
diversity
I
Acropygamoluccana roger
Aenictusceylonicus
Anochetusgraeffei
Cardiocondylanuda
Cerapachysjacobsoni
Cerapachyssuscitatus
Crematogasterampullaris
Crematogasterdifformis
Crematogasterelegans
Dolichoderusthoracicus
Echinoplalineata_lineata
Hypoponerabugnioni
Aenictusceylonicus
Pachycondylaluteipes
Cardiocondylanuda
Diacammarugosum
Leptogenysdiminuta
Pheidologetonmelanocephalus
Polyrhachis dives
Anochetusgraeffei
Cryptoponetestaceae
Diacammarugosum
Dolichoderusbeccarii
Dolichoderusthoracicus
Odonthoponeratranversainfuscata
Odontomachustyrannicus
Acropygamoluccana
Aenictusceylonicus
Anochetusgraeffei
Camponotusreticulatus roger
Cerapachysjacobsoni
Cerapachyssuscitatus
Cryptoponetestaceae
Echinoplalineata_lineata
Leptogenysdiminuta
Odonthoponeratranversainfuscata
Pachycondylajavana
Pachycondylaluteipes
Polyrachisbellicosa
Technomyrmexkraepelin
Hypoponerabugnioni
Leptogenysdiminuta
Myrmicariabrunneasubcarinata
Oecophyllasmaragdina
26
30
39
16
7
19
20
20
21
20
26
19
12
15
7
12
15
26
77
29
45
10
45
13
29
18
24
42
43
16
27
29
16
29
24
31
26
25
25
20
26
36
12
15
0,111
0,116
0,125
0,098
0,083
0,102
0,103
0,103
0,105
0,120
0,129
0,119
0,106
0,111
0,094
0,106
0,111
0,100
0,136
0,103
0,116
0,083
0,116
0,086
0,103
0,092
0,123
0,140
0,140
0,114
0,127
0,129
0,141
0,154
0,150
0,155
0,123
0,122
0,122
0,115
0,123
0,133
0,104
0,079
II
III
IV
V
VI
VII
2401
13,13
15,15
19,70
8,08
3,54
9,60
10,10
10,10
10,61
15,87
20,63
15,08
9,52
11,90
5,56
9,52
11,90
8,90
26,37
9,93
15,41
3,42
15,41
4,45
9,93
6,16
13,26
23,20
23,76
8,84
14,92
16,02
16,00
29,00
24,00
31,00
15,29
14,71
14,71
11,76
15,29
21,18
7,06
4,32
Int.J.Curr.Microbiol.App.Sci (2019) 8(5): 2391-2396
SUBNITIDA
Platythyreaparallela
Polyrhachisabdominalis
Polyrhachisbellicosa
Polyrhachis dives
Tetramoriumsmithi
Tetraponera attenuate
Odonthoponeratranversainfuscata
Pachycondylaluteipes
Polyrhachisabdominalis
Odontomachustyrannicus
35
17
26
54
35
30
34
30
35
36
10,09
4,90
7,49
15,56
10,09
8,65
9,80
8,65
10,09
10,37
0,098
0,081
0,090
0,112
0,098
0,093
0,097
0,093
0,098
0,098
Aenictusceylonicus
Tetramoriumpacificum Mayr
Dolichoderusthoracicus
Hypoponerabugnioni
Tetraponera attenuate
Echinoplalineata_lineata
Pheidologetonmelanocephalus
Aenictusceylonicus
Odontomachustyrannicus
Crematogasterelegans
Dolichoderusbeccarii
Dolichoderusthoracicus
Echinoplalineata_lineata
Hypoponerabugnioni
Leptogenysdiminuta
Meranoplus bicolor
Myrmoterasbinghami
Myrmoterasjacquelinea
Odonthoponeratranversainfuscata
Odontomachustyrannicus
15
26
28
26
23
35
13
14
13
25
23
25
18
14
19
32
27
24
25
27
12,71
22,03
23,73
22,03
19,49
35,00
13,00
14,00
13,00
25,00
9,83
10,68
7,69
5,98
8,12
13,68
11,54
10,26
10,68
11,54
0,129
0,142
0,144
0,142
0,139
0,154
0,129
0,131
0,129
0,146
0,100
0,102
0,093
0,088
0,094
0,110
0,104
0,101
0,102
0,104
VIII
IX
X
Table.2 Area of vegetation cover based on NDVI analysis
Vegetation density
Forest Area
Location
Rarely Density
175.008 Ha
Protected forest area
Medium density
441.132 Ha
Protected forest area
High density
100.465 Ha
Protected forest area
2402
Int.J.Curr.Microbiol.App.Sci (2019) 8(5): 2391-2396
Table.3 Types of ants with a low response to air temperature, air humidity, soil temperature and
soil moisture
No.
1
Anochetus graeffei
56
5,95
0,06
4,05
Important
Index
Value
10,003
2
Camponotusreticulatus roger
8
0,86
0,02
1,35
2,209
3
Cerapachysja cobsoni
17
1,82
0,04
2,70
4,525
4
Cryptoponetestaceae
31
3,27
0,04
2,70
5,972
5
Dolichoderus beccarii
34
3,64
0,04
2,70
6,347
6
Leptogenys diminuta
47
5,04
0,08
5,41
10,443
7
Myrmicariabrunnea subcarinata
6
0,64
0,02
1,35
1,994
8
Oecophyllasmaragdina Subnitida
8
0,80
0,02
1,35
2,155
9
Pachycondylajavana
13
1,39
0,02
1,35
2,745
Technomyrmex Kraepelin
10
1,07
0,02
1,35
2,423
Total
933
100
1,48
100
200
10
Ant type
Number of
individuals
Relative
Abundance
Frequency
Relative
Frequency
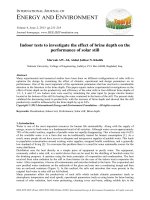
Figure.1 Tuhaha protected forest
2403
Int.J.Curr.Microbiol.App.Sci (2019) 8(5): 2391-2396
Figure.2 The two-dimensional positioning map of relationship between island characteristics
(Environment) and ants diversity in Tuhaha village protected forest
Figure.3 Results of NDVI analysis of vegetation density of Tuhaha village protected forest
2404
Int.J.Curr.Microbiol.App.Sci (2019) 8(5): 2391-2396
Figure.4 Relationship of soil temperature, air temperature, soil moisture, air humidity to types
diversity and ant types abundance
Figure.5 Relationship of soil temperature, air temperature, soil moisture, air humidity, and
2405
Int.J.Curr.Microbiol.App.Sci (2019) 8(5): 2391-2396
rainfall to abundance and number of ant individuals
Of the 35 types of ants found, only 14 types
correlated with soil temperature, 14 types of air
temperature, 1 type of air humidity and 1 type
soil moisture. This is due to changes in habitat
conditions, food availability, microclimate,
habitat disturbance due to natural and
anthropogenic factors and climate change. The
ANOVA test results showed that the presence
of ants in the Tuhaha Village Protected Forest
had a significant influence but it was not
tangible on the abundance and ant species
diversity. Correlation analysis of the presence
of ant was significantly not influenced by air
temperature and air humidity. It was suspected
2406
Int.J.Curr.Microbiol.App.Sci (2019) 8(5): 2391-2396
that the type of ants found have a range of life
and are active at temperatures and humidity of
air and wide land so that at micro temperatures
between 27˚C– 28.5 ˚C and micro air humidity
75% - 85% did not affect the life of ants found.
Lubertazzi and Tschinkel (2003) pointed out
that the temperature and air humidity that are
too low or high will put pressure on the forms
of
nests,
productivity
and
structural
communities. Soil temperature and soil
moisture of 26˚C - 28˚C and 76.5% - 77.5%
were assumed to be suitable for ant life in the
Tuhaha village protected forest area.
The table 3 shows 10 types of ants that are not
able to adapt to air temperature changes, air
humidity and rainfall that impact soil
temperature and soil moisture in protected
forests. As a result, daily activities, reproductive
patterns, dietary patterns and the role of ants in
the food chain were disrupted. Extreme
microclimate disrupted the spread of seeds by
ants, which could affect biodiversity in the
Tuhaha Village Protected Forest. The
temperature dropped and air humidity increased
due to increased rainfall, Myrmicaria
brunneasubca hiding between the litter of
Acacia and Mahogany leaves, and did not come
out looking for food so that it was only found as
many as 8 tails.
Alofs, K.M. & Fowler, NL, 2010 says the
average ant takes about ten hours a day at
normal temperatures, when the air temperature
rises by half a degree, the ants will remain in
the nest under the ground and feed for only one
hour. Oecophyllas maragdina Subnitida were
found among Pala and Macila Tree leaves at
09.00 - 10.00 and 15. 00 - 16.00 of eastern
Indonesian time. They could not be found
outside these hours period. It was assumed that
the average air temperature was 28.3˚C, air
humidity is 83.2%, 68 mm / day, suitable for
this type of activity, foraging, nesting and
reproductive activities. Myrmicaria brunnea
subcarinatam had a low ability to adapt to the
microclimate in protected forest areas, so that
only 8 birds were found. At the time of the
study, it was found that Rangrang nests on the
Chocolate plant (Theobroma cacao L) were
assumed to protect chocolate from ladybug
attack, thus increasing the quality and amount
of harvest. When there is a change in the
microclimate in a habitat, the ants will respond
by adapting, moving, or extinct. It is caused
ants will die and will be followed by the
extinction of the colony if they do not follow
climate change.
In conclusion, of the 35 types of ants found,
there were only 14 types correlated with soil
temperature, 14 types of air temperature, 1 type
of air humidity and 1 type of soil moisture. This
was due to changes in habitat conditions, food
availability, microclimate, habitat disturbance
due to both natural and anthropogenic factors
and climate change. The main factors that
interact with the population, abundance and
diversity of ant species in the Tuhaha village
protected forest were air temperature and air
humidity.
Acknowledgement
The author would like to thank the Government
of the Republic of Indonesia through the
Ministry of Research and Technology for
providing research grants through the 2018
Basic Competency Grant Scheme.
References
2407
Agosti D, Majer JD, Alonso LE, and Schultz
TR. editors. 2000 Ants: Standard
Methods for Measuring and Monitoring
Biodiversity. Washington: Smithsonian
Institution Press.
Agosti D, Majer JD, Alonso LE, and Schultz
TR. editors. 2000 Ants: Standard
Methods for Measuring and Monitoring
Biodiversity. Washington: Smithsonian
Institution Press.
Alofs, K.M. and Fowler, N.L, 2010. Habitat
fragmentation caused by woody plant
encroachment inhibits the spread of an
invasive grass. Journal of Applied
Ecology, 47. 338–347.
Bolton B. 1997 Identification Guide to the Ant
Int.J.Curr.Microbiol.App.Sci (2019) 8(5): 2391-2396
Genera of the World. Cambridge:
Harvard University Press.
Herwinadan Yaherwandi. 2012. Study of Ants
(Hymenoptera: Formicidae) in Solok
District Cacao Plantation, West Sumatera.
Proceeding Semirata BKS-PTN B.
Medan. ISBN 978-602-9155-20-8
Roura-Pascual, N., Suarez, A.V., Gómez, C.,
Pons, P., Touyama, Y., Wild, A.L. &
Peterson, A.T. 2004. Geographical
potential of Argentine ants (Linepithema
humile Mayr) in the face of global climate
change. Proceedings of the Royal Society
B: Bio-logical Sciences, 271: 2527–2534.
Sutherst dan Maywald, 2005. A Climate Model
of the Red Imported Fire Ant, Solenopsis
invicta
Buren
(Hymenoptera:
Formicidae): Implications for Invasion of
New Regions, Particularly Oceania
Environmental Entomology, Volume 34,
Issue 2, 1 April 2005, Pages 317–335,
/>Majer, J.D. 1983; Andersen 1990, 1997a, b;
Bestelmeyer dan Wiens 1996; Majer dan
Nichols 1998; Peck dkk. 1998; Bisevac
dan Majer 1999; Agosti dkk. 2000 ;
Mitchell et al., 2002.Ants: Bio-indicators
of minesite rehabilitation, land-use, and
land
conservation.
Environmental
Management. Volume 7, Issue 4, pp 375–
383.
Majerdan, J.D. and O.G. Nichols. 1998. Longterm recolonization patterns of ants in
Western Australian rehabilitated bauxite
mines, with reference to use as indicators
of restoration success. Journal of Applied
Ecology 35: 161-181.
Kwon MJ, et al., 2014. Molecular genetic
analysis of vesicular transport in
Aspergillus
niger
reveals
partial
conservation of the molecular mechanism
of exocytosis in fungi. Microbiology 160
(Pt 2):316-29.
Latumahina, Musyafa, Sumardi, Nugroho
Susetya
Putra.
2014.
Penyebaran
Semutpada Hutan Lindung Sirimau Kota
Ambon. Bumi Lestari Journal of
Environment [Spread of Ants in the
Sirimau Protection Forest of Ambon City.
Sustainable Earth Journal]. Vol. 14, No.
2, Jan. 2016.
Latumahina, 2015. Respon Semut Terhadap
Kerusakan Antropogenikdalam Hutan
Lindung
Sirimau
Ambon.
Jurnal
Manusiadan Lingkungan Pusat Studi
Lingkungan
[Ant
Response
to
Anthropogenic Damage in the Sirimau
Protection Forest of Ambon. Human
Journal and Environment Center for
Environmental Studies]. Vol 22, No 2.
Lubertazzi D, Tschinkel WR. 2003 Ant
community change across a ground
vegetation gradient in north Florida's
longleaf pine flat woods. Journal of Insect
Science. 3:21. Available online at:
insectscience.org/3.21.
[PMC
free
article][PubMed]
Panta et al, 2008. Temporal mapping of
deforestation and forest degradation in
Nepal:
Applications
to
forest
conservation. Forest Ecology and
Management 256(9):1587-1595. DOI
10.1016/j.foreco.2008.07.023
Suhendang. 2002. Pengantar Ilmu Kehutanan
Bogor [Introduction to Bogor Forestry
Sciences]: Yayasan Penerbit Fakultas
Kehutanan, Institut Pertanian Bogor.
How to cite this article:
Fransina Latumahina and Gun Mardiatmoko. 2019. The Effect of Climate Change on Abundance
and Diversity of Ant in Tuhaha Forest at Mollucas Province on Indonesia. & Coss.).
Int.J.Curr.Microbiol.App.Sci. 8(05): 2397-2408. doi: />
2408