Preliminary geoelectrical identification of a low-temperature hydrothermal system in the Anzer glacial valley, İkizdere, Rize, Turkey
Bạn đang xem bản rút gọn của tài liệu. Xem và tải ngay bản đầy đủ của tài liệu tại đây (933.93 KB, 7 trang )
Turkish Journal of Earth Sciences
/>
Research Article
Turkish J Earth Sci
(2013) 22: 664-670
© TÜBİTAK
doi:10.3906/yer-1207-7
Preliminary geoelectrical identification of a low-temperature hydrothermal system in the
Anzer glacial valley, İkizdere, Rize, Turkey
Abdullah KARAMAN*
İstanbul Technical University, Department of Geophysics, Maslak 34469, İstanbul, Turkey
Received: 18.07.2012
Accepted: 13.11.2012
Published Online: 13.06.2013
Printed: 12.07.2013
Abstract: The Anzer glacial valley, at an elevation of over 2300 m in the Eastern Black Sea region of Turkey, exhibits evidence for a lowtemperature hydrothermal system (40–100 °C). Low-temperature hydrothermal systems usually do not receive attention since they are
not useful for energy production. However, in areas where natural beauty is prominent, as in the Anzer valley, such resources can easily
trigger investment for all-season resorts that significantly contribute to the economy. In this study, we examine the site evidence and
carry out self-potential and dc-resistivity sounding surveys using a Schlumberger electrode configuration. The resistivity cross-section
obtained from the inversion of a number of 1-D Schlumberger soundings, integrated with the slopes obtained from the inversion of the
self-potential anomalies, suggests a conductive zone corresponding to the mineral alteration zone surrounding the crack conduits in this
hydrothermal system. This study also emphasizes the significance of low-temperature hydrothermal fields for the region.
Key words: Geothermal, hydrothermal, self- potential, dc-resistivity, Rize, İkizdere, Anzer, Ballı, Black Sea
1. Introduction
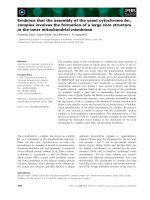
Figure 1 shows the location of the Anzer glacial valley,
which is at over 2300 m altitude. This rugged part of
Turkey, inland from the Black Sea, includes forested steep
mountainsides separated by valleys, with areas of high
pasture. Ballı village, at the terminus of the Anzer valley, is
one of several remote villages on the northern flank of the
Kaçkar Mountains. The valley appears to have potential for
all-season sports and recreation since it is unique with its
extremely rich flora, growing from the spring to autumn
(Ozkırım & Keskin 2001; Doğan & Kolankaya 2005).
However, the valley and the village have to be evacuated in
winter since the living conditions become very harsh and
the access roads become difficult to maintain. Recently,
reports from the local people about gas bubbles and
occasional vapor exhalation from the ponds in a number
of locations in the valley motivated us to investigate the
site’s hydrothermal potential with the hope of opening up
new opportunities for the local economy by triggering
new investments that may eventually yield an increase in
tourism revenue. Geothermal studies in this part of the
country are rare, to the best of our knowledge, and this
study may lead to new public surveys and exploration
programs for new fields.
Hydrothermal field exploration requires a clear
understanding of the hydrothermal activities that are
*Correspondence:
664
related to a particular hydrothermal system (Pirajno
1992). Hydrothermal alteration, bacterial colonies, soil
and water temperatures, and other field evidence require
careful inspection. A good resistivity contrast, such as
occurs between fractured and compact crystalline rocks,
imposes marked resistivity anomalies on the resistivity
profiles (Majumdar et al. 2000). We therefore carried
out dc-electrical measurements with a Schlumberger
electrode configuration and self-potential measurements
to identify possible crack systems and fault zones leading
to the hot water upwelling and emerging in the form of a
warm pool. Dc-electrical and self-potential methods have
been successfully used in identifying common shallow
features such as faults, fracture systems, and alteration
zones encountered in hydrothermal sites (e.g., Ogilvy et al.
1969; Bogoslovsky & Ogilvy 1973; Harthill 1978; Mabey
et al. 1978; Tripp et al. 1978; Ward et al. 1978; Corwin &
Hoover 1979; Fitterman & Corwin 1982; Murakami et al.
1984; Zohdy & Bisdorf 1990; Pirajno 1992; Majumdar et
al. 2000; Storz et al. 2000; Reci et al. 2001). Harinarayana
et al. (2006) and Spichak (2009) utilized magnetotelluric
and electromagnetic sounding measurements at greater
exploration depth to obtain the resistivity structure of
geothermal fields. This present study utilizes conventional
geophysical methods to identify the crack system/fault
zone. However, the real value of this study is to motivate
KARAMAN / Turkish J Earth Sci
25
BLACK SEA
Rize
Trabzon
00
s
230
0
in
İkizdere unta
o
r M de
i
çka
Ka r div
te
a
w
27
40°34’09’’E
00
0
50
km
VES-1
VES-2
VES-3
270
0
I
00
lağan
II
Borehole
valle
y
2900
SP profile
KARAPINAR
3146 m
2500
VES-4
29
Buzu
III
SERENTEPE
3141m
N
N
270
0
0
ORSOR
3084 m
km
1
Ponds and self-potential
anomaly locations
VES locations
Borehole
40°30’40’’E
Figure 1. The location of the study site (inset figure). The contour lines show the
elevations in meters above mean sea level. The thick dashed lines show the major
crack zones mostly separating the peaks and crests in the area.
other exploration programs in the rarely studied Eastern
Black Sea Region of Turkey, and, ultimately, to create an
economic impact.
2. Site description
The geology of the Kaçkar Mountains is described
extensively by Okay and Şahintürk (1997) and Şengör and
Yılmaz (1981). The site, as shown in Figure 1, is located
on the northern side of the Eastern Black Sea Mountains
where an E-W trending belt consists mostly of magmatic
rocks. This magmatic belt is an east-west trending
continental margin arc developed in response to the
northward subduction of the northern branch of oceanic
crust beneath the Eurasian plate. Magmatic activity in the
area began in the Turonian and continued until the end of
the Paleocene. During the same period, granitic intrusions
were emplaced into shallow levels of the crust and formed
the first components of a composite pluton called the Rize
granite. Emplacement of the pluton occurred in pulses and
lasted until the late Eocene. Bounded to the south by the
watershed, the Anzer valley is about 20 km long and a few
hundred meters wide, and receives heavy snow. Lateral
moraines at the sides of the valley appear to be replaced
with outwash deposits just outside Ballı village, forming
flat-land for the settlement.
Figure 1 illustrates two major crack systems that we
were able to identify from the rock outcrops at the sides
of the valley; one intercepts the valley in an east-west
direction and the other is about 30° oblique to the valley’s
axis. The warm pools that are strictly bounded with these
major crack systems exhibit hematitization and ironrich alteration at their outlets. Hematitization related to
hydrothermal alteration is not well documented, since
it is usually associated with late-stage (therefore, lowtemperature) hydrothermal activity (Pirajno 1992). No
further evidence for warm water was found outside this
665
KARAMAN / Turkish J Earth Sci
triangular zone that is about 1 km long along the axis of
the Anzer valley.
Intermittent gas bubbles (fumaroles) in small ponds
with tiny cracks or holes at the bottom were observed at
a number of places. The ponds observed between the two
major crack systems may have formed after the removal of
top soil particles dislodged by gas emerging at the Earth’s
surface, like pockmarks that occur in seabed sediments
from gas eruptions. The water temperature measurements
in a number of these ponds showed a maximum
temperature of 23 °C in near-freezing air while the mean
surface water temperature was about 5-7 °C. Such an
anomalous water temperature in these ponds maintains a
favorable environment for fungus, bacterial colonies, frogs,
and insects, when the air temperature drops below 0° and
permafrost reaches to a depth of about 1 m on land at such
elevations. Because the side walls of the valley were mostly
covered with a thick angular lateral moraine, we were
unable to align geophysical measurements perpendicular
to the valley axis. The bottom of the valley, being a gently
rolling pasture, allowed us to obtain only 1-D geophysical
measurements.
Ves-4
AB/2
100
150
200
300
200
500
400
Distance (m)
(b)
0
60
Depth (m)
Apparent resistivity (ohm/m)
40
3
10
80
100
120
140
160
180
2
1
10
2
10
AB/2 (m)
3
10
200
2
10
3
4
10
10
Resistivity (ohm/m)
5
10
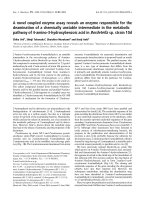
Figure 3. (a) VES-3 as an example of the Schlumberger resistivity sounding data and
(b) equivalent (non-unique) resistivity–depth models obtained after the 1-D inversion
procedure. Most models converge along the thicker black line.
666
700
resistivity measurements were made with a METZ earth
resistivity meter with stainless-steel electrodes. The
maximum current electrode spacing (AB/2) was 200 m
from the center of the array along the axis of the valley
where surface conditions permitted. The measured
apparent resistivity values were used to produce an
electrical resistivity pseudo-section, which is a contour
map of apparent resistivity values beneath VES-x stations
at a depth proportional to their corresponding half
current electrode spread (AB/2), as shown in Figure 2. The
layered final geoelectric models were produced using the
IPI2WIN inversion software (Bobachev et al. 2002). Figure
3a shows, for example, the measured apparent resistivity
curve acquired at VES-3 over the ponds where warm
water together with gas bubbles were observed, and Figure
3b is the geoelectric section derived from 1-D inversion.
Multiple models represent the degree of equivalence in the
final solution.
20
10 0
10
600
Figure 2. The electrical resistivity pseudo-section.
(a)
4
Ves-1
Ves-2
50
3. Data acquisition and interpretation
To characterize the crack systems and determine the effect
of the fractured zones acting as conduits, we carried out
vertical electric soundings at four locations (Figure 1)
using the Schlumberger electrode configuration. The
electrodes were spread along N-S directions, with the
center of the array marked as VES-x in Figure 1. The
10
Ves-3
KARAMAN / Turkish J Earth Sci
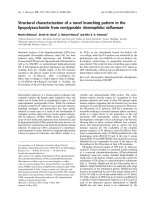
Figure 4 shows the self-potential profile about 1 km
long stretching along the valley axis. The measurements
were carried out using a digital dc-meter connected to
two CuSO4 potential electrodes. Fixed electrode spacing
of 20 m was maintained by moving the rear electrode
to the front porous pot hole and the forward electrode
to a new location. The measured gradient values were
integrated to obtain the self-potential values. There are
three prominent self-potential anomalies marked with
roman numerals (I, II, and III) in Figure 4. The anomaly
marked ‘I’ with 130 mV amplitude is the most prominent
one measured around the pond, in which the maximum
water temperature of 23 °C was measured. Similar ponds
with relatively low temperatures of about 11-15 °C nicely
coincide with the other two anomalies, marked II and
III. Assuming the self-potential results from streaming
potentials along a fault zone are as described by Murakami
et al. (1984), we developed an inversion code in MATLAB
to determine the dip angles of these faults that are expected
to be related to the crack systems we identified in the field.
The Table illustrates the numerical values of the model
parameters estimated from each self-potential anomaly.
Figure 5 illustrates the theoretical model reproduced from
the initial model parameters for anomaly I, the updated
model after each iteration (dotted lines), and the bestfitted fault model having a dip angle of 30°.
SP (mV)
50
0
SOUTH
NORTH
AnomalyIII AnomalyII
AnomalyI
-50
-100
-150
0
100
200
300
400 500 600
Distance (m)
700
800
900
Figure 4. Measured self-potential profile that shows three large
negative anomalies marked by roman numerals.
Figure 3b. Although the number of sounding data points
is limited, the shaded low-resistivity zone is being nicely
supported by the slopes of the fault models (thick solid
line) that are inferred from the inversion of self-potential
data. The combined results of these two independent sets of
measurements suggest a crack system that dips southwards
at an angle of about 30°. The low-resistivity zone shaded in
Figure 6 may be interpreted to be the alteration zone that
occurs at the hydrothermal fields.
The electrical resistivity pseudo-section (Figure 2)
indicates an insufficient exploration depth at the VES-1
and VES-2 locations, where the chunky rock debris from
the Buzulağan Valley (Figure 1) prevented placement
of the electrodes any further north. A low-resistivity
zone, however, is evident around VES-2. A non-unique
geoelectric section produced from the inversion of vertical
electrical sounding data was tested by trying a number of
alternative earth models, while the fit between the observed
and calculated apparent resistivity values remain similar.
The example illustrated in Figure 3b indicates that there
exists a conductive zone at a moderate depth represented
by the heavy black line.
The MATLAB code that we developed for the inversion
of the self-potential data is based on the inversion
algorithm presented by Jackson (1972). Our dipping fault
assumption as the source of streaming potential appears to
be reasonable, since the inversion results are comparable
with the geoelectric section produced using the vertical
electrical sounding data (Figure 6). The inversion
procedure accounts for the model parameters as being the
4. Results and discussion
One-dimensional geophysical measurements were
carried out, since the lateral moraines at the valley sides
prevented us from making geophysical measurements
along directions perpendicular to the valley axis. However,
the measurements produced a meaningful geophysical
response since the crack system, roughly perpendicular
to the valley axis, partially eliminated the shortcomings of
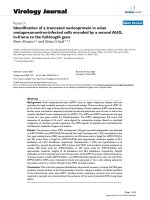
our 1-D measurements. Figure 6 illustrates the geoelectric
cross-section along with the fault model with dip angles
obtained from the inversions of dc-sounding and selfpotential data, respectively. The geoelectric cross-section
is vertically scaled and, therefore, reflects the depth vs.
resistivity values for each data set like the one presented in
Table. Estimated values of the self-potential model parameters. The parameters r1 and r2 are the resistivity values of the either sides of
the crack (fault), S is the streaming potential constant, a is the dip angle in degrees, and a and b are the depth of the top and bottom of
the electrokinetic source.
Anomaly
r1 (Wm)
r2 (Wm)
S(mV)
a
a (m)
b (m)
I
120
150
850
30
20
100
II
100
120
750
25
15
100
III
80
100
600
36
22
95
667
KARAMAN / Turkish J Earth Sci
20
S
StartingModel
0
VES-3
-60
-80
-100
-120
-140
-200
-150
-100
-50
Distance (m)
0
50
100
Figure 5. Part of the measured self-potential data (Anomaly I,
diamonds) with the respective standard deviations (error bars)
inverted for the fault model. The initial and the estimated values
of the model parameters after the inversion are used to reproduce
the theoretical data for comparison.
resistivity values on either sides of the fault, the dip angle,
the depths of the top and bottom of the electrokinetic
source, and the streaming potential constant. The standard
deviation values of the measured self-potential data for
the inversion procedure were assigned to be about 2 mV,
with a few exceptions (see error bars, Figure 5). The model
parameters were estimated within an acceptable range,
except for the streaming constant that was estimated
from its initial value because the respective eigenvalue
was either too small or zero. Prediction error (or bestfit; Karaman & Carpenter 1997) exceeding 10, calculated
from the anomalies, indicates noise in the self-potential
measurements and also emphasizes the simplicity (or poor
representation) of the fault model. The greater best-fit is
also a measure of the structural complexity, as occurs with
neighboring faults (or bodies) with varying slopes, etc.
The inversion results presented in the Table are, however,
satisfying.
The field work and the geophysical measurements
indicated that the site has hydrothermal potential. This
result emanated from the presence of non-freezing
water ponds at the surface, the conductive zone that
appears to be the alteration zone, and maximum selfpotential anomalies of about 130 mV. Figure 7 illustrates a
conceptual hydrothermal field with water circulation based
on field observations and geophysical measurements. This
circulation model explains how the hot water rises to
the surface through cracks and rapidly cools on mixing
with cold surface water. A test well to a depth of 60 m at
the location as shown in Figure 1 (labeled “Borehole”)
was drilled by an amateur team. Based on our personal
communications, the presence of moderately warm water
was verified from the well without cold surface water being
E le va tio n a b o ve MS L (m)
mV
200
2300
-40
668
VES-4
FinalModel
-20
-160
Warm water of 23 °C
and gas seepage
VES-2
20
VES-1
N
250
300
2250
700
110
25°
13
36°
2200
170
30°
10000
2150
500
Distance (m)
0
1000
Figure 6. Geoelectric cross-section constructed from the
interpretation of four 1-D Schlumberger vertical electrical
soundings and the faults (solid lines) that are interpreted from
the self-potential measurements. The numbers in the blocks are
the resistivity values in ohm-meters.
fully isolated. No further test, as far as we know at the time
of this work, has been carried out.
With this study, we brought up the importance of
low-temperature hydrothermal fields that may lead to
all-seasons investments. Even in a poor production well
yield, a heat pump can be devised for local recreational
centers. Although a further rigorous exploration program
and drilling and production plans have to be developed for
this site, the results of this simple yet effective study may
produce a significant long-term impact on the future of the
A CROSS-SECTION ALONG THE ANZER GLACIAL VALLEY
Precipitation
Warm water
Cold water
SOUTH
Borehole
The ponds
NORTH
HEAT SOURCE
Figure 7. Conceptual flow model constructed from the
field observations and the interpretations of the geophysical
measurements. The shaded zone is where the surface water mixes
with the warm water.
KARAMAN / Turkish J Earth Sci
Eastern Black Sea region, where only limited hydrothermal
site exploration has been carried out. Moreover, the
minimum number of geophysical measurements produced
a geoelectric cross-section that may be considered to be
a unique exploration example. This study will also play a
critical role to develop further exploration programs that
may lead to the discovery of other potential sites in the
area.
5. Conclusions
Low-temperature hydrothermal fields at high altitudes
may stimulate investment and promote the local
economy, especially in developing countries. We utilized
self-potential and dc-resistivity methods in a harsh
environment in the Anzer valley and acquired limited
measurements only along the valley’s axis. However,
once a carefully studied geological target is identified, the
geophysical methods prove to be very practical and useful.
Based on the geophysical measurements, we were able to
develop a hydrothermal water circulation model that was
verified with a test well. There are a number of conclusions
that we can draw from this study that may be useful while
developing future exploration programs in the region.
These are: 1) site evidence, such as fungus, bacterial
colonies, frogs, and insects in freezing temperatures most
of the time in a year, may be a good indicator; 2) the
presence of creeks and hanging valleys cutting the major
valleys perpendicularly or obliquely may be related to the
crack systems that play a key role for the hydrothermal
circulations; and 3) utility of the dc-resistivity and selfpotential methods may be a good choice for successful
geophysical field work. We also conclude that the inversion
of self-potential data is practical and reliable.
Acknowledgments
This project was supported by İstanbul Technical
University and Ballı Köyü Muhtarlığı. Aysun Nilay Dinç,
Burak Acet Tunalı, and Enes Kılıç are thanked for their
help during the field work.
References
Bobachev, A.A., Moudin I.N. & Shevnin, V.A. 2002. IPI2Win v.2.1,
Resistivity Sounding Interpretation Software Package. Moscow
State University-Geoscan-M Ltd., Moscow.
Mabey, D.R., Hoovek, D.B., O’Donnell, J.E. & Wilson, C.W. 1978.
Reconnaissance geophysical studies of the geothermal system
in southern Raft River Valley, Idaho. Geophysics 43, 1470–1484.
Bogoslovsky, V.A. & Ogilvy, A.A. 1973. Deformations of natural
electric fields near drainage structures. Geophysical Prospecting
21, 716–723.
Majumdar, R.K., Majumdar, N. & Mukherjee, A.L. 2000. Geoelectric
investigations in Bakreswar geothermal area, West Bengal,
India. Journal of Applied Geophysics 45, 187–202.
Corwin, R.F. & Hoover, D.B. 1979. The self-potential method in
geothermal exploration. Geophysics 2, 226–245.
Murakami, H., Mizutani, H. & Nebatani, S. 1984. Self-potential
anomalies associated with an active fault. Journal of
Geomagnetism and Geoelectricity 36, 351–376.
Doğan, A. & Kolankaya, D. 2005. Protective effect of Anzer honey
against ethanol-induced increased vascular permeability in
the rat stomach. Experimental and Toxicologic Pathology 57,
173–178.
Fitterman, D.V. & Corwin, R.W. 1982. Inversion of self-potential data
from the Cerro Prieto geothermal field, Mexico. Geophysics 47,
938–945.
Harinarayana, T., Abdul Azeez, K.K., Murthy, D.N., Veeraswamy
K., Eknath Rao, S.P., Manoj, C. & Naganjaneyulu, K. 2006.
Exploration of geothermal structure in Puga geothermal field,
Ladakh Himalayas, India, by magnetotelluric studies. Journal
of Applied Geophysics 58, 280–295.
Harthill, N. 1978. Quadripole resistivity survey of the Imperial
Valley, California. Geophysics 43, 1485–1500.
Jackson, D.D. 1972. Interpretation of inaccurate, insufficient and
inconsistent data. Geophysical Journal of the Royal Astronomical
Society 28, 97–109.
Karaman, A. & Carpenter, P.J. 1997. Fracture density estimates
in glaciogenic deposits from P-wave velocity reductions.
Geophysics 62, 138–148.
Ogilvy, A.A., Ayed, M.A. & Bogoslovsky, V.A. 1969. Geophysical
studies of water leakage from reservoirs. Geophysical
Prospecting 17, 36–62.
Okay, A.I. & Şahintürk, Ö. 1997. Geology of the Eastern Pontides.
In: Robinson, A.G. (ed), Regional and Petroleum Geology of the
Black Sea and Surrounding Region, AAPG Memoir 68, 291–311.
Ozkirim, A. & Keskin, N. 2001. A survey of Nosema apis of honey
bees (Apis mellifera L.) producing the famous Anzer honey in
Turkey. Zeitschrift für Naturforschung C 56, 918–919.
Pirajno, F. 1992. Hydrothermal Mineral Deposits: Principles and
Fundamental Concepts for the Exploration Geologist. SpringerVerlag, Berlin.
Reci, H., Tsokas, G.N., Papazachos, C.B., Thanassoulas, C., Avxhiou,
R. & Bushati, S. 2001. Study of the cross-border geothermal
field in the Sarandoporos-Konitsa area by electrical soundings.
Journal of the Balkan Society 2, 19–28.
Spichak, V. & Manzella, A. 2009. Electromagnetic sounding of
geothermal zones. Journal of Applied Geophysics 68, 459–478.
669
KARAMAN / Turkish J Earth Sci
Storz, H., Storz, W. & Jacobs, F. 2000. Electrical resistivity tomography
to investigate geological structures of the earth’s upper crust.
Geophysical Prospecting 48, 455–471.
Şengör, A.M.C. & Yılmaz, Y. 1981. Tethyan evolution of Turkey: a
plate tectonic approach. Tectonophysics 75, 181–241.
Tripp, A.C., Ward, S.H., Sill, W.R., Swift, C.M. & Petric, W.R. 1978.
Electromagnetic and Schlumberger resistivity sounding in the
Roosevelt Hot Springs KGRA. Geophysics 43, 1450–1469.
670
Ward, S.H., Parry, W.T., Cook, W.K.L., Smith, R.B., Brown, D.F.H.,
Whelan, J.A., Nash, P., Sill, W.R., Chapman, S. & Bowman, J.R.
1978. A summary of the geology, geochemistry, and geophysics
of the Roosevelt Hot Springs thermal area, Utah. Geophysics
43, 1515–1542.
Zohdy, A.A.R. & Bisdorf, R.J. 1990. Schlumberger soundings near
Medicine Lake, California. Geophysics 55, 956–964.