40Ar-39Ar geochronology and petrogenesis of postcollisional trachytic volcanism along the İzmir-Ankara-Erzincan Suture Zone (NE, Turkey)
Bạn đang xem bản rút gọn của tài liệu. Xem và tải ngay bản đầy đủ của tài liệu tại đây (18.21 MB, 31 trang )
Turkish Journal of Earth Sciences
Turkish J Earth Sci
(2018) 27: 1-31
© TÜBİTAK
doi:10.3906/yer-1708-4
/>
Research Article
Ar-39Ar geochronology and petrogenesis of postcollisional trachytic volcanism along
the İzmir-Ankara-Erzincan Suture Zone (NE, Turkey)*
40
1,
1
1
2
Gönenç GÖÇMENGİL *, Zekiye KARACIK , Ş. Can GENÇ , M. Zeki BİLLOR
Department of Geological Engineering, Faculty of Mines, İstanbul Technical University, İstanbul, Turkey
2
Department of Geology and Geography, Auburn University, Auburn, AL, USA
1
Received: 08.08.2017
Accepted/Published Online: 27.11.2017
Final Version: 08.01.2018
Abstract: The obliteration of the Neo-Tethyan Ocean and collision of the microplates along the northern part of Turkey led to the
development of the İzmir-Ankara-Erzincan suture zone (IAESZ). After the collision of Pontides with the Central-Anatolian Crystalline
Complex (CACC) in the Paleocene, a new phase of extension and volcanism concomitantly developed along the northern (Almus;
Pontides) and southern (Yıldızeli; CACC) sides and along the IAESZ during the Middle Eocene time interval. The first products of the
Middle Eocene volcanism in these areas are represented by calc-alkaline to alkaline (basic-intermediate) volcanic and volcanoclastic
units together with late-stage trachytic dikes, plugs, and stocks. The mantle source area of both volcanic units displays a metasomatized
character, which was dominantly fluxed by sediment-sourced melts. The partial melting of the metasomatized source area gave rise
to first-stage basic-intermediate volcanism in the crustal levels. Simultaneously with the generation of the first-stage volcanism,
basaltic trachyandesitic shallow-seated magma mushes were also developed. The reactivation of these shallow-seated mushes by latestage extensional tectonics gave rise to the development of trachytic volcanism in both regions, which have a high-K to shoshonitic
character. Almus trachytic lavas are phenocryst-poor and have differentiated Mg# numbers (avg. 26). On the other hand, Yıldızeli
trachytic lavas have a broad compositional range (benmoreite to latite); they are phenocryst-rich and show more basic character (Mg#
avg. 40). Trachytic volcanism in both areas is largely controlled by fractional crystallization of similar basaltic trachyandesitic parental
magma with minor assimilation of the upper crustal lithologies. 40Ar-39Ar ages from sanidine phenocrysts from both areas also confirm
that trachytic volcanism in both regions developed nearly coevally in different tectonic blocks (~41–40 Ma). Generation of similar
volcanism on the different tectonic blocks during the postcollisional stage was probably governed by a regional-scale delamination and/
or lithospheric removal-related tectonomagmatic processes.
Key words: Postcollisional magmatism, Middle Eocene, potassic magmatism, 40Ar-39Ar geochronology, geochemical modeling
1. Introduction
Trachytic volcanism can be developed in many tectonic
environments such as continental rifts (Baker, 1987;
Peccerillo et al., 2003), plume-induced regions (Lightfoot
et al., 1987; Ashwal et al., 2016), subduction zones (Clark
et al., 1982; Duggen et al., 2005; Gülmez et al., 2016), and
postcollisional tectonic settings (Peccerillo and Taylor
1976; Chung et al., 2005). Among these, postcollisional
settings are particularly important because they can
give valuable information about the building stages and
evolution of the freshly accreted lithospheric domains
without any influence of an actively subducting slab
(e.g., Guo et al., 2015). Petrogenesis of postcollisional
trachytic rocks and potassic magmatism do not have a
unique mode of generation in all cases, and the process
can be governed by different orders of partial melting,
fractional crystallization/assimilation, and magma mixing
*Correspondence:
depending on the tectonomagmatic behavior of the studied
systems (e.g., Conticelli et al., 2009). On the other hand,
postcollisional lithospheric domains are generally already
metasomatized by the previous subduction, collision, and
accretion event; thus, the source area and the generation of
the trachytic/potassic volcanism can be strongly influenced
by different and heterogeneous components (e.g., Prelević
et al., 2013; Gülmez et al., 2016; Wang et al., 2017).
In past decades, the trachytic rocks from the
postcollisional Cenozoic (middle Eocene) magmatic series
of Turkey, and particularly the region along the northern
part of the İzmir-Ankara-Erzincan suture zone (IAESZ),
have been documented in different cases (Keskin et al.,
2008 and references therein; Temizel et al., 2012; Arslan et
al., 2013; Yücel et al., 2014, 2017). Petrological evolution of
some portion of these rocks is explained by postcollisional
delamination-governed
tectonomagmatic
processes
1
GÖÇMENGİL et al. / Turkish J Earth Sci
together with assimilation-related modifications (Temizel
et al., 2016; Yücel et al., 2017). However, the generation of
coevally developed trachytic units along the other parts of
the IAESZ is poorly documented and the petrogenesis of
these units needs to be clarified.
Here, we give an example of trachytic volcanism that
developed nearly coevally around both sides of the IAESZ
long after the subduction of the northern Neo-Tethyan
slab (~25 Ma.). Trachytic volcanism in our case was
developed on the northern (Almus region, Pontides) and
southern (Yıldızeli region, Central Anatolian Crystalline
Complex (CACC)) continental blocks in a postcollisional
extensional setting during the waning stages of the
widespread Middle Eocene magmatism.
In this study we utilized 1:25,000 scale field
mapping together with bulk-rock geochemistry, isotope
geochemistry, and Ar-Ar geochronology techniques in
order to understand the generation of trachytic volcanism
around both sides of the IAESZ. We show that the
trachytic volcanic units that developed on drastically
different tectonic blocks were generated nearly coevally
in time and space. Thus, we also show that they shared
a common metasomatized source area and experienced
similar geochemical evolution within the crustal levels
by fractional crystallization and different amounts of
assimilation-related modifications.
The Anatolian Plate has undergone a complex tectonic
evolution, which was shaped by the obliteration of different
portions of the Tethyan Ocean, collision of the different
tectonic blocks, and subsequent syn- to postcollisional
magmatism since the Paleozoic (Şengör and Yılmaz,
1981; Yilmaz et al., 1997b; Okay and Tüysüz, 1999). The
vanishing of the northern branch of the Neo-Tethyan
ocean during the Cretaceous and subsequent collision of
the Pontides and Anatolide-Tauride microcontinents with
the CACC in the Paleocene gave rise to a long and narrow
ophiolitic mélange belt called the IAESZ at the northern
part of the Anatolian Plate (Şengör and Yılmaz, 1981; Okay
and Tüysüz, 1999) (Figure 1a). Around both sides and
along this suture zone, postcollisional Eocene magmatism
(particularly Middle Eocene) developed through the
western to eastern part of the Anatolian Plate and is
represented by granitoids (Harris et al., 1994; Genç and
Yılmaz, 1997; Topuz et al., 2005; Arslan and Aslan, 2006;
Okay and Satır, 2006; Karslı et al., 2007, 2011; Boztuğ, 2008;
Karacık et al., 2008; Ustaömer et al., 2009; Altunkaynak et
al., 2012; Gülmez et al., 2013; Kaygusuz and Öztürk, 2015,
Özdamar et al. 2017), gabbroic intrusions (Boztuğ et al.,
1998; Temizel et al., 2014; Eyuboglu et al., 2016), and calcalkaline, mildly alkaline, and potassic/shoshonitic volcanic
products (Figure 1b; Peccerillo and Taylor, 1976; Keskin
et al., 2008 and references therein; Karslı et al., 2011,
Kaygusuz et al., 2011; Arslan et al., 2013 and references
2
therein; Aydınçakır and Şen, 2013; Dokuz et al., 2013;
Gülmez et al., 2013; Aslan et al., 2014; Aydınçakır, 2014,
Sipahi et al., 2014; Yücel et al., 2014; Kasapoğlu et al., 2016;
Temizel et al., 2016).
Postcollisional Eocene magmatic units in the NE part
of Turkey developed along both sides of the IAESZ and
cover both tectonic blocks (Pontides and CACC) with a
region-wide angular unconformity (Figure 1b; Yilmaz et
al., 1997a; Keskin et al., 2008). The early Eocene phase
of this magmatism developed during the late stages of
the collisional period between the Pontides and CACC
blocks and is generally marked by adakitic (Topuz et al.,
2005; Eyüboğlu et al., 2011; Karslı et al., 2011) and scarce
calc-alkaline geochemical magmatic units (Aydınçakır,
2014). Subsequent middle Eocene magmatism is more
voluminous and diverse in terms of geochemistry and
crops out along the whole range of the IAESZ (Keskin et
al., 2008 and references therein). Middle Eocene volcanic
units along the IAESZ are generally found within the
similar volcanosedimentary successions that crop out
along the western to eastern portion of the northern part
of the Anatolian Plate. Depending on the similarities in
terms of stratigraphy and bulk-rock geochemistry of the
intercalated lavas, Middle Eocene volcanosedimentary
sequences along the IAESZ range are collectively
investigated as the Middle Eocene Volcano-Sedimentary
Belt (MEVSB; Keskin et al., 2008). In general, MEVSB
successions contain shallow marine sedimentary units
(fossiliferous limestone-sandstone) at their lowermost
parts and subaerial subalkaline-to-alkaline volcanic units
through the middle to uppermost parts of their successions
(Keskin et al., 2008). Along the eastern part of the IAESZ,
middle Eocene volcanosedimentary units that are identical
to the MEVSB crop out along two W-E trending belts in
the vicinity of the towns of Almus (Pontides) and Yıldızeli
(CACC), respectively (Yilmaz et al., 1997b; Göçmengil et
al., 2016).
2. Geological features of the study area
The Middle Eocene volcanosedimentary units in the Almus
and Yıldızeli areas developed on different basements.
In the Almus (Tokat) area, basement units consist
of Paleozoic-Mesozoic Tokat Massif and Bakımlıdağ
Complex units (Yılmaz, 1984; Bozkurt and Koçyiğit, 1996;
Özcan and Aksay, 1996; Yilmaz et al., 1997a; Sümengen,
2013a, 2013b). The Tokat Massif comprises low-grade
metamorphic units (metabasite, marble, serpentinite,
mica-schist, amphibolite, and scarce blueschist). The
Bakımlıdağ Complex is made up of gabbro, serpentinite,
and cross-cutting dolerite dikes. All these basement
units are unconformably overlain by Middle Eocene
volcanosedimentary successions. Neogene sedimentary
units and Quaternary sedimentary successions are the
youngest units in the area (Figure 2).
GÖÇMENGİL et al. / Turkish J Earth Sci
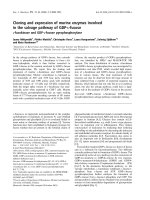
Figure 1. a) Geological map of the Eocene volcanic units in the northern part of Turkey. IPSZ: Intra-Pontide Suture Zone,
IAESZ: İzmir-Ankara-Erzincan Suture Zone, ITSZ: Inner-Tauride Suture Zone, CACC: Central Anatolian Crystalline Complex.
b) Simplified geological map of the NE part of Turkey. Locations of the study areas are marked in rectangles. Both maps are
simplified from the MTA (2002) geological map of Turkey.
The Yıldızeli area is situated at the southern part of the
IAESZ. The basement units along this area are made up
of metamorphic and magmatic units of CACC (Kırşehir
Block) and IAESZ units (Figure 2; Yilmaz et al., 1997a).
CACC units in the Yıldızeli area are represented
by marble, quartzite, phyllite, mica-schist, and scarce
garnet amphibolite together with plutonic units. In the
literature, metamorphic units in this area were reported
to be the Akdağ metamorphics (Tatar, 1977; Gökten,
1993), Yıldızeli metamorphics (Alpaslan et al., 1996), and
Akdağmadeni metamorphics (Yılmaz, 1984). The age of
metamorphism was depicted as between 68 and 77 Ma by
the K-Ar method (Alpaslan et al., 1996). Plutonic units
in the CACC are represented by small-scale granitic and
3
GÖÇMENGİL et al. / Turkish J Earth Sci
Figure 2. Geological map of the Almus town center and surroundings.
syenitic intrusions. A distinct and relatively large plutonic
unit, which is called the Banaz syenite, crops out at the NE
part of the Yıldızeli area (Figure 3). The crystallization age
of the Banaz Syenite is constrained by the Ar-Ar method
to be 68.93 ± 2.13 Ma and 75.76 ± 1.46 Ma by mixed biotite
and amphibole separates (our own unpublished data).
IAESZ units along the Yıldızeli area are represented
by two main rock groups: i) an accretionary complex
consisting of fault-bounded blocks and tectonic slices
of metabasite, gabbro, serpentinite, amphibolite, chert,
pillow-lava, gabbro, and dolerite (Tatar, 1977; Yılmaz,
1984; Yilmaz et al., 1997b; Çörtük et al., 2016) and ii) the
Hıdırnalı Group, which is made up of a highly deformed
4
mixture of sandstone-shale alternation (like wild flysch),
epiclastic sandstone, basaltic lava flows, scarce pyroclastic
units together with pelagic limestone, serpentinite,
and pillow lava blocks. Some parts of these units were
previously described as the Kılıçlı Olistostrome (Yılmaz
1984; Yılmaz et al., 1995), Boğazköy Formation (Yılmaz et
al., 1995), and Paleogene Flysch (Tatar, 1977). The tectonic
setting of the Hıdırnalı Group was interpreted as a remnant
fore-arc basin that was active throughout the closure and
suturing stages of the northern branch of the Neotethys
Ocean (Yilmaz et al., 1997a; Keskin et al., 2008). Basement
units in the Yıldızeli are sealed by the middle Eocene
volcanosedimentary sequences. Neogene sedimentary
GÖÇMENGİL et al. / Turkish J Earth Sci
Figure 3. Geological map of the Yıldızeli town center and surroundings
5
GÖÇMENGİL et al. / Turkish J Earth Sci
by Neogene and Quaternary sedimentary successions.
The E-W oriented Almus Fault zone cuts and disrupts the
primary relationships within the Almus Group (Bozkurt
and Koçyiğit, 1996).
Lava flows and volcanoclastic lithologies are intercalated
with each other in random order throughout the entire
range of the Almus Group. Lava flows are represented
by two different episodes, as depicted in stratigraphy and
Ar-Ar ages (Göçmengil et al., 2017). The first episode
contains two different subgroups: the primary subgroup
contains basaltic andesite, andesite, dacitic lava flows
and is generally situated at the lower levels of the Almus
Group. The secondary subgroup constitutes basaltictrachyandesites, pyroxene-bearing basaltic andesites, and
olivine basalts and becomes dominant through the upper
parts of the Almus Group. The final volcanic episode of
volcanism in the Almus Group is represented by trachytic
dikes and plugs, which are mainly situated at the eastern
parts of the Almus region.
Trachytic dikes and plugs display NW-SE, E-W, and
NE-SW orientations and they generally intrude into the
red epiclastic sandstones of the Almus Group (Figure 5a).
Their widths vary from 5–10 m to 300–400 m. Trachytic
units (İncesu Formation) and Quaternary alluvium are the
youngest units in the Yıldızeli region (Figure 3).
In both areas, middle Eocene volcanosedimentary
sequences show a remarkably similar stratigraphic order
(Figures 4a and 4b). The MEVSB units in Almus, which
are called the Almus Group, contain sedimentary and
volcanic units with different thicknesses and variations.
Some parts of this volcanosedimentary unit have been
mapped under different names such as the Haydaroğlu
Formation (Yılmaz, 1984), Doğanşar Formation (Terlemez
and Yılmaz, 1980), Çökelikkışla Formation, and Kadıvakfı
Limestone (Özcan and Aksay, 1996). In order to avoid
confusion we collectively name all of these units the Almus
Group.
The volcanosedimentary units in the Almus area have
flat dips through the north and crop out along the E-W and
NW-SE directions. The sedimentary part of the sequences
contains basal conglomerates, fossiliferous sandstones,
and coal-bearing sandstone-conglomerate alternations.
The volcanic unit in the sequences, which we call the
Almus volcanics, contains lava flows, brecciated lavas,
volcanoclastic flow breccias, and epiclastic units together
with dikes, necks, and plugs. The Almus Group is covered
(a)
(b)
Quaternary
Neogene
Quaternary
Alluvium
Gökköy Formasyonu
(sandstone-conglomerate-limestone)
Neogene
Trachyte
Coal bearing
sandstone-conglomerate
Quartz dike
Trachyte
Dasitic lava flow
Epiclastic red sandstone
Pyroclastic units (tuff and
block and ash fall units)
Yıldızeli Group
Undifferentiated
lava flows (basalt, basaltic
andesite, andesite)
Almus
volcanics
Middle Eocene
Almus Group
Middle Eocene
Volcanoclastic flow
breccias
Brecciated lava flow
(basalt, basaltic
andesite, andesite)
Basaltic andesite
dike
Undifferentiated lava flows
(basalt, basaltic
andesite, andesite)
Hıdırnalı Group
Basement
Units
Mesozoic
Basement
Units
Early
Eocene
Mesozoic
Yıldızeli
volcanics
Tokuş formation
(conglomerate, foram inifera bearing limestone,sandstone)
Foraminifera bearing
sandstone
Tokat Massif
Figure 4. Generalized stratigraphic sections of the (a) Almus and (b) Yıldızeli regions.
6
Brecciated lava flow (basalt,
basaltic andesite, andesite)
Epiclastic conglomerate,
sandstone
Epiclastic sandstoneconglomerate
Bakımlıdağ Complex
Alluvium
İncesi Formation
(conglomerate-sandstone)
İzmir-Ankara-Erzincan Suture zone units
Central Anatolian Crystalline Complex
Banaz Syenite
GÖÇMENGİL et al. / Turkish J Earth Sci
(a)
(b)
Tokat Massif
Trachyte
Epiclastic
red sandstone
Basaltic
lava flows
(c)
(d)
(e)
(f)
.
.
Monzodioritic/monzonitic
enclave
Epiclastic
horizon
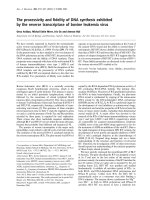
Figure 5. a) General view of a trachyte plug that cut the Almus Group volcanics and epiclastic red sandstone. b) Sanidine laths
in phenocryst-poor Almus trachytes. c) General view of the phenocryst-rich Yıldızeli trachytic lavas. d) Close-up view of the
sanidine phenocrysts in Yıldızeli trachytic lavas. e) Monzodioritic/monzonitic enclaves in trachytic lavas. f) Intercalations of
trachytic lava flows and epiclastic layers.
dikes and plugs display gray, yellow, and purple colors
and show rare flow banding. Most of the trachytic lavas
are aphanitic and phenocryst-poor (Figure 5b). However,
in the areas where phenocryst assemblages are more
apparent, they are generally represented by sanidine (up
to 1 cm) and small plagioclase laths (<0.4 cm) with a clear
porphyritic texture. Rare quartz-bearing lithophysae (2–10
cm) are also randomly distributed along the different dyke
7
GÖÇMENGİL et al. / Turkish J Earth Sci
suites. Most of the trachytic lavas are extensively altered
and argillization and hematitization are common.
MEVSB units in the Yıldızeli region are investigated
as Pazarcık volcanics in the literature (Alpaslan, 2000).
However, the age of the Pazarcık volcanics is not precisely
constrained and they may correspond to the older volcanic
units that are dispersed along the Hıdırnalı Group. For that
reason, in a similar manner to the naming of the Almus
Group, we investigated the Middle Eocene successions
along the Yıldızeli area as the Yıldızeli Group. The rock
types and depositional character of the Yıldızeli Group are
remarkably similar to the Almus Group. Lower levels of
the stratigraphic sequences of the Yıldızeli Group consist
of shallow marine sedimentary units. In addition, the
middle to upper parts of the sequences consist of volcanic,
volcanoclastic, and pyroclastic units together with latestage stocks and plugs. Shallow marine sedimentary
successions of the Yıldızeli Group are documented as the
Tokuş Formation and are well defined in the literature
(Yılmaz et al., 1995). This unit consists of foraminiferabearing sandstone and limestone alternations together
with basal conglomerates. In addition, sporadic blocks
from the marbles and syenites of the CACC are also
found as olistoliths surrounded by the Tokuş Formation
sedimentary package. The size of the olistoliths is variable
(3–5 to 30–40 m).
The volcanic part of the Yıldızeli Group, which is here
named the Yıldızeli volcanics, also shows similar features
with the Almus volcanics in terms of the generation of
the two episodic volcanic stages during their stratigraphic
evolution. The first episode of volcanism contains
andesite, dacite, and basaltic andesite (first subgroup)
together with pyroxene basaltic andesite and olivine basalt
(second subgroup). The final episode of the volcanism is
represented by trachytic stocks and dikes.
Trachytic stocks and dikes of the Yıldızeli area were
investigated as Çakmak trachyporphyry (according
to the definition of Alpaslan, 1997) or Yukarıçakmak
volcanics (Yılmaz et al., 1995) in previous studies. Overall,
the trachytic body has a flat, dome-like elliptical shape
and approximately covers a surface area of 15 km2 with
a roughly east to west orientation. Additionally, at the
southern part of the dome, small trachytic dikes and plugs
of various sizes (1–2 to 15–20 m) can also be recognized.
The trachytic stock generally does not show prominent
lava flow features due to high viscosity, but the eastern
part of the trachytic body displays flow foliation. Trachytic
stock and dikes cut the sedimentary rocks of the Tokuş
Formation with intrusive contacts. At the contact zones,
hematitization and silicification are extensively developed,
especially at the boundaries with the shallow marine
limestones. Additionally, dark-colored, fine-grained
monzodioritic/monzonitic enclaves are occasionally
8
found within the trachytic stock. Late-stage quartz and
silex veins also cut the trachytes and mark the last stage of
the silicic volcanism in the area.
Trachytic stocks and dikes are generally gray, purple, and
pale violet in color and are strongly affected by alteration
processes. They typically display a porphyritic texture and
contain sanidine + plagioclase + biotite + amphibole +
quartz ± clinopyroxene phenocrysts (Figure 5c). Sanidine
phenocrysts reach up to 5–6 cm in some areas (Figure
5d). However, other phenocrysts are generally represented
by smaller fine-grained laths (<0.5 cm). Monzodioritic/
monzonitic enclaves have oblate shapes and their sizes are
dispersed in the ranges of 1–2 to 30–40 cm (Figure 5e).
Enclaves display sharp contacts with the host trachyte. In
the eastern part of the trachytic stock in the Yıldızeli area,
rare epiclastic sandstone horizons, which were developed
between the trachytic lavas, are occasionally found. The
thickness of the epiclastic units vary from 1–2 cm to 50–60
cm and display purple and grey colors (Figure 5f).
3. Petrography
In both areas, trachytic lavas display similar porphyritic
and ‘trachytic’ textures (Figure 6a). Trachytic lavas of
the Almus region are phenocryst-poor (avg. 20%–30%)
compared to the Yıldızeli samples (50%–65%) (Table 1).
The major phenocryst phases for trachytic suites from
both regions are represented by sanidine + plagioclase
(An10–40) ± biotite ± amphibole + opaque minerals (mainly
represented by ilmenite) ± clinopyroxene ± quartz and
accessory apatite phenocrysts (Figures 6a and 6b). One
important distinction between the two areas is that the
amphibole phenocrysts are only detected in the Yıldızeli
trachytic lavas.
Sanidine constitutes the main phenocryst phase with
apparent Carlsbad twinning and it occasionally contains
inclusions of biotite. Amphibole and biotite phenocrysts
have euhedral shapes and generally display no apparent
zoning. Biotite phenocrysts are fine-grained (<0.3 mm)
and display kink bands (Figure 6c), probably due to
contraction and bending during the flow propagation.
Contrary to the other mafic phases, clinopyroxene
phenocrysts are sparse and generally display irregular
boundaries or patchy textures with surrounding matrix.
Disequilibrium textures along most of the clinopyroxenes
might be indicative of an antecryst/xenocrystic origin
(Figure 6d). Quartz phenocrysts in some samples display
clear reaction patterns and magmatic corrosion with the
matrix of the host lava and they can also be xenocrystic in
origin (Figure 6e).
In all samples, argillization is quite dominant and
both feldspar phases are strongly altered to kaolinite and
smectite minerals. In addition, mafic phenocrysts are
commonly replaced by opaque phases, which commonly
display pseudohexagonal outlines.
GÖÇMENGİL et al. / Turkish J Earth Sci
(b)
(a)
San
“Trachytic” texture
1mm
1mm
(d)
(c)
.
Bt
Bt
Cpx
Amp
San
1mm
1mm
(f)
(e)
Host trachytic
lava
Enclave
Qtz
Amp
0,5mm
1mm
Figure 6. a) Trachytic flow textures in studied lava flows. b) Large sanidine phenocryst in trachytic lava
flows. c) Flow bending of the biotite minerals. d) Patchy clinopyroxene phenocrystal in trachytic lavas. e)
Xenocrystic quartz displays reaction textures with the host lava. f) Monzodioritic/monzonitic enclave in
trachytic host lava. San: Sanidine; Bt: biotite; Cpx: clinopyroxene; Amp: amphibole; Qtz: quartz.
9
GÖÇMENGİL et al. / Turkish J Earth Sci
Table 1. Modal mineral abundances from the studied samples from Almus and Yıldızeli trachytic volcanic units.
Mineral abbreviations from Whitney and Evans (2010).
Samples
Cpx
Pl
Kfs
Amp
Opq
Qtz
Bt
Cal
Mtrx
Almus
70
2
-
18
-
5
-
-
5
70
201
-
5
17
-
-
-
2
5
70
285
-
5
10
-
5
-
-
-
80
671
-
5
18
-
-
5
2
-
80
5
10
25
-
-
3
3
5
1
45
-
5
-
38
Yıldızeli
320
331
-
25
15
2
7
354
2
10
25
10
5
40
356
5
20
15
-
15
-
5
-
40
369
20
5
25
5
5
5
-
-
45
20
25
5
5
5
5
15
25
5
5
5
25
10
7
12
20
10
3
5
832
834
837
937
3
40
45
2
3
50
5
45
Yıldızeli enclaves
356A
5
25
25
40
795
5
25
35
35
Cpx: Clinopyroxene; Pl: plagioclase; Afs: alkali-feldspar; Cal: calcite; Amp: amphibole; Opq: opaque mineral; Bt:
biotite; Mtrx: matrix.
Monzodioritic/monzonitic enclaves of the Yıldızeli
area contain sanidine + amphibole + plagioclase + opaque
minerals + rare clinopyroxene (Figure 6f). fTexturally,
enclaves display subophitic and poikilitic features. Alkali
feldspars have euhedral shapes and are usually finer
grained compared to the host lava (<0.3 cm). Amphiboles
display acicular and/or star-like shapes. Clinopyroxenes in
the enclaves are euhedral and are recognized easily by their
cleavages and purple-violet birefringence colors. Contrary
to host trachytic lavas, monzodioritic/monzonitic enclaves
are less affected by the alteration; however, smectitization
is common along the feldspars.
4. Analytical techniques
Bulk-rock geochemistry of thirteen lava samples and
two monzodioritic/monzonitic enclaves were performed
at ACME Analytical Laboratories Ltd. (Bureau Veritas),
Canada. The major and trace element compositions were
measured by ICP-AES after samples of 0.2 g of rock powder
were fused with 1.5 g of LiBO2 and then dissolved via four
acid-digestion steps. The loss on ignition was determined
by the weight difference after ignition at 1000 °C. The total
iron concentration was expressed as Fe2O3. The detection
10
limits are in the range of 0.001 to 0.1 weight percent (wt.%)
for major element oxides, 0.1 to 10 ppm for trace elements,
and 0.01 to 0.5 ppm for the rare earth elements (REEs).
Calibration and verification standards, together with
reagent blanks, were added to the sample sequence.
Whole-rock Sr and Nd isotope analyses were made
at the Radiogenic Isotope Laboratory of the Middle East
Technical University Central Laboratory by using the
standard cation-exchange techniques explained by Köksal
and Göncüoğlu (2008). Sr and Nd isotopic data were
detected by using a Thermo Finnigan Triton thermal
ionization mass spectrometer in static multicollection
mode. 87Sr/86Sr and 143Nd/144Nd data are normalized to
86
Sr/88 Sr = 0.1194 and 146Nd/144Nd = 0.7219, respectively.
Sr NIST SRM 987 and Nd La Jolla standards were deduced
as 0.710242 ± 10 (n = 3) and 0.511849 ± 10 (n = 2),
respectively. No corrections were applied to Nd and Sr
isotopic compositions for instrumental bias. Analytical
uncertainties are given at the 2σm level.
40
Ar/39Ar radiometric age determinations have been
carried out on two different trachytic lava flows from
the Almus and Yıldızeli areas. Sanidine phenocrysts
are extracted to constrain the crystallization age of
GÖÇMENGİL et al. / Turkish J Earth Sci
the trachytic lava flows. 40Ar/39Ar age determinations
were done at the Auburn Noble Isotope Mass Analysis
Laboratory (ANIMAL) facilities in Auburn, AL, USA. The
extractions of phenocrysts were undertaken by crushing
and sieving. Afterwards, the samples were washed with
deionized water. A magnetic separator was used to
avoid undetermined iron-oxide-bearing (altered) and/or
inclusion-bearing phenocryst assemblages. The possible
phenocrysts for age determination (0.5 mm to 1 mm)
were hand-picked under a binocular and washed again
with deionized water. Selected grains were wrapped in
aluminum disk with an FC-2 monitor (age = 28.02 Ma.;
Renne et al., 1998) along with a CaF2 flux monitor and
irradiated at the McMaster University Research Reactor in
Ontario, Canada.
The ANIMAL facility is equipped with a low-volume,
ultrahigh-vacuum, 90° sector, high-sensitivity 10-cmradius sector mass spectrometer and automated sample
extraction system (based on a 50-W Synrad CO2 laser) for
analysis of different minerals.
All of the statistical 40Ar/39Ar ages in this study are
quoted at the 95% confidence level, whereas errors in
individual measurements are quoted as one standard
deviation (1σ). Data handling and interpretation of
statistical ages were done using Microsoft Excel and Isoplot
(Ludwig, 2003). The plateau in this study was defined as
at least three or more contiguous increments containing
more than 50% of the 39ArK in three or more contiguous
steps with no resolvable slope among them.
5. Results
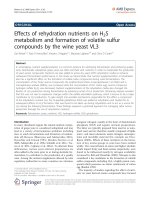
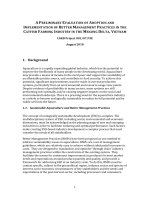
5.1. Radiometric age determinations
Due to extensive alteration of the trachytic samples,
stepwise 40Ar-39Ar age determinations were only applied
to sanidine separates. A sanidine phenocryst from the
Almus trachytic plug gave a well-defined age spectrum of
41.9 ± 0.048 Ma (Figures 7a and 7b). In addition, another
sanidine phenocryst from the Yıldızeli trachytic stock gave
a similar but younger crystallization age (Figures 7c and 7d;
40.526 ± 0.086 Ma). These results show that the trachytic
lava flows are Middle Eocene in age and postdate the first
episode basic volcanism. However, a single mineral data
point from each area can represent only a limited snapshot
of the magmatic reservoir that leads the development of
the trachytic volcanics, which should be also explored by
the combined approach of different age determination
techniques (e.g., U-Pb and paleontological correlations;
Cooper, 2017). However, the age determinations, together
with stratigraphic relationships, undoubtedly demonstrate
that the trachytic volcanic products were generated at the
final stage of the Eocene magmatism for the two distinct
areas.
5.2. Bulk-rock geochemistry
Major and trace element compositions of thirteen
trachytic lavas (four samples from Almus and nine from
Yıldızeli) and two monzodioritic/monzonitic enclave
samples are given in Table 2. All units have elevated loss
on ignition (LOI) values, which can alter the original bulk
geochemistry of the samples (1.1–5.2 wt.%). To test the
reliability of the obtained geochemical data, the chemical
index of alteration (CIA; Nesbitt and Young, 1982, 1984)
and a statistical alteration approach for igneous rocks
termed MFW (Ohta and Arai, 2007) are applied to the
bulk geochemical analysis. CIA values of 30–45 generally
correspond to unaltered basic rocks (Nesbitt and Young,
1982). Nearly all samples are below and near a value of 50
except for one trachyandesitic sample from the Yıldızeli
trachytic suite (sample #331), which gives a value of 56
for the CIA (Figure 8a). Furthermore, the MFW approach
also confirms that nearly all lavas align along the magmatic
trend and are poorly affected by alteration processes except
sample #331 (Figure 8b). Therefore, the majority of our
bulk-rock geochemical dataset is suitable for geochemical
interpretation.
In the total alkali versus silica (TAS) diagram, all volcanic
samples are plotted on the trachyandesite and trachyte
fields (Figure 8c). Samples from the Yıldızeli region are
classified as trachyandesite. Hence, based on their elevated
sodium content (Na2O – K2O >2% mass percent), some
portion of the samples can be classified as benmoreite,
latite, and trachyte according to the nomenclature of Le
Bas et al. (1986). All of the samples plotted are on, near,
or above the alkaline-subalkaline divide (Figure 8c).
Monzodioritic/monzonitic enclaves are plotted on the
basaltic trachyandesite and trachyandesite fields in the
TAS diagram, corresponding to the plutonic equivalents
of monzodiorite and monzonite (Middlemost, 1994).
Based on the total potassium to silica bivariate diagram,
all samples are high-K and shoshonitic in nature (Figure
8d; Peccerillo and Taylor, 1976). The Almus Group rocks
are significantly more K-rich compared to the Yıldızeli
samples. The samples plot on the high-K and shoshonitic
fields on the Co-Th classification diagram developed for
discriminating altered volcanic rocks (Figure 8e; Hastie
et al., 2007). Based on the silica saturation index, enclaves
and one trachytic sample from Yıldızeli are plotted in silica
under saturated field; on the contrary, the majority of the
lava flows are situated in silica oversaturated shoshonitic
and potassic fields (Figure 8f).
Contents of major oxides SiO2 and MgO of the
trachytic lavas are dispersed between 55.3–61.6 wt.% and
0.56–2.7 wt.%, respectively. Monzodioritic/monzonitic
enclaves are silica-poor and magnesium-rich with respect
to the trachytic lavas (SiO2: 53.9–56.8 wt.%; MgO: 2.4–3.9
wt.%). The high silica and magnesium contents of the
11
GÖÇMENGİL et al. / Turkish J Earth Sci
Plateau steps are filled, rejected steps are open
(a)
60
box heights are 1σ
6
Almus; Trachyte,
Sa, # 201
(b)
5
Relative probability
Number
Age (Ma)
4
40
Plateau age = 41.90 ± 0.048 Ma
MSWD = 0.66, probability=0.88
Includes 100% of the 39Ar
20
3
2
1
0
0.0
0.2
0.4
Cumulative
60
0.6
39
0
40 .0
1.0
42 .0
43 .0
box heights are 1σ
6
(d)
5
Number
Age (Ma)
40
Plateau age = 40.526 ± 0.085 Ma
MSWD = 0.66, probability=0.70
Includes 84.1% of the 39 Ar
Relative probability
4
30
3
2
1
20
0.0
0.2
0.4
0.6
44 .0
Age (Ma)
Yıldızeli, Trachyte
Sa, # 354
50
41 .0
Ar Fraction
Plateau steps are filled, rejected steps are open
(c)
0.8
0.8
1.0
Cumulative 39 Ar Fraction
0
38.0
39.0
40.0
41.0
42.0
43.0
Age (Ma)
Figure 7. a) Result of single-crystal step-heating 40Ar-39Ar dating from a sanidine phenocryst from Almus trachytic lava sample
#201. b) Relative probability chart of the age determination presented in Figure 7a. c) Result of single-crystal and step-heating
40
Ar-39Ar dating from a sanidine phenocryst from Yıldızeli trachytic lava sample #354. d) Relative probability chart of the age
determination shown at the Figure 7c. Sa: Sanidine.
enclaves relative to trachytic lavas suggest that they might
represent the primitive phase of the trachytic volcanic
system. Therefore, the enclaves are interpreted as basaltic
trachyandesitic primitive end members in terms of their
geochemical character. Major element variations from
the primitive members (enclaves) to the more silicic
members show that TiO2, Fe2O3, MgO, and P2O5 values
display decreasing to flat correlations with increasing silica
content (Figures 9a–9d). On the contrary, Al2O3 and Na2O
values show flat to increasing trends with increasing silica
(Figures 9e and 9f). Noticeable inflections are detected
in the CaO and the Na2O variation diagrams near a silica
content of ~57 wt.%. After that, the silica level CaO values
decreased (Figure 9g).
Trace element concentrations also show different
correlations based on the increasing silica content.
Compatible elements of Co and Sc show decreasing
12
content with increasing silica (Figures 10a and 10b). High
field-strength elements (HFSEs) Zr and Th positively
correlate with increasing silica content (Figures 10c and
10d). Ba also displays similar behavior as the HFSEs but
this variation is only detected for the Yıldızeli samples
(Figure 10e). The large ion lithophile element (LILE) Rb
is generally scattered along the whole silica range without
displaying any dominant trend (Figure 10f). Additionally,
Sr shows a flat to decreasing trend with increasing silica
(Figure 10g). On the contrary, Y displays flat to increasing
trends within increasing silica (Figure 10h).
Multielement diagrams of all samples display relative
enrichments for most of the trace elements compared to
the normal mid-ocean ridge basalt (N-MORB), except
for the elements Ti, Yb, and Y (Figure 11a). There are also
noticeable negative anomalies that can be seen for Nb-Ta,
Ba, P, and Ti relative to the other trace elements. HFSE
GÖÇMENGİL et al. / Turkish J Earth Sci
Table 2. Whole-rock analysis from the trachytic lava flows and enclaves from Almus and Yıldızeli areas. Total iron oxide content
expressed as Fe2O3.
Almus trachytic lava flows
Yıldızeli trachytic lava flows
Yıldızeli enclaves
1. Sample
70
201
285
671
320
331
354
356
369
832
834
837
937
356A
795
SiO2
59.41
60.24
60.52
59.69
60.19
60.54
61.67
61.2
57.04
58.48
58.97
55.33
55.89
53.96
56.84
TiO2
0.72
0.73
0.75
0.72
0.48
0.56
0.52
0.53
0.77
0.49
0.49
0.64
0.57
0.9
0.78
Al2O3
16.69
17.03
17.43
16.52
17.06
19.77
18.28
18.4
16.33
17.71
17.29
17.14
17.84
17.95
17.8
Fe2O3
3.68
4.15
4.28
4.39
4.07
3.91
4.18
4.2
3.25
4.16
4.18
5.03
4.8
7.14
6.46
MnO
0.08
0.1
0.08
0.12
0.06
0.02
0.06
0.06
0.08
0.08
0.09
0.11
0.08
0.08
0.07
MgO
0.65
0.9
0.56
0.86
1.21
0.6
1.29
1.44
2.6
1.05
1.02
2.32
2.73
3.69
2.42
CaO
3.66
2.81
2.62
2.86
3.46
0.8
1.72
2.21
7.95
5.71
5.88
5.61
4.05
4.77
4.39
Na2O
K2O
P2O5
Cr2O3
3.67
4.3
4.5
4.07
5.95
6.13
6.52
6.36
5.26
4.01
3.92
4.34
5.37
4.66
5.56
7.11
6.29
5.88
7.07
3.61
5.06
4.25
3.64
1.94
3.71
3.68
3.9
3.6
3.1
2.75
0.26
0.25
0.26
0.25
0.22
0.23
0.23
0.22
0.21
0.22
0.21
0.19
0.22
0.34
0.34
b.d.l.
0.003
0.004
b.d.l.
b.d.l.
0.009
0.04
0.052
0.033
b.d.l.
0.003
0.003
0.003
0.011
0.003
LOI
3.9
3.1
3
3.3
3.5
2.1
1.1
1.5
4.3
4.2
4
5.2
4.6
3.2
2.4
TOTAL
99.86
99.85
99.84
99.85
6.5
99.77
99.76
99.78
99.81
99.8
99.84
99.85
99.85
99.75
99.82
Sc
8
8
7
8
2,9
6
8
8
20
7
7
12
10
18
14
V
58
66
60
64
9.56
102
88
85
143
85
79
116
64
154
124
Ni
<20
<20
<20
<20
<20
<20
<20
<20
26.7
<20
3.9
8.4
5.4
<20
2.7
Co
2.6
6
4
3.3
6.5
5.6
8.3
7.8
12.9
9.6
10.7
13.9
12.7
16.6
14.7
Cu
23.9
24.7
22
17.2
3.5
5.8
14.9
8.1
30.8
9.7
8.8
20.8
8.7
11.5
12.9
Zn
90
82
71
112
22
33
48
35
32
43
42
43
53
17
19
Rb
191.2
188.5
188.4
197.1
134.8
243.7
170.2
155.8
55.5
175.6
183.1
189.3
130
149.7
102.6
Sr
124.5
132.9
136.8
135.3
485.7
707.6
679.2
581.2
891.3
527.9
545.2
506.3
539.8
628.6
671.6
14
Y
24.7
26.9
28.7
25.5
13.1
10.5
14.5
13.5
17.3
13.7
14.1
14.8
14.7
12.4
Zr
298.5
299.8
333.2
293.5
138.1
180.3
146.8
122.6
108.3
142
147.1
129.9
144.5
87.1
116.6
Nb
16.1
16.3
19
16.6
17.1
21.8
19.7
19.7
12.1
17.2
20.5
16.7
17.8
11.4
14.7
Ba
317
454
501
332
651
832
906
810
785
686
717
634
760
605
521
La
39.3
37.1
43.1
40.3
37.1
28.4
36.5
35.9
24.1
35.6
35.5
30.4
33.2
33.6
38.6
Ce
76.4
68.4
79.6
75.7
57.1
59.2
61.8
59.7
43.4
62.2
62.1
51.3
58.1
55.1
63.3
Pr
8.63
8.2
9.36
8.49
5.72
4.82
6.7
6.25
4.7
5.98
6.33
5.52
5.86
5.92
6.72
Nd
32.2
31.3
33.6
32
19.5
15.5
23.8
21.7
17.5
20.6
22.2
18.8
21.2
22.9
22.9
Sm
6.15
5.86
6.21
5.84
3.09
2.5
3.79
3.38
3.47
3.35
3.6
3.37
3.42
3.8
3.63
Eu
1.19
1.11
1.2
1.04
0.89
0.68
0.98
0.98
0.97
0.96
0.89
0.98
1.07
1.1
1.09
Gd
5.13
5.23
5.69
5.37
2.67
2.21
3.08
2.98
3.38
2.93
3.13
3.09
3.12
3.25
3.47
Tb
0.82
0.83
0.88
0.84
0.4
0.35
0.47
0.44
0.49
0.41
0.42
0.42
0.43
0.51
0.49
Dy
4.44
4.74
5.05
4.71
2.33
1.84
2.61
2.47
2.95
2.15
2.6
2.5
2.63
2.59
2.73
Ho
0.96
0.97
0.95
0.97
0.52
0.38
0.53
0.44
0.62
0.47
0.49
0.51
0.5
0.52
0.55
Er
2.74
2.99
3.11
3.11
1.32
1.22
1.58
1.37
2
1.32
1.56
1.53
1.61
1.33
1.58
Tm
0.43
0.47
0.47
0.53
0.23
0.2
0.22
0.21
0.3
0.22
0.23
0.23
0.24
0.21
0.22
Yb
3.05
3.33
3.08
2.86
1.43
1.49
1.62
1.57
1.95
1.52
1.55
1.61
1.63
1.23
1.64
Lu
0.45
0.51
0.49
0.5
0.22
0.22
0.24
0.22
0.32
0.24
0.26
0.25
0.26
0.2
0.25
Hf
7.7
7.7
8.7
7.1
3.3
4.8
4.1
3.6
2.6
3.8
3.8
3.3
3.5
2.6
2.9
Ta
0.9
1
1.2
0.9
1.1
1.6
1.3
1.2
0.7
1.2
1.3
1
1.1
0.7
0.8
Pb
19.8
9.6
9.9
16.9
4.5
7.2
7.4
7.9
9.2
2.7
2.6
2.8
7
14.4
15.2
Th
18.3
18.5
20.6
18.3
15.7
20
16.5
16.5
11.1
16.4
16.5
12.6
15
8.9
9.3
U
7
6.7
4.1
6.5
4.3
5.2
3.6
4.7
4.3
5.5
5.9
4.1
2.6
2.1
3.1
Ga
15.2
15.2
16.8
13.9
12.5
16.9
14.9
15.2
11.5
16.8
16.9
18.1
18.9
16.3
14.8
Sn
2
2
2
2
<1
<1
<1
<1
<1
<1
<1
1
<1
<1
<1
Cs
1.3
4.1
1.7
1.6
2.9
4.4
3.5
2.9
2.1
6.7
6.6
2.3
3.4
7.4
4.2
13
GÖÇMENGİL et al. / Turkish J Earth Sci
A
100
M
(a)
(b)
Highly
altered
Moderately
altered
Slightly
altered
50
Almus
Yıldızeli
Enclave
Fresh
Alteration
trends
K
CN
8
12
7
(c)
T
Na 2 O+K 2 O (wt. %)
8
K
BTA
4
2
0
BA
B
A
45
50
55
High-K
3
2
Middle-K
series
D
60
65
SiO 2 (wt. %)
70
75
0
80
Low-K
- series
45
50
100
(b)
(f)
oshonithic
60
65
70
75
Silica
undersaturated
K 2O/Na2O
e
Calc-Alkalin
1
Ultrapotassic
Potassic
Shoshonitic
oleiites
Island-Arc th
0.1
70
60
50
40
30
Co (ppm)
80
Silica
oversaturated
10
High-K / Sh
1
55
SiO 2 (wt. %)
(e)
10
Th (ppm)
4
1
100
0.01
Shoshonitic
5
Field of basic
first stage lavas
(Göçmengil
et al., 2016)
TB
(d)
6
IB
TA
K 2 O (wt. %)
10
6
A
F
Calcalkaline
20
10
0
0.1
Tholeiitic
-80 -70 -60 -50 -40 -30 -20 -10 0
10
∆Q = q-(le+ne+kal+ol)normative
20
30
40
Figure 8. a) Chemical index of alteration and A-CN-K diagram of Nesbitt and Young (1982) to check the alteration status of
the volcanic rocks. b) MFW statistical approach of alteration behavior of the altered volcanic rocks (Ohta and Arai, 2007). c)
Classification of the trachytic lavas from both areas based on TAS diagram of Le Maitre et al. (1989) together with the field
of first-stage basic lavas from Göçmengil et al. (2016) (TB: trachybasalt; BTA: basaltic trachyandesite; TA: trachyandesite; T:
trachyte; B: basalt; BA: basaltic andesite; A: andesite; D: dacite; IB: Irvine and Baragar (1971) dividing line; K: Kuno (1966)
dividing line). d) Classification of trachytic lavas on K2O vs. SiO2 diagram of Peccerillo and Taylor (1976). e) Classification
scheme based on Co-Th values (Hastie et al., 2007). f) ΔQ vs. K2O/Na2O diagram of Peccerillo (2005) (q: normative quartz;
lc: normative leucite; ne: normative nepheline; kal: normative kalsilite; ol: normative olivine). The same legend will be used
in all following figures.
14
GÖÇMENGİL et al. / Turkish J Earth Sci
1.2
8
(a)
(b)
1
6
Fe 2 O 3 (wt. % )
TiO 2 (wt. %)
0.8
0.6
0.4
2
0.2
0
50
55
60
0
65
4
50
0.4
(c )
0.35
P 2O5 (wt. % )
MgO %
4
55
60
65
55
60
65
(d)
0.3
0.25
2
0.2
0.15
0.1
0.05
0
22
50
55
60
0
65
7
(e )
(f )
6.5
20
6
Na2 O (wt. % )
Al2 O 3 (wt. % )
50
18
16
14
5.5
5
4.5
4
3.5
3
2.5
12
50
55
60
65
2
50
55
60
65
SiO 2 ( wt. %)
14 (g)
CaO (wt. % )
12
10
8
6
4
2
0
50
55
60
65
SiO 2 ( wt. %)
Figure 9. a–g) Major oxide Harker variation diagrams from Almus and Yıldızeli trachytic lavas and enclaves
(legend is the same as in Figure 8).
15
GÖÇMENGİL et al. / Turkish J Earth Sci
25
20
(b )
(a)
20
Sc (ppm)
Co (ppm)
15
10
5
0
15
10
5
50
55
60
0
65
50
55
60
65
55
60
65
55
60
65
55
60
SiO 2 (wt. %)
65
400
(d)
(c.)
300
Zr (ppm)
Th (ppm)
20
10
200
100
0
50
55
60
0
65
50
1000
(e)
Rb (ppm)
800
Ba (ppm)
(f)
200
600
100
400
200
50
55
60
0
65
50
30
1000
(g)
(h)
25
600
Y (ppm)
Sr (ppm)
800
400
20
15
10
200
50
55
60
SiO 2 (wt. %)
65
5
50
Figure 10. a–h) Trace element Harker variation diagrams from Almus and Yıldızeli trachytic lavas and enclaves
(legend is the same as in Figure 8).
16
GÖÇMENGİL et al. / Turkish J Earth Sci
1000
1000
(a)
(b)
100
Rock / Chondrite
Rock / N - MORB
100
10
10
1
0.1
1
Sr K Rb Ba Th Ta Nb La Ce P Nd Hf Zr Sm Tb Ti Y Yb
La Ce Pr Nd Pm Sm Eu Gd Tb Dy Ho Er Tm Yb Lu
Figure 11. a) N-MORB normalized (normalization values from Sun and McDonough, 1989) multielement variation diagrams of
Almus and Yıldızeli trachytic lava flows and enclaves. b) Chondrite normalized (normalization values from Boynton, 1984) REE
variation diagrams from Almus and Yıldızeli trachytic lava flows and enclaves.
values of the Almus trachytic lavas (except Nb and Ta) are
significantly higher relative to the Yıldızeli trachytic lavas.
HFSEs Nb-Ta and Hf-Zr display lower contents compared
to the LILEs and light REEs (LREEs) for all samples.
Chondrite-normalized (Boynton, 1984) patterns of
REEs from both regions show LREE enrichment relative
to middle and heavy REE (MREE and HREE) values of
the Almus samples, significantly enriched relative to
the Yıldızeli region samples (Figure 11b). There is also a
noticeable negative Eu anomaly marked in the Almus
trachytes, which is not significant in the Yıldızeli trachytic
lavas and monzodioritic/monzonitic enclaves.
5.3. Isotope geochemistry
Sr–Nd isotopic contents of the three different samples
from trachytic lavas are presented in Table 3. The trachytic
samples generally straddle the bulk silicate earth values.
143
Nd/144Nd isotopic compositions vary from 0.512631 to
0.512803. 87Sr/86Sr isotopic compositions are dispersed
between 0.705542 and 0.707134. One trachytic sample
from Almus gives a positive ɛNd (+2.6). However, the
Yıldızeli samples are situated in the enriched quadrant
and their ɛNd values are close to zero (about –0.6). SrNd isotopic data of the trachytic lavas from Almus and
Yıldızeli generally overlap the existing Sr-Nd from the
Eocene magmatic units from the Eastern Pontides area
together with the Eocene suites from the Western Pontides
region (Figure 12).
6. Discussion
6.1. Constraints on source of the high-K postcollisional
magmatism
Mantle source areas of the postcollisional magmatic
units along the Eastern Mediterranean do not have a
unique composition since the geochemical budgets of the
colliding plates and the postcollisional tectonomagmatic
modifications along the source areas are highly variable
(Lustrino and Wilson, 2007; Kirchenbaur et al., 2012;
Prelević et al., 2013). In our case, the scarcity of direct
Table 3. Sr-Nd isotope analysis of trachytic rocks from Almus and Yıldızeli regions.
Sample
SiO2
Rb
Sr
Nd
Sm
Sr/86Sr
87
Nd/144Nd
143
Sr/86Sr(i)
87
143
Nd/144Nd (i)
Almus 201
60.2
188.5
132.9
5.86
31.3
0.707134
0.512803
0.70474
0.512773
Yıldızeli 351
60.5
243.7
707.6
15.5
2.50
0.706423
0.70586
0.70586
0.0979
Yıldızeli 354
61.6
170.2
679.2
23.8
3.79
0.705542
0.70513
0.70513
0.0967
17
GÖÇMENGİL et al. / Turkish J Earth Sci
0.5134
0.5132
M
an
NW Anatolia
middle Eocene volcanics
DM
MORB
tle
Eastern Pontides
middle Eocene volcanics
Ar
ray
(143Nd/ 144Nd) (i)
0.5130
HIMU
0.5128
Depleted Quad.
0.5126
BSE
Enriched
Quad.
0.5124
0.5122
0.702
EMI
0.703
0.705
0.704
87
0.706
0.707
0.708
86
( Sr / Sr) (i)
Figure 12. (87Sr/86Sr)i vs. (143Nd/ 144Nd)i plot of the trachytic lavas from Almus and Yıldızeli regions. For comparison, Sr-Nd isotopic
data from NW Anatolia (Gülmez et al., 2013; Kasapoğlu et al., 2016) and middle Eocene volcanics from the Eastern Pontides
(Kaygusuz et al., 2011; Temizel et al., 2012, 2016; Arslan et al., 2013; Aslan et al., 2014; Yücel et al., 2017) are also plotted. Data for
lithospheric mantle array and MORB from Wilson (1989) and Gill (1981). DM, HIMU, EMI, and BSE values together with CHUR
(Chondritic Uniform Reservoir) lines are taken from Zindler and Hart (1986).
information about the source areas (e.g., xenoliths from the
subcontinental lithospheric mantle) of the Early Cenozoic
magmatism only allows us to determine constraints by
using its magmatic manifestations.
The generation of high-K postcollisional magmatism
along the Eastern Mediterranean is generally linked to
metasomatized mantle source areas (Ersoy et al., 2010;
Kirchenbaur et al., 2012; Prelević et al., 2013; Wang
et al., 2016). The metasomatized source regions of the
high-K magmatism are mainly attributed to the presence
of ‘metasoms’, which comprise hydrous mineral-rich
(generally phlogopite- and/or amphibole-rich) cumulates
such as veinlets developed within the depleted peridotitic
mantle rocks, which are also shown by experimental
petrological studies (Foley, 1992; Mitchell, 1995). The
generation of the ‘metasoms’ is mainly controlled by the
reactions of different melts and/or fluids with the host
peridotite. ‘Metasom’-rich mantle sources generally
contain different types of veins and veinlets (Pilet et al.,
2011) and these veinlets can generate LILE-rich magmatic
products with low-degree partial melting (e.g., Pilet et
al., 2008). These ‘metasoms’ can host different mineral
assemblages such as phlogopite clinopyroxene, apatite,
spinel, sphene, and amphibole (Foley, 1992; Conceição
18
and Green, 2004). On the other hand, high-K magmas can
also be produced without any influence of a phlogopite in
the source region, as shown in recent experimental studies
(Wang et al., 2017).
There are different geotectonic scenarios for the
generation of the metasomatic source regions that give rise
to high-K magmatism, such as (i) reaction of accreted and
recycled terrigenous sediments (Gao et al., 2007; Prelević
et al., 2008, 2013; Wang et al., 2017) together with highpressure metamorphic rocks (blueschist) (Tommasini et
al., 2011) with peridotitic lithologies in fossil mantle wedge
settings and (ii) direct melting of continental crust during
the continental collision and subduction (Zhao et al., 2009;
Ersoy et al., 2010). Postcollisional magmatic units along
the Eastern Mediterranean generally mimic the arc-like
geochemical signatures that are heavily influenced by the
melts/fluids transported from the subducted slab (altered
oceanic crust) together with subducted sediments (Ersoy
et al., 2010; Kirchenbaur et al., 2012; Prelević et al., 2013).
Thus, we suggest that the trace element ratios/plots used for
understanding of the evolution of the arc magmatism can
also be reliable tools to investigate the presence and behavior
of sedimentary melts/fluids, subduction components in
mantle source areas of postcollisional magmatics.
GÖÇMENGİL et al. / Turkish J Earth Sci
6.2. Characteristics of the source area
Paleotectonic configurations of the southern part of
the Pontides imply that the zone corresponding to the
IAESZ was an old forearc mantle wedge at least since the
beginning of the Mesozoic, which is documented by the
overlapping subduction and accretion events (Göçmengil
et al., 2013; Topuz et al., 2013; Delibaş et al., 2016; Gülmez
et al., 2016). For that reason, the character of the mantle
source area of the postcollisional magmatic units along the
IAESZ was possibly dictated by highly metasomatized and
subduction-related signatures even without any influence
of an actively subducting slab, which has also been
suggested by recent studies (Yücel et al., 2017).
Middle Eocene trachytic lavas and enclaves in both
the Almus and Yıldızeli regions display a low MgO % and
a low Mg# number (avg. 36; min. 20; max. 61) together
with low Ni and Cr contents (Table 2), which can be
attributed to the possibility that they are differentiated or
evolved volcanic products rather than primary mantlederived melts. Therefore, development of the high-K
potassic magmatism in our case should be derived from
at least two different development stages from their
source region to the extrusive stages. The first stage must
create the metasomatized mantle source area, which can
contain hydrous mineral phases (e.g., phlogopite), and
the second stage should include partial melting, fractional
crystallization (FC), and/or assimilation of the newly
formed metasomatized source itself, which gives rise to
differentiated lavas in our dataset. In order to understand
the first-stage events, Ba, Th, Zr, and Nb elements and
isotopic data can be used to assess the first-order magmatic
processes that modify the source region by subducted slabrelated and/or sedimentary melt/fluid components.
All trachytic units from the Almus and Yıldızeli areas
show strong enrichment of LILEs and LREEs in MORBnormalized element diagrams compared to HFSEs, which
corresponds to a subduction-related origin (Hawkesworth
et al., 1997). On the other hand, the HFSE elements Nb-Ta
display clear negative patterns, which may correspond to
a clear subduction component in the source area (Pearce,
1983), although similar patterns can be developed by
assimilation of the continental crust.
The REE and multielement diagrams indicated
that trachytic lavas and enclaves from the Almus and
Yıldızeli areas resemble those from subduction-modified
enriched sources rather than normal asthenospheric
mantle. The subduction modification can be explained
by a lithospheric mantle source area previously fluxed/
enriched by subduction-related and/or intraplate-related
modifications. In order to better constrain the source
characteristics, we used the Ta/Yb vs. Th/Yb bivariate
diagram, which can be used to check the behavior of the
subduction-related magmatic units, together with different
oceanic basaltic lithologies (Figure 13a). We plotted
all of our data and did not exclude samples even if they
showed very low MgO values. All the trachytic lavas and
enclaves plotted above the mantle metasomatism array
and displayed clear subduction enrichment in their source
regions (Figure 13a). However, the values of our rocks
are similar to the upper continental crust values of Taylor
and McLennan (1985) and they are probably affected
by fractional crystallization and assimilation-fractional
crystallization (AFC) of more basic magmatic units.
In order to check the possible subducted slabderived melts together with the sedimentary-related melt
contributions in the source area we use several bivariate
diagrams to investigate the agents that possibly modify the
source area. We plotted the global subducted sedimentary
units (GLOSS) values in the Ta/Yb vs. Th/Yb diagram
since there are no clear data on the subducted sedimentary
geochemistry along the IAESZ for pre-Cenozoic time
(Figure 13a). Only small portions of our data match with
the GLOSS values, but this diagram does not totally rule
out the possibility of sedimentary-related melt material in
the source region.
In the arc-related series, LILEs such as Ba are
preferentially derived from the hydrous melts/fluids of
the subducted slab (altered oceanic crust); on the other
hand, Th is generally sustained from the subducted
sedimentary units (Hawkesworth et al., 1997). In our case,
most of the rocks are influenced by sedimentary-related
melts rather than a subducted slab-like component with
high Th values and low Ba/Th ratios (Figure 13b). Almus
samples have higher Th contents compared to the samples
from the Yıldızeli area. The Th/Yb vs. Ba/La diagram also
confirms the greater contribution of sedimentary-related
melts over the subducted slab-like component (Figure
13c). Additionally, Ba/Rb ratios, 1.7–14.1 in our samples,
are significantly higher than the fluid rich metasomatized
mantle source region (≤1; Wang et al., 2004; these are 1.7–
2.4 for Almus samples and 4–14.1 for Yıldızeli samples).
Fluid-mobile elements such as La can also be used to
check the fluid-dominated source enrichment relative to
the rather immobile elements Yb, Zr, and Nb (Kessel et al.,
2005). In the La/Yb vs. Zr/Nb diagram, enrichment of the
source by a subducted slab-like component can be tracked
by the high ratios of La/Yb compared to normal MORB
(Figure 13d). High Zr/Nb values can also be interpreted
as less effective source modification by a subducted slablike component or a more depleted mantle source region
before the overprinting of the subduction components,
as shown by Kirchenbaur et al. (2012). Almus trachytic
lavas display higher ratios of Zr/Nb (17–18) and lower
La/Yb (11–14) compared to the both Yıldızeli trachytic
lavas and enclaves (Zr/Nb: 6–9; La/Yb: 12–27) (Figure
13d). The higher La/Yb values of the source region of the
19
GÖÇMENGİL et al. / Turkish J Earth Sci
(a)
GLOSS
Field
OIB
250
m
ati
s
M
eta
s
om
E-MORB
300
Ar
ra
y
Average
GLOOS
Th/Yb
1
Upper
Crust(UC)
Ba / Th
10
M
an
t
N-MORB
Enrichment with
subduction related
fluids
200
Arc
basalts
150
100
le
0.1
(b)
Sediment
sourced
melts
50
0.01
0.01
0.1
0
10
40
Sediment
sourced
melts
10
15
Th
20
25
30
Zr / Nb
Enrichment with
subduction related
fluids
5
10
20
30
Ba /La
N-MORB
30
10
0
5
(d)
.
15
0
0
( c)
20
Th / Yb
Ta/Yb
1
40
50
PRIMA
20
M
reenr antle
ichm
ent
10
0
0
10
La / Yb
20
30
Figure 13. a) Ta/Yb vs. Th/Yb plot (Pearce, 1983) for the Almus and Yıldızeli trachytic lavas. GLOSS field is from Plank and
Langmuir (1998). Upper crustal values from Taylor and McLennan (1985). b) Th vs. Th/Ba plot to discriminate between the
effects of subducted slab-related fluids and sediment-related melts together with the field of arc basalts (Hawkesworth et al.,
1997). c) Ba/La vs. Th/Yb diagram constructed in a similar manner to discriminate effects of subducted slab-related and
sediment-related melts (Kirchenbaur et al., 2012). d) La/Yb vs. Zr/Nb diagram for differentiating the mantle enrichment
processes (N-MORB and PRIMA fields and diagram after Münker, 2000; Kirchenbaur et al., 2012).
Yıldızeli trachytic lavas may show that the source region
of these lavas has much more prominent subducted slabderived modifications compared to the Almus trachytes.
Nonetheless, sedimentary melts/fluids more dominantly
modify the source area compared to the subducted slablike component and both areas have been generated from
a similar mantle source region.
The data outlined above show that the source areas of
all trachytic lavas have an enriched mantle source, which is
heavily fluxed by sedimentary melts/fluids.
6.3. Composition and partial melting of the
metasomatized source area
The mineral content of the metasomatized source area
can be investigated by the variations of LILE pairs, as
20
suggested by Duggen et al. (2005). Rb/Sr and Ba/Rb ratios
are affectively used to constrain two possible metasomatic
mineral phases such as phlogopite and amphibole in the
source region. The high Rb/Sr values from the Almus
trachytes support the presence of phlogopite as a stabilized
phase in the metasomatized source area (Figure 14a). In
addition, the less apparent influence of the amphibole
mineral also indicates that both hydrous phases can be
present in the metasomatized mantle source areas, as
exemplified in many mantle xenoliths worldwide (Pilet et
al., 2008, 2011 and references therein).
Detection of the melt segregation depths together with
the presence of spinel and/or garnet in the source area
of the trachytic lavas is a challenging task since even the
GÖÇMENGİL et al. / Turkish J Earth Sci
Phlogopite
in the source
1.5
(a)
60
(b)
50
Rb/Sr
La / Yb
1
0.5
Melting without residual garnet
40
30
20
Amphibole
in the source
10
0
0
10
20
30
Ba/Rb
40
0
50
4
ting
Mel
0
0.6
(c)
(d)
5
10
6%
0
F:
Tb /Yb
%
15
50
F:
40
%
20
30
La /Yb
0
Hypothethic source
“300b”
9%
0.1
%
10
18
0.3
%
0
%
21
0.4
15
1
9% garnet in the source
0.2
Melting in
spinel field
80
Possible
mixing lines
12
2
60
%
3
0.5
40
La
wi
24
Dy / Yb
.
ing in
Melt field
t
n
gar e
20
t
arne
ual g
sid
th re
3% garnet in the source
15
La/Yb
20
25
30
Figure 14. a) Ba/Sr vs. Rb/Sr diagram for discriminating phlogopite and amphibole in the source area (Duggen et al., 2005).
(b) La vs. La/Yb diagram for checking the presence of residual garnet during the partial melting (Vigouroux et al., 2008). c)
La/Yb and Dy/Yb diagram that discriminates garnet- and spinel-bearing mantle sources (Prelević et al., 2013). The basaltic
trachyandesitic enclaves situated between two areas can be indicative of mixed source bearing spinel and garnet together.
d) Partial melting modeling of source area utilizing La/Yb vs. Tb/Yb ratios. The hypothetic source 300b is taken from Ulten
region metasomatized peridotites (Scamberullli et al., 2006). Only basaltic trachyandesite enclaves are plotted to check the
first-order generation of the trachytic volcanism. Kd values and other parameters are given in Table 4. F: Degree of melting.
primary basaltic-andesitic enclaves display very low MgO
% contents. The possible presence of residual garnet in
the source region can be checked by the behavior of the
HREE patterns relative to the LREEs (Johnson, 1994).
In our dataset, relative depletion of the HREEs contrary
to the LREE values can be supportive of the presence
of residual garnet in the source area. The La vs. La/Yb
ratios also confirm that residual garnet can be stored in
the mantle source area of both regions (Figure 14b; from
Vigouroux et al., 2008). However, the Dy/Yb vs. La/Yb
ratios indicate that the trachytic lavas and enclaves are
generally dispersed along the spinel bearing mantle areas,
which can be supportive of a shallower mixed garnet- and
spinel-bearing source region (Figure 14c).
Thus, additional constraints can be drawn by the
chondrite normalized Dy/Yb (n) ratios. The experimental
study of Blundy et al. (1998) suggests that the melts
derived from garnet-bearing mantle sources have Dy/Yb
(n) ratios greater than 1.06. In our case, Dy/Yb (n) ratios
from the Almus region are 0.92–1.07 and the same ratios
from Yıldızeli trachytic lavas are dispersed between 0.80
and 1.06. Only the basaltic-trachyandesitic enclaves from
the Yıldızeli region give higher Dy/Yb (n) ratios values of
1.08–1.37. These values indicate that both regions have a
mantle source that is situated largely in a spinel stability
field with a small influence of the garnet in the source area
together with possible metasomatic cumulate minerals of
amphibole and phlogopite.
Since we argued the possibility of a metasomatized
source region for the Middle Eocene trachytic lavas, we
select a hypothetical metasomatized phlogopite- and
amphibole-bearing garnet peridotite source from the
21
GÖÇMENGİL et al. / Turkish J Earth Sci
Ulten Zone, Italian range (sample #300b of Scambelluri et
al., 2006) to model the possible partial melting processes
since there are no documented mantle xenoliths in Eocene
magmatism along the IAESZ range.
Also, we only try to constrain the geochemical budget of
the basaltic trachyandesitic enclaves, since the majority of
our samples are not primary mantle melts and they probably
represent the fractionated derivatives of these more basic/
primitive enclaves. We used a partial melting model based
on the equations described by Shaw (1970) for nonmodal
batch melting. We used different REE pairs to understand
the partial melting processes since they can be easily
obscured by the degree of partial melting. We check different
partial melting processes for the different compatible and
incompatible trace element but we only present La/Yb
vs. Tb/Yb diagrams to explain the processes for a simple
bivariate diagram-based model. We also attempted several
different spinel and garnet lherzolite compositions, but none
of them give satisfactory results (not shown).
The mineralogy of the starting samples from the Ulten
Zone (sample #300b, Scambelluri et al., 2006) contains
amphibole + orthopyroxene + garnet + olivine + spinel and
phlogopite minerals. The parameters used in partial melting
modeling are given in Table 4.
The results of our petrological modeling indicate that
melting of mixed products of 3% and 9% garnet-bearing
metasomatized source area can give rise to the development
of first-order enclaves in our trachytic lavas (Figure 14d).
Therefore, partial melting modeling is also supportive of a
possible metasomatized source area for the development of
the first-order products of the trachytic volcanism. However,
since the source rock and the melting parameters are
highly ambiguous (devoid of physical and thermodynamic
parameters), we will not draw any additional constraints for
the source characteristics.
6.4. Evaluation of bulk geochemical data, fractional
crystallization, and assimilation processes
Trachytic lavas in our dataset have high silica and low
magnesium contents and probably correspond to the
evolved derivatives of a more basic system. A first-order
approximation of fractional crystallization, assimilation,
and magma mixing processes can be detected by the
trends and inflexions of different major and minor oxides
relative to a common differentiation tracker (silica and/
or magnesium). The relative decreases of TiO2, Fe2O3,
MgO, Co, and Sc relative to the increasing silica content
probably reflect the fractionation of ferromagnesian
minerals such as olivine and pyroxene and possible oxide
phases such as magnetite. Thus, the small kink in CaO
values after the 57% silica level may be controlled by
modal differences of clinopyroxene and plagioclase in the
porphyritic trachytic lavas of the Yıldızeli region. Slightly
positive to flat behavior of the Na2O is probably related
to the K-feldspar fractionation. In addition, decreasing
P2O5 values with increasing silica are closely related to the
apatite fractionation.
Positive behavior of the Th and Zr with increasing silica
content may be linked to fractionation of the minor accessory
phases such allanite and/or zircon. However, these phases
are not detected in the petrographic investigations. Scattered
Ba, Sr, and Rb values with increasing silica can be explained
by plagioclase, K-feldspar, and phlogopite fractionation. The
negative Ba contents in N-MORB normalized multielement
patterns are also supportive of plagioclase fractionation.
On the other hand, distinct negative Eu anomalies in REE
patterns for the Almus samples are suggestive of plagioclase
fractionation. Y values display flat to negative trends with
increasing silica content for the Yıldızeli trachytic lavas,
possibly related to amphibole fractionation. However, the
Almus trachytes have more elevated Y values, possibly due
to the scarcity of amphiboles.
Despite the different trace element behavior, the Almus
and Yıldızeli trachytic suites show similar petrologic
evolution with increasing silica content. Small differences
in major oxides and trace elements are supportive of
a fractional crystallization-related evolution; however,
some degree of assimilation/magma mixing can also be
responsible for the obtained geochemical scheme.
Table 4. Nonmodal batch melting equation parameters used in the melting models. Distribution coefficients are taken from McKenzie
and O’Nions (1991). Source mode minerals are compiled from metasomatized peridotitic rocks from the Ulten range (Scambelluri et
al., 2006).
Mode
Olivine
Orthopyroxene
Spinel
Garnet
Amphibole
Phlogopite
Total
Source mode (1)
0.54
0.21
0.06
0.03
0.12
0.04
1
Source mode (2)
0.54
0.21
0.06
0.09
0.06
0.04
1
Melt mode
0.05
0.10
0.15
0.15
0.20
0.35
La
0,04
0.002
0.01
0.01
0.17
0.007
Yb
0.0015
0.049
0.01
4.03
0.59
0.005
Tb
0.0015
0.019
0.01
0.75
0.83
0.0001
22
GÖÇMENGİL et al. / Turkish J Earth Sci
6.5. Petrological modeling of differentiation processes
To determine the petrogenetic evolution of the trachytic
lavas from the Almus and Yıldızeli areas we attempted
to model the fractional crystallization and assimilation
related processes. First, we try to assess the extent
of fractional crystallization by using compatible and
incompatible element pairs. Then we use Sr-Nd isotopic
data to understand the possible assimilation processes
by the energy-constrained assimilation and fractional
crystallization (EC-AFC) approach of Spera and Bohrson
(2001).
We select compatible and incompatible elements (Th
and Sc) to model the extent of fractional crystallization by
a common basic member (basaltic trachyandesitic enclaves
from Yıldızeli) (Figure 15a). Then we calculate possible
Rayleigh fractional crystallization trends from different
modal mineralogies (shown in Figure 15a) with different
partition coefficients. According to our modeled curves,
all trachytic lavas from both areas plot between curves C3
(10% Amp; 10% Cpx; 70% Plag; 10% San) and C5 (15%
Cpx; 55% Plj; 30% San), excepting only two samples.
One of these is plotted along the more acidic C1 curve
and the other on the more basic C6 curve. The different
behaviors of these curves can be related to the different
assimilation/magma mixing degrees and might be related
to the alteration processes.
Figure 15. a) Th vs. Sc variation diagram displaying theoretical Rayleigh fractionation curves from a basaltic trachyandesitic magma
source. Kd values of Th and Sc for amphibole (Amp), plagioclase (Pl) orthopyroxene (Opx), biotite (Bt), and sanidine (San) are taken
from the Geochemical Earth Reference Model page (). Tick marks on each vector correspond to 10% crystallization
intervals. b) Sr-Nd isotopic data and EA-AFC curve constructed by the algorithm of Spera and Bohrson (2001). The starting composition
is taken from an older basic series sample (Göçmengil et al., 2016). The thermal and compositional parameters used in the equation are
given in Table 5.
23
GÖÇMENGİL et al. / Turkish J Earth Sci
Our numerical modeling demonstrates that the FC of
the basaltic trachyandesitic primary magma (magma mush)
is the main dominant mechanism for the development
of our trachytic lavas (see Figure 15a). However, a small
degree of assimilation-related modifications are also
investigated since the trachytic lavas contain a significant
amount of xenocrysts.
EC-AFC modeling is a more convenient tool
compared to the other approaches because it also includes
thermodynamic and physicochemical parameters, which
are largely ignored by the bivariate plot-based approaches.
We used Sr-Nd isotopic data from our three trachytic lavas
together with basaltic trachyandesitic lava as a starting
composition from the first-episode lava series in our own
dataset (Figure 15b; Göçmengil et al., 2017). We made
several attempts with different possible assimilants such as
metamorphic units from the IAESZ and the Tokat Massif
to better evaluate the assimilation processes with different
temperatures (300, 400, 600 °C). However, the only reliable
evolution scheme was obtained from the Cretaceous
granitoid suite of Köksal et al. (2013). Therefore, we use
an Upper Cretaceous granitoid from the CACC (Köksal
et al., 2013) for the assimilation agent. Physicochemical
parameters and compositions are presented in Table 5.
The Ma* values in the algorithm of Spera and Bohrson
(2001), which correspond to the mass of anatectic melt
assimilated during the assimilation processes, show that
the 1% crustal assimilation of the crustal rocks can give rise
to the development of the Almus trachytes, which occur in
negligible amounts (Figure 15b). On the other hand, the
isotopic variation of the Yıldızeli region can be generated
by the 5%–6% assimilation of a crustal assimilation, which
is also supported by different xenocrystic assemblages
detected in the petrographic thin sections (Figure 15b).
EC-AFC modeling also supports that FC is a more
dominant process relative to assimilation. The generation
of both trachytic suites from the Almus and Yıldızeli
areas is mainly controlled by fractional crystallization of
similar parental basaltic trachyandesitic (monzodioritic)
magma mush and minor assimilation during evolution.
The assimilation degree is much higher in the Yıldızeli
trachytic lavas compared to the Almus trachytes, which is
revealed by elevated assimilation Ma* values.
7. Geodynamic implications
Eocene magmatism along the IAESZ developed along both
sides and along the suture zone itself. The Early Eocene
phase is marked by adakitic-dominated magmatism,
which was more localized along the Eastern Pontides
region (Topuz et al., 2005; Eyüboğlu et al., 2011; Karslı
et al., 2011). The Middle Eocene volcanic units are much
more widespread compared to the Early Eocene magmatic
units and they can be traced through the Balkan range
(Marchev et al., 2004), to northern Anatolia (Keskin et al.,
2008 and references therein) and the Caucasus (Sahakyan
et al., 2016). However, there has been no consensus reached
so far regarding the main tectonomagmatic driving engine
of the magmatism through the Early Cenozoic time along
the IAESZ range.
Different hypotheses have been suggested for the
generation of the Early Cenozoic magmatism along our
study areas and surrounding regions (Central and Eastern
Pontides) such as slab break-off (Keskin et al., 2008),
delamination (Arslan et al., 2013; Temizel et al., 2016)
Table 5. Thermal parameters and compositional values used for the EA-AFC modeling. Initial Sr-Nd isotopic values are taken from
Göçmengil et al. (2017). Assimilant values are taken from Köksal et al. (2013), which are analogous to upper crustal rock units in the
CACC.
Compositional
parameters
Thermal parameters
Magma liquidus temperature, Tl, m
1200 °C
Magma initial concentration (ppm), Cm o
431
24.6
Magma initial temperature, Tm o
1200 °C
Magma isotope ratio, £m
0.7044
0.512867
Assimilant liquidus temperature, Tl, a
1000 °C
Magma distribution coefficient, Dm
1.219
0.11
Assimilant initial temperature, Ta
600 °C
Assimilant initial concentration (ppm), Cm
706.3
37.1
Solidus temperature, Ts
950 °C
Assimilant isotope ratio, £a
0.708757 0.512204
Equilibration temperature, Teq
989 °C
Assimilant distribution coefficient, Da
1.5
Crystallization enthalpy, Dhcry (J/kg)
396,000
Isobaric specific heat of magma, Cp, m (J/Kg per K)
1484
Fusion enthalpy, Dhfus (J/Kg)
354,000
Isobaric specific heat of assimilant, Cp, a (J/kg per K)
1388
24
o
o
0.25
GÖÇMENGİL et al. / Turkish J Earth Sci
thickening and melting of continental crust (Topuz et al.,
2005), and direct generation by a subducting lithospheric
slab (Eyuboglu et al., 2016).
The data presented above give a clear explanation
of the possible generation processes of the trachytic
volcanism along the IAESZ; hence, it is not feasible to
construct the whole-scale geodynamic evolution of the
Early Cenozoic evolution of the region. On the other
hand, with the current data from the literature, we can
place some limitations on the geodynamic processes that
dominated during the Early Cenozoic period along the
eastern part of the IAESZ.
The absence of high-pressure metamorphism during
the Eocene along the southern part of the Pontides and
the surrounding crustal blocks means that the possibility
of subduction-related magmatism is not feasible for the
studied units. In addition, a lithospheric-scale geodynamic
tectonomagmatic event (e.g., delamination and/or
lithospheric removal) seems much more plausible rather
than a localized (slab-break off/tear) tectonomagmatic
event since similar units are dispersed along the different
parts of the Central and Eastern Pontides (Keskin et al.,
2008; Arslan et al., 2013; Yücel et al., 2017).
First-stage basic volcanism together with the late-stage
trachytic suites in our case display generally well-defined
trends in geological maps. First-episode basic volcanic
units display E-W (Yıldızeli) and NW to SE (Almus)
directions along their lengths. Additionally, trachytic
dykes, plugs, and stocks from the Almus and Yıldızeli
regions show NW-SE, NE-SW, and E-W orientations. The
generation of these orientations was probably controlled
by the extensional tectonics active along the whole scale of
the Central and Eastern Pontides throughout the Middle
Eocene time interval (Yilmaz et al., 1997a; Keskin et al.,
2008; Arslan et al. 2013). The generation of this extensional
phase is interpreted as extensional collapse of the thickened
continental crust along the IAESZ (Topuz et al., 2011);
hence, similar extensional tectonics can also be triggered
by delamination and lithospheric removal processes,
which are exemplified in many regions worldwide (Sierra
Nevada: Elkins-Tanton and Grove, 2003; Central Andes:
Ducea et al., 2013).
After the beginning of this extensional phase, the first
indications of the crustal-scale thinning are marked by
shallow marine sedimentary successions that developed
along both the Almus and Yıldızeli areas. During the later
stages of these extensions, metasomatized lithospheric
mantle became thinned and started to partially melt,
giving rise to voluminous Middle Eocene magmatism
along both sides of the suture zone (Figures 16a and
16b; Yilmaz et al., 1997a; Keskin et al., 2008). The first
episode of Middle Eocene magmatism is represented by
the basic to intermediate volcanic products along the both
the Almus and Yıldızeli regions (Figure 16a; Göçmengil
et al., 2017). During the generation of the first episode,
basaltic-trachyandesitic magma mush also developed
along a regional scale, which acted later as parental magma
chambers for the trachytic volcanism for both areas.
The late-stage trachytic volcanism along both the
Almus and Yıldızeli regions was generated at the final
stages of the extensional phase along the IAESZ. Freshly
developed basic to intermediate crystal mush at the Eocene
(~44 Ma: Göçmengil et al., 2017) of both areas was possibly
reactivated by extensional cracks during the last phase
and developed along localized extensional faults (~41–40
Ma) (Figures 16c and 16d), which is also supported by
geological mapping. The extensional tectonics probably
helped decompression in the upper crustal magma
chambers. Decompression and sudden disruption in the
upper crustal levels possibly reactivated the semimolten
magma mush and gave rise to the development of fractional
crystallization processes together with minor assimilation
in both regions (Figures 16c and 16d).
8. Conclusions
The Almus and Yıldızeli areas contain Middle Eocene
basic to intermediate volcanism together with late-stage
trachytic stocks, dikes, and plugs. Generation of the
basic and trachytic volcanism was probably governed by
extensional tectonics mainly controlled by delamination
and/or lithospheric removal-related processes. The mantle
source of the volcanism has a garnet- and spinel-bearing
mixed metasomatized region that also contains hydrous
minerals of amphibole and phlogopite. Partial melting of
the metasomatized source region gave rise to the first-stage
basic-intermediate (basaltic trachyandesitic) crystal mush
sampled by the enclaves in the Yıldızeli region. Generation
of trachytic lavas was probably related to the reactivation
of the first-stage basic-intermediate crystal mush by
extensional faulting and magma chamber decompression.
The geochemical evolution of the trachytic lavas from
the Almus and Yıldızeli regions was largely controlled by
the fractional crystallization processes. However, small
degrees of assimilation of the upper crustal granitoid of
CACC-like material may have given rise to development
of the geochemical patterns of both suites. Assimilation
in the Almus trachytes occurred in negligible amounts,
whereas assimilation in the Yıldızeli trachytic lavas is
more apparent (5%–6% assimilation of granitoid), which
is also supported by the xenocrystic assemblages in the
petrographic studies.
Nearly coeval generation of both trachytic suites is
supported by the fact that their petrological evolution was
controlled by similar tectonomagmatic processes, which
were active along the entire Pontides area during the
Middle Eocene.
25
![Structures and electronic properties of si nanowires grown along the [1 1 0] direction role of surface reconstruction](https://media.store123doc.com/images/document/14/rc/td/medium_tdu1394959072.jpg)