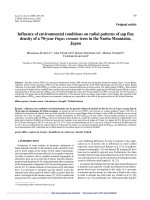
Sensitivity analysis on relations between earthquake source rupture parameters and far field tsunami waves: Case studies in the Eastern Mediterranean region
Bạn đang xem bản rút gọn của tài liệu. Xem và tải ngay bản đầy đủ của tài liệu tại đây (11.12 MB, 37 trang )
Turkish Journal of Earth Sciences (Turkish J. Earth Sci.), Vol. 19, 2010, pp. 313–349. Copyright ©TÜBİTAK
doi:10.3906/yer-0902-8
First published online 24 August 2009
Sensitivity Analysis on Relations Between Earthquake
Source Rupture Parameters and Far-Field Tsunami Waves:
Case Studies in the Eastern Mediterranean Region
SEDA YOLSAL & TUNCAY TAYMAZ
Department of Geophysical Engineering, Seismology Section, the Faculty of Mines,
İstanbul Technical University, Maslak, TR−34469 İstanbul, Turkey
(E-mail: )
Received 22 January 2009; revised typescript receipt 23 August 2009; accepted 24 August 2009
Abstract: We present several sensitivity tests, that were applied to exhibit the effects of earthquake source rupture
characteristics on amplitudes, frequency contents and arrival times of earthquake generated tsunami waves in the far
field, as case studies in the eastern Mediterranean. The investigated earthquake parameters are principally epicentral
location, focal mechanism parameters (strike, dip and rake angles), faulting area dimensions, maximum displacement
and focal (centroid) depth. We have implemented a numerical method of TUNAMI-N2 based on non-linear shallowwater theory to obtain synthetic water surface fluctuations at selected pseudo tide gauge locations in the eastern
Mediterranean. It has been observed that the most important source parameters that effect tsunami wave characteristics
in the far field are: [1] magnitude and seismic moment (Mo= μ × A × D) of earthquake that is a measure of the energy
release radiated at the centroid depth. We have observed that wave amplitudes and shapes change considerably with
variation of magnitude and seismic moment since tsunami waves develop in direct proportional relation to them; [2]
another parameter is the accurate estimation of tsunamigenic earthquake epicentre. Variation of the earthquake
location does not significantly affect the initial tsunami wave heights, but final tsunami wave characteristics and their
arrival times have been slightly changed due to the variation of distance between the epicentre and coastal plains along
the path. Especially, wave spreading causes tsunami waves to decrease in amplitude as they move away from earthquake
source; [3] variation in focal mechanism solutions modify the tsunami wave propagation directions, wave amplitudes,
shapes and arrival times of tsunami waves observed at the coastal plains; [4] in addition, due to the linearity between
the amount of vertical co-seismic displacement and initial tsunami wave, very different tsunami amplitudes were
obtained at each pseudo tide gauge stations in case of the variation in maximum displacement; [5] details of local
bathymetry (e.g., extended sedimentary shelf area) and the sea bottom irregularities (e.g., sea-mounts, volcanoes,
accretionary prisms, trenches, pressure ridges) clearly have crucial effects on tsunami wave characteristics in the far
field. Historical records confirm that the eastern Mediterranean region is at risk from tsunamigenic sources located on
the Hellenic-Cyprus arcs. Thus, higher resolution near-shore bathymetry data as well as a detailed study of potential
tsunami sources in segments of subduction zones are necessary to verify our simulation results.
Key Words: bathymetry, Dalaman-Fethiye-Rhodes trough, earthquake source parameters, eastern Mediterranean,
sensitivity, tsunami, Turkey
Deprem Kaynak Parametreleri, Kırılma (Yırtılma) Özellikleri ve
Uzak Alan Tsunami Dalgaları Arasındaki İlişkiler için Duyarlılık Analizleri:
Doğu Akdeniz Bölgesinden Örnek Çalışmalar
Özet: Bu çalışmada, deprem kaynak (yırtılma) parametrelerinin uzak alandaki tsunami dalga genlik, frekans içeriği ve
kıyılara olan varış zamanlarına olan etkilerini göstermek için uygulanan duyarlılık analizlerinin sonuçları gösterilmiştir.
İncelenen deprem parametreleri, deprem lokasyonu, kaynak mekanizması (doğrultu, dalım ve kayma açıları), faylanan
alanın boyutları, maksimum yerdeğiştirme miktarı ve odak derinliğidir. Doğu Akdeniz bölgesi kıyılarında seçilen
hayali akış ölçüm (tide-gauge) noktalarında oluşacak yapay su yüzeyi yüksekliklerini elde edebilmek için, doğrusal
olmayan sığ su teorisine dayalı olan TUNAMI-N2 matematiksel simülasyon programı kullanılmıştır. Sonuç olarak,
313
EARTHQUAKE SOURCE RUPTURE PARAMETERS AND FAR-FIELD TSUNAMI WAVES
uzak alanda tsunami dalga özelliklerini etkileyen en önemli kaynak parametrelerinin; [1] kaynakta boşalan enerjinin
miktarını gösteren sismik moment (Mo= μ × A × D) ile depremin büyüklüğü olduğu görülmüştür. Tsunami dalgalarının
genlik ve şekilleri bu parametrelere bağlı olarak belirgin şekilde değişim göstermektedir; [2] bir diğer parametre
deprem merkezüstünün (episantırının) doğru olarak belirlenebilmesidir. Duyarlılık analizi sonuçlarına göre, deprem
merkezüstünün değişmesi her ne kadar başlangıç tsunami dalga yüksekliğini değiştirmese de, sonuç tsunami dalga
özelliklerini ve bu dalgaların kıyılara varış zamanlarını etkilemektedir. Özellikle dalganın deniz içerisinde deprem
kaynağından uzağa doğru ilerlemesi ile dalga genliklerinde azalma meydana gelmektedir; [3] odak mekanizması
çözümünün değişmesi tsunami dalgalarının yayılma doğrultularını, şekil, genlik ve dalgaların kıyılara ulaşma sürelerini
değiştirmektedir; [4] düşey kosismik yerdeğiştirme ve başlangıç tsunami dalgası arasındaki doğrusal ilişkiden dolayı,
seçilen ölçüm noktalarında hesaplanan yapay tsunami dalgalarının özellikleri bu parametrenin değişmesinden
etkilenmektedir; [5] ayrıca, deprem kaynağı ile kıyılar arasında yer alan adalar, deniz dağları, yığışım prizması ve
hendekler gibi süreksizlik yapılarının varlığı, kıyı batimetrisi (örn; deniz içerisine yayılmış sedimanter kıta alanı) ve kıyı
şeklinin de tsunami dalga genliklerini etkiledikleri dalga simülasyonlarında açıkça görülmektedir. Tarihsel kayıtlar
doğu Akdeniz bölgesinde Hellenik-Kıbrıs yayları boyunca tsunami riskini vurgulamaktadır. Bu yüzden dalma-batma
zonlarındaki potansiyel tsunami kaynaklarının yüksek çözünürlüklü kıyı batimetri verisi ile detaylı olarak çalışılması
simülasyon sonuçlarımızı doğrulamak için gereklidir.
Anahtar Sözcükler: batimetri, Dalaman-Fethiye çukurluğu, Doğu Akdeniz, duyarlılık, odak parametreleri, tsunami,
Türkiye
Introduction
It has been widely observed that tsunamis can lead to
significant loss to coastal populations both near the
earthquake source and at distant locations (Ammon
et al. 2005; Bilham 2008; Lay et al. 2005; Liu et al.
2005; Gica et al. 2007). Tsunami waves known as
shallow water waves with long wave-lengths and
periods are generally produced by earthquakes,
underwater slumps or volcanic activities. Their
generation and propagation in oceanic areas are
described by the linearized theory of long-period
gravity waves (Shuto et al. 1990; Pelinovsky et al.
2001; Todorovska & Trifunac 2001; Yalçıner et al.
2003, 2004; Zahibo et al. 2003; Salamon et al. 2007;
Yalçıner & Pelinovsky 2007; Yolsal et al. 2007a, b;
Lorito et al. 2008; Shaw et al. 2008; Yolsal 2008).
Many nations have been severely affected by tectonic
activities world-wide in the past. For example, 1755
Lisbon, 1946 Aleutian, 1960 Chilean, 1998 Papua
New Guinea and 2004 Sumatra-Andaman are the
most illustrative examples of catastrophic earthquake
induced tsunamis of the world (Okal 1999; Heinrich
et al. 2000; Lay et al. 2005; Ni et al. 2005; Stein &
Okal 2005; Taymaz et al. 2005; Bilham 2008; Konca
et al. 2008; Barkan et al. 2009). These earthquakes are
named tsunamigenic earthquakes, and are
characterized by shallow focal depths with fault
dislocations greater than several metres, fault
surfaces smaller than that of normal earthquakes,
long source time functions and slow-smooth
314
ruptures (Kanamori 1972; Fukao 1979; Kikuchi &
Kanamori 1995; Polet & Kanamori 2000; Ammon et
al. 2006). Many destructive tsunamis also originate
from submarine landslides and volcanic eruptions
which generally have more complex natures and
physical descriptions than those of tectonic
earthquakes. In particular, submarine landslides
affecting weak sediments can create destructive
tsunamis with very large wave amplitudes at coastal
plains, and they typically can cause significant
tsunami run-up heights in areas proximal to the
source while the earthquake induced tsunamis are
more widely distributed (Matsuyama et al. 1999).
Volcanic eruptions of 3500 yr BP Santorini and 1883
Krakatoa can be given as manifested examples
depicting high amplitude tsunami waves in historical
times (see Bond & Sparks 1976; Okal 1988; Cita &
Aloisi 2000; Minoura et al. 2000 for details).
Many alternative stochastic numerical methods
such as the Cornell COMCOT model (Liu et al.
1994, 1995; Wang & Liu 2005, 2006), the MOST
model (Titov & Synolakis 1998), and TUNAMI-N2
model (Imamura 1995; Imamura et al. 2006) have
been developed to simulate tsunami wave
propagations and to predict tsunami wave heights
and travel-times at selected pseudo tide gauge
locations. These methods require reliable
bathymetry and source mechanism parameters as
input data for tsunami simulations. Accordingly, the
geometry and evolution of potential source regions
S. YOLSAL & T. TAYMAZ
and source rupture processes along main active fault
zones should be better known and defined in detail.
Moreover, the importance of high resolution
bathymetry, dispersion, non-linearity, bottom
friction, tsunami wave directivity and tsunami
impacts have been highlighted by several studies
(Heinrich et al. 1998; Fujima 2001; Ortiz et al. 2001;
Horillo et al. 2006; Chatenoux & Peduzzi 2007;
Ioualalen et al. 2007; Yolsal et al. 2007a; Bilham 2008;
Shaw et al. 2008; Yolsal 2008). However, one of the
most significant uncertainties in tsunami wave
height prediction comes from the difficulty of
accurate estimation of source parameters (e.g.,
Synolakis et al. 1997; Gica et al. 2007). Thus,
sensitivity analyses of earthquake source parameters
become essential to check the variation of tsunami
wave characteristics in the near and far fields (Okal
1988; Satake & Tanioka 1995; Geist 1999, 2005; Titov
et al. 1999; Piatanesi & Tinti 2002; Pires & Miranda
2003; Yalçıner et al. 2003, 2004; Weisz & Winter
2005; Dao & Tkalich 2007; Gica et al. 2007, 2008;
Ioualalen 2007; Lorito et al. 2008; Okal & Synolakis
2008; Shaw et al. 2008; Yolsal 2008; Yolsal et al.
2008a, b).
In this study, we present the effects of the
variation in earthquake location, focal mechanism
parameters (strike (φ), dip (δ) and rake (λ) angles),
focal depth (h), fault area (A) and amount of the
maximum displacement (Dmax) on tsunami
propagation, synthetic tsunami wave amplitudes and
theoretical arrival times of initial tsunami waves at
the coastal plains in the far field. We choose the
eastern Mediterranean Sea region as a target area
since several studies of historical documents
revealed repeated tsunami impact on the region and
its environs, together with geomorphological,
sedimentological, geochemical, geological and
geophysical analyses (Fokaefs & Papadopoulos 2006;
Scheffers & Scheffers 2007). Due to active tectonic
motions between the Arabian, African and Eurasian
plates, this region has a very complex tectonic regime
manifested by intense seismic activity and
destructive earthquakes (Figures 1 & 2). Especially,
subduction-related
shallow
tsunamigenic
earthquakes (h < ~40 km) concentrate along the
Hellenic arc system and a few historic, subductiontype earthquakes occurred at various segments of the
subduction zone (Taymaz 1990; Taymaz et al. 1990,
1991, 2004, 2007a, b; Yolsal & Taymaz 2004, 2005,
2006; Bohnhoff et al. 2005; Yolsal et al. 2007a, b;
Shaw et al. 2008; Yolsal 2008; Reilinger et al. 2009).
Yolsal et al. (2007a, b) and Yolsal (2008) classified
the historical earthquakes and associated tsunamis
identified from verified catalogues (e.g., Ambraseys
et al. 1994; Guidoboni et al. 1994; Ambraseys &
Melville 1995; Papadopoulos 2001; Guidoboni &
Comastri 2005a, b; Papadopoulos & Fokaefs 2005;
Sbeinati et al. 2005; Papadopoulos et al. 2007), and
synthesized the historical tsunamis and tsunamiwave propagations in the eastern Mediterranean
region, with particular attention to the Hellenic and
Cyprus arcs and the Levantine basin. Historical
catalogues reflect that the most destructive
earthquakes occurred in the eastern Hellenic arc
(e.g., 365, 1303, 1481, 1494) threatening the coastal
plains of Crete, Rhodes, Cyprus, Levantine Sea and
Alexandria-Nile Delta (Egypt) environs in
agreement with the obtained numerical tsunami
simulations.
In this study, we have applied numerical
sensitivity tests in order to check the effects of
earthquake source parameters on tsunami
generation and wave characteristics resembling the
historical 1222 Cyprus (M ~7.0–7.5) and 1303 Crete
(M ~8.0) earthquakes studied by Yolsal et al. (2007a,
b) and Yolsal (2008). Earthquake source parameters
have been constrained by using historical
documents, empirical scaling equations, GPS data,
by analogy of current plate boundaries, reported
field observations and earthquake source
mechanisms obtained by teleseismic P- and SHbody waveform inversions (Yolsal 2008; Table 1).
Here, we present sensitivity test results by illustrating
examples of synthetic mareogram calculations at
each selected coastal locations in the eastern
Mediterranean region to compare tsunami wave
characteristics in the far field. Wave heights
presented at each pseudo tide gauge stations are
calculated by adding maximum positive and negative
wave amplitudes.
Method
Numerical Tsunami Simulations
Simulations and sensitivity tests were performed by
using the numerical code TUNAMI-N2 developed
315
316
Figure 1.
Map of epicentre distribution of the M ≥ 4 earthquakes in the Mediterranean and surrounding regions reported by USGS-NEIC from1973 to 2009.
Bathymetry and topography data are derived from GEBCO/97–BODC (Smith & Sandwell 1997a, b) and USGS-SRTM30, respectively. Rectangular
box indicates the current study area in the Eastern Mediterranean region.
USGS-NEIC
1973-2009
M>4
EARTHQUAKE SOURCE RUPTURE PARAMETERS AND FAR-FIELD TSUNAMI WAVES
ic S
Arc
Pliny
Crete
A
n
ea
eg
Africa
Mediterranean Sea
HB
SuF
ESM
s
pru
Cy
TGF
Sinai
Sub-plate
P
KFZ
EcF
ErF
Anatolia
Cyprus Arc
PTF
BGF
BuF
TF
RB
ASM
BMG
G
bo
ra
St
a
Se
Ge
Si
EPF
NAF
EF
alm
y
ol
e
dB
lt
Arabia
BF
F
EA
OF
SF
F
MF
e
rid
DF
KF
KB
PS
F
Thr
ust
-Z
ag
ro
F
Tu
F
M
T
AF
Bit
lis
NE
asu
sM
ain
Sa
F
Be
Mediterranean Ridge
c
ni
lle
He
Gr
ee
ce
Black Sea
Cau
c
s
ld
Fo
lt
Z
a
g
Te
F
ro
s
u
tu
rz
re
Al
bo
AS
strike - slip
collision zone
normal fault
thrust fault
plate motion
S
Kura
Caspian
Sea
Figure 2. Active tectonic structures and bathymetry in the Eastern Mediterranean Sea region compiled from our observations and those of Le Pichon et al. (1984), Philip et
al. (1989), Mascle & Martin (1990), Kempler & Garfunkel (1991), Taymaz et al. (1990, 1991, 2004, 2007a, b, 2008), Şaroğlu et al. (1992), Taymaz & Price (1992),
Taymaz (1993, 1996), Kurt et al. (1999), Woodside et al. (2000, 2002), Bozkurt (2001), Zanchi et al. (2002), Poisson et al. (2003), Guidoboni & Comastri (2005a, b),
Tan & Taymaz (2006), Yolsal et al. (2007a, b, 2008a, b), Yolsal (2008) and thereafter. Abbreviations: NAF– North Anatolian Fault, NEAF– North East Anatolian Fault,
EAF– East Anatolian Fault, DSF– Dead Sea Transform Fault, AS– Apşeron Sill, ASM– Anaximander seamounts, BF– Bozova Fault, BGF– Beyşehir Gölü Fault,
BMG– Büyük Menderes Graben, BuF– Burdur Fault, CTF– Cephalonia Transform Fault, DF– Deliler Fault, EcF– Ecemiş Fault, EF– Elbistan Fault, EPF– Ezine Pazarı
Fault, ErF– Erciyes Fault, ESM– Eratosthenes Seamount, G– Gökova, Ge– Gediz Graben, GF– Garni Fault, IF– Iğdır Fault, KBF– Kavakbaşı Fault, KF– Kağızman
Fault, KFZ– Karataş-Osmaniye Fault Zone, MF– Malatya Fault, MRF– Main Recent Fault, MT– Muş Thrust, OF– Ovacık Fault, PSF– Pampak-Savan Fault, PTF–
Paphos Transform Fault, RB– Rhodes Basin, SaF– Salmas Fault, Si– Simav Graben, SuF– Sultandağı Fault, TeF– Tebriz Fault, TF– Tatarlı Fault, TGF– Tuz Gölü Fault.
Large black arrows exhibit relative plate motions with respect to Eurasia (McClusky et al. 2000, 2003; Reilinger et al. 2009). Bathymetric contours are shown at 500
m, 1000 m, 1500 m and 2000 m, and were obtained from GEBCO-BODC (1997).
Ionian
Sea
CTF
ea
ine
IF
RF
ant
M
Lev
iat
Adr
F
G
DSF
Eurasia
S. YOLSAL & T. TAYMAZ
317
EARTHQUAKE SOURCE RUPTURE PARAMETERS AND FAR-FIELD TSUNAMI WAVES
Table 1. Approximate earthquake source parameters of the historical 1222 Cyprus and 1303 Crete tsunamigenic earthquakes
compiled after Ergin et al. (1967), Ambraseys et al. (1994), Guidoboni & Comastri (2005a, b), Yolsal et al. (2007a, b) and
Yolsal (2008).
Earthquake Parameters
11 May 1222 - Cyprus
08 August 1303 - Crete
Origin Time (to)
06:15 UT
03:30 UT
Latitude - Longitude
34°42´N × 32°48´E
35°11´N × 25°38´E
Estimated Intensity
Io ~ IX
Io ~ X
Estimated Magnitude
M ~ 7.0-7.5
M ~ 8.0
Strike / Dip / Rake
305° / 35° / 110°
115° / 45° / 110°
h (focal depth)
15 km
20 km
D (Displacement)
3m
8m
L (Fault length)
~ 50 km
~ 100 km
W (Fault width )
~ 25 km
~ 30 km
by Imamura (1995) to simulate tsunami wave
generation, propagation and coastal amplification of
non-linear long waves in a given arbitrarily shaped
bathymetry. Full details can be found in Imamura
(1995), Pelinovsky et al. (2001), Yalçıner et al. (2003,
2007), Zahibo et al. (2003); Imamura et al. (2006).
Additionally, we have used global bathymetric data
provided by GEBCO-BODC (1997) and Smith &
Sandwell (1997a, b) with a 1000 m grid size and a
time step of Δx/Δt= (2ghmax)1/2, where hmax and g are
the maximum still water depth and gravitational
acceleration, respectively, providing stable and
meaningful simulation results and satisfying in all
cases the Courant-Friedrichs-Lewy (CFL) stability
criterion (Imamura & Imteaz 1995; Yalçıner et al.
2003, 2004; Yolsal et al. 2007a, b; Yolsal 2008).
Theory
Wave propagation is computed by means of a finite
difference model solving the non-linear shallow
water equations on a staggered leap-frog scheme
demonstrated by Aida (1974), Satake (1995),
Imamura (1995) and Imamura et al. (2006). The
governing equations of mass conservation and
momentum in three dimensions (Imamura 1995;
Imamura et al. 2006; Equations 1–4) are expressed by
the following theory,
2o
2o
2o
2o 1 2p
+u
+o
+w
+
+
2t
2x
2y
2z t 2y
(2)
2τ
2τ
1 2τ
c
m
t 2x + 2y + 2z = 0
xy
yy
yz
2o
2o
2o
2o 1 2p
+u
+o
+w
+
+
2t
2x
2y
2z t 2y
(3)
2τ
2τ
1 2τ
c
m=0
+
+
t 2x
2y
2z
xy
yy
yz
1 2p
g + t 2z = 0
(4)
With dynamic and kinetic conditions, we obtained
two dimensional equations named the shallow water
theory (Imamura 1995; Imamura et al. 2006;
Equations 5–7).
2h 2M 2N
+
+
=0
2t
2x
2y
(5)
2M
2 b M 2 l 2 b MN l
+ 2y D +
+
2t
2x D
(6)
2η 2u 2o 2w
+
+
+
=0
2t 2x 2y
2z
318
(1)
+
n
gD 2x + tx = A d
2x 2
2y 2
2h
x
2
2 M
2
2 M
S. YOLSAL & T. TAYMAZ
2N
2 b MN l 2 b N 2 l
+ 2y D +
+
2t
2x D
(7)
2h xy
2 N 2 N
n
+
gD 2y + t = A d
2x 2
2y 2
2
2
where x, y: horizontal axes; z: vertical axis; t: time; D:
total water depth (h+η) ; h: still water depth; η: the
vertical displacement of water surface above the still
water surface; u, v and w are water particle velocities
in the x, y and z directions, g: the gravitational
acceleration. τx and τy : the bottom frictions in the xand y- directions, r: the liquid density, A: the
horizontal eddy viscosity which is assumed to be
constant in space (Figures 3 & 4). M and N are the
discharge fluxes in the x- and y- directions (Imamura
1995; Imamura et al. 2006; Equations 8 & 9) and they
are given by,
h
M=
#
udz = u (h + η) = UD
(8)
odz = o (h + η) = oD
(9)
-h
h
N=
#
-h
Synthetic tsunami waveforms are computed as an
integration of initial and boundary conditions (Abe
& Okada 1995). Once source parameters have been
determined by using all available seismological
information (e.g., source mechanism solutions of
earthquakes, seismic moment estimations and a
general understanding of active tectonics of the
region; Figure 3), then the co-seismic displacement
resulting from the earthquakes can be calculated by
Okada’s (1985) equations. The Okada (1985) elastic
dislocation theory assumes that an earthquake can
be modelled as a rupture of a single rectangular fault
plane characterized by parameters describing the
epicentre location, strike, dip and rake angles,
displacement, rupture length and width, and focal
depth (Figure 3).
By assuming that the rupture speed of the fault
plane is much larger than the phase speed of the
tsunami wave and that the water is incompressible,
initial water elevation is expected to be equal to the
co-seismic vertical displacement of the sea bottom
and the initial velocity field to be identically zero
(Imamura & Goto 1988; Shuto 1991, 1993; Imamura
1995; Yalçıner et al. 2004; Imamura et al. 2006; Gica
et al. 2007). Then, it is used as an initial condition for
the propagation and run-up phases (Legg & Borrero
2001). We further assumed that the vertical
acceleration of water particles is neglected compared
to the gravitational acceleration, that is, the water
mass from the ocean bottom to the surface moves
uniformly in horizontal direction. In addition, wave
theory supposing that a wave travels as a package of
energy through the water column is dealt with by the
tsunami wavelength (λ), wave height (amplitude)
and water depth (h). Because the wavelength of the
tsunami wave (λ) is much greater than the water
depth (h), tsunami waves are called shallow water
waves. Basically, tsunami wave speeds depend upon
the water depth, and consequently the waves
undergo accelerations or decelerations in passing
respectively over an ocean bottom of increasing or
decreasing depth (Bryant 1991, 2001). It is reported
that non-linear convection terms of shallow water
wave equations can be neglected when water depths
are greater than approximately h= 50 m (Shuto 1991;
Satake 1995; Geist 2002). However, non-linear and
dispersion effects become important and may not be
neglected, and thus, if so, Boussinesq type equations
and improved grids of bathymetry will be necessary
in tsunami wave simulations. Figure 4 summarizes
the details of tsunami wave simulation steps that we
have followed in this study.
Empirical Seismological Scaling
Several empirical self-similarity scaling equations are
commonly used for constructing a finite fault source
model (e.g., Romanowicz & Rundle 1993; Wells &
Coppersmith 1994; Pegler & Das 1996; Fuji &
Matsu’ura 2000; Mai & Beroza 2000; Konstantinou et
al. 2005; Tan & Taymaz 2005) and for a quick
evaluation of real-time tsunami assessment (Geist
2002; Gica et al. 2007, 2008; Yolsal et al. 2007a, b;
Yolsal 2008). However, it is also possible to
determine the faulting area (A= L × W) and coseismic displacement from spatio-temporal slip
distribution studies on the fault plane. Several
inversion algorithms have been developed based on
teleseismic broad-band and near-field strong motion
319
EARTHQUAKE SOURCE RUPTURE PARAMETERS AND FAR-FIELD TSUNAMI WAVES
Strike
N
W
L(
m
)
(a)
(m
Rupture Area
)
f
di
p
Hypocenter
d
l
Mo= mAD
Mo = seismic moment (Nm)
m = rigidity (N/m2)
2
A = fault area (L x W)(m )
D = displacement (m)
d
Fault Line
Epicenter
(Hypocenter)
Fault Plane
Figure 3.
(a) Sketch diagram of slip distribution on a fault plane and schematic view of fault orientation parameters (φ: strike, δ: dip
and λ: rake angles), (b) the ray paths of teleseismic waves (upper left corner) and a schematic rupture area (see c–e) as
represented by dip at angle δ. Angle δ= δo or δ= 180–δo depending on the strike angle and on the position to the vertical
(normal or reverse fault). The strike direction is perpendicular to the fault and is oriented at strike angle φ counted
clockwise from North. The slip operates at rake angle λ counted counterclockwise from strike (facing the dipping section),
compiled from Aki & Richards (1980, 2002), Okada (1985), Taymaz (1990), Tan (2004), Tan & Taymaz (2006), Ioualalen
(2007), Yolsal (2008) and Yolsal et al. (2008a, b).
earthquake data (e.g., Kikuchi & Kanamori 1991;
Yagi & Kikuchi 2000). Inversion results provide
direct information about total moment rate function,
stress drop and slip distribution of earthquakes.
These studies have important impacts on mitigating
earthquake hazard as well as providing crucial
information such as the seismic moment tensor, Mij,
that can be used to better determine the
tsunamigenic potential of an earthquake (Pasyanos
et al. 1996; Geist 2002). Seismic moment, measure of
rupture size and earthquake magnitude (see Figure
320
Focal
3a), can be calculated by using the Aki (1966) and
Aki & Richards (1980, 2002) equations:
Mo = μ × A × D
(10)
2
where μ is rigidity (N/m ), A is the faulting area (L
2
(length) × W (width), m ), and D is the maximum
displacement (m). Kanamori (1972), Abe (1973) and
Ward (1980) pointed out linear relationships
between tsunami wave amplitudes and seismic
moment (Mo) values. Although empirical scaling
equations help us to estimate the relation between
source parameters and earthquake seismic moment
nta
lS
ec
tio
n
S. YOLSAL & T. TAYMAZ
Ho
riz
o
North
Sl
ip
f
No
l
180-d0
Strike
al
ers
e
Dipping Section
d0
(b)
(a)
Inv
rm
(c)
(b)
Strike
North
Strike
Horizontal Section
t
f
l0
f
ip
l0
es
W
g
in e)
pp rs
Di nve
(I
Sl
Di
(N ppin
or g
ma W
l) est
Horizontal Section
North
Sli
p
360-l0
d0
(d)
(c)
Di
(In ppin
ve g
rs Ea
e) st
180-d0
d0
(e)
(d)
360-l0
Di
(N ppin
or g
ma Ea
st
l)
180-d0
Figure 3. Continued.
(Kanamori & Anderson 1975; Bonilla et al. 1984;
Wells & Coppersmith 1994; Mai & Beroza 2000; Tan
2004; Tan & Taymaz 2005, 2006; Konstantinou et al.
2005; Yolsal 2008), it is worth noting that the
accuracy of these methods depends on the spatial
and azimuthal coverage of seismic stations and the
number of earthquakes analyzed.
Sensitivity Analyses of Earthquake Source
Parameters
Tsunami wave characteristics in both near and far
fields are affected by various factors that can be
grouped as the source, propagation and local near-
shore bathymetry (Satake 1988). As explained above,
numerical tsunami simulations require earthquake
source geometry as a starting model to calculate the
initial waves; hence source rupture parameters
should be chosen as precisely as possible. Besides,
the wavelength and period of tsunami waves will
depend on the generating source mechanisms and
faulting dimensions. Kajiura (1970), Ben-Menahem
& Rosenman (1972) and Yamashita & Sato (1974)
suggested that the source effect includes the
directivity due to fault orientation and fault
parameters such as strike, dip angles and amount of
slip. The propagation path also comprises the effects
of Earth's sphericity (Miyoshi 1955; Hatori 1963),
321
EARTHQUAKE SOURCE RUPTURE PARAMETERS AND FAR-FIELD TSUNAMI WAVES
(a)
Obtaining bathymetry data
Choosing dx and dt parameters
GEBCO / 97 - BODC bathymetry data
dx: Spatial grid size
dt: Time step
Determining the gauge points
Calculating start and end point
locations of the fault
Determining fault parameters
Fault area (length and width)
Tectonic maps, recent and historical
seismic activity catalogs etc.
Source mechanism solutions
(strike/dip/rake angles, focal depth,
seismic moment and
Dmax displacement etc.)
Slip distributions and / or
empirical equations
Calculating the displacement
on the fault plane
Choosing the total time of wave simulation
TUNAMI N2
wave simulation program
(b)
Obtaining grid files and
converting them to BMP, JPG and AVI
Inundation
line or limit
Tsunami waves
i
am
n
Tsu
Tsunami
u
h
Shoreline
D
Water level
at shoreline
Maximum
water level
Run-up
Datum
h
Horizontal inundation
Basement
Figure 4.
322
(a) Flow chart of numerical tsunami simulation steps (for details see
Okada 1985; Shuto 1993; Imamura 1995 and Yalçıner et al. 2003, 2004)
and (b) a simple illustration of common tsunami parameters. D– total
water depth (h+η); η– vertical displacement of water surface above the
still water surface (h); u– water particle velocities in the x direction
(Imamura 1995; Imamura et al. 2006).
S. YOLSAL & T. TAYMAZ
local bathymetry near the source (Miyoshi 1968) and
scattering of tsunamis by seamounts (Tsuji 1977). In
addition, Geist (2002) demonstrated the importance
of rupture complexity in combination with other
tsunami parameters such as distribution of water
depth in the source region, reductions in shear
modulus near the sea-floor causing the variation of
local tsunami run-up values.
Here, we present brief information about the
historical 1222 Cyprus and 1303 Crete earthquakes,
compiled from several verified documents as case
studies of far field tsunami effects (Yolsal et al. 2007a;
Table 1).
Case Studies
(e.g., Ambraseys 1962; Antonopoulos 1980;
Ambraseys et al. 1994; Guidoboni & Comastri 1997,
2005a, b). Catalogued reports record that strong
tsunami waves from the 1303 Crete earthquake
affected a very large area including Crete, SW
Anatolia, Acre, Alexandria (Egypt) and Rhodes.
Moreover, the sea swept into Crete with such force
that it destroyed many buildings and killed many
people. The Nile River was flooded with great force,
destroying boats, and then, the water retreated,
leaving boats on land (Antonopoulos 1980; El-Sayed
et al. 2000; Papadopoulos et al. 2007). In addition,
Evagelatou-Notara (1993) and Guidoboni &
Comastri (1997) argued that three sedimentary
layers found in Dalaman (SW Turkey) which could
be ascribed to the 1303 Crete earthquake.
11 May 1222 Paphos-Cyprus Earthquake
(06:15 UT, Latitude 34°42´N, Longitude 32°48´E, Io:
IX, M ~7.0–7.5)
Historical documents record many strong
earthquakes which generated tsunami waves in the
past along the Cyprus arc. For example, the May 11,
1222 Paphos earthquake and related tsunami is
reported as one of the most destructive events
affecting coastal plains of southern Cyprus. This
earthquake was extensively felt in Nicosia, as well as
Limassol and Paphos which are situated on the south
and west coast of Cyprus. The harbour of Paphos was
left completely without water, and consequential
tsunami waves were observed in regions as distant as
Alexandria (Egypt) and the Libyan coast, as reported
in verified historical earthquake catalogues (Ergin et
al. 1967; Ambraseys et al. 1994; Guidoboni &
Comastri 1997, 2005a; Salamon et al. 2007; Yolsal et
al. 2007a, b; Yolsal 2008).
08 August 1303 Crete Earthquake
(03:30 UT, Latitude 35°11´N, Longitude 25°38´E, Io:
X, M ~8.0)
The 8 August 1303 Crete event was one of the largest
tsunamigenic earthquakes recorded in the eastern
segment of the Hellenic arc between Crete and
Rhodes. As this earthquake was felt over a wide area,
it was listed in most descriptive and parametric
earthquake catalogues of the Mediterranean basin
Bathymetry
Tsunami propagation can be accurately evaluated by
using high resolution bathymetry and topography
data which are pre-requisite for simulating tsunami
waves and describing wave interactions with
bathymetrical features in the near and distant fields.
Local bathymetric configuration has an especially
important role in determining the amount of
flooding and inundation that the tsunami will cause
in the near field. There are several tectonic structures
in the study area (e.g., Dalaman-Rhodes trough,
Anaximander and Eratosthenes Seamounts,
Mediterranean Ridge, Pliny and Strabo trenches)
affecting the characteristics of tsunami wave
propagation as natural barriers and/or asperities (see
Figure 5).
For example, several studies show that tsunami
waves tend to become concentrated above ridges
(Koshimura et al. 2001) and seamounts (Satake
1988) due to refractions. It is also known that these
type of structures act as a wave-guide which can lead
to enhanced tsunami wave heights at locations where
these ridges reach the shore. Also, in shallow coastal
regions and environments, significant surface wave
energy can be dissipated through wave breaking and
bottom friction processes (Lowe et al. 2005).
Conversely, many moderate-sized thrust faultingrelated earthquakes occur in seismic coupling zones
because the shallow rough surface forms contacts
323
EARTHQUAKE SOURCE RUPTURE PARAMETERS AND FAR-FIELD TSUNAMI WAVES
along the segments of the plate boundary. Hence, a
rough surface creates a contact with the overriding
block suitable to cause an earthquake, to effect slow
rupture in surrounding sediments and enhance
tsunami generation (Tanioka et al. 1997; Bilek & Lay
1999; Stein & Okal 2005; Shaw et al. 2008; Bilek
2009).
Figures 6 & 7 show tsunami wave heights together
with their distribution function as illustrative
examples of the tsunamigenic historical eastern
Mediterranean earthquakes summarised above,
depicting the characteristics of tsunami wave
propagation, and the effects of coastal topography
and near-shore amplifications.
Calculated mareograms indicate that tsunami
waves in shallow water may grow to be several
metres in height due to shoaling effects (Figure 7).
Close to coastlines, wave energy is concentrated
vertically by the decreasing water depth, and
horizontally a shortening of the wave length can be
seen due to the wave slowing down. In particular,
there are prominent sedimentary structures of
continental shelves near Alexandria (Egypt) and
along the eastern Mediterranean African coasts
(Figure 5) where tsunami waves abruptly enter the
shallow water greatly increasing their wave heights
and becoming highly destructive. For example,
tsunami wave amplitude was calculated as ~25 cm
(see location 10) beyond the sedimentary layer near
Alexandria, but it increased to ~2 m (at location 14)
after passing over the continental shelf. Similarly,
along the African coasts wave amplitudes were
calculated as ~67 cm (see location 1) near the
earthquake source, but increased to ~2 m (at location
6) due to the shoaling effect caused by the thick
sedimentary continental shelf (Figure 7).
Furthermore, towards the east around the Nile Delta,
the continental shelf shoals much more gently and
extends much further seawards than elsewhere. In
this part of the region, we have calculated there
would be non-destructive tsunami waves with low
amplitudes (Figures 6 & 7). Similar results were also
observed by Ioualalen et al. (2007) analysing the
effects of 2004 Sumatra earthquake and associated
tsunami, who argued that the extended continental
shelf protected the Bangladesh coast although it was
exposed to the direction of wave propagation.
324
Furthermore, we have calculated that tsunami
wave height was ~75 cm near the earthquake source
(see location a), but it decreased to ~16 cm (see
location e) while propagating further away in
relatively deep sea water (Figure 7). As tsunami
waves have low amplitudes and long wavelengths in
deep water, they can neither be observed nor
detected by people on boats at sea far from the shore.
However, in order to estimate more accurate run-up
heights and to define inundation areas precisely in
the near field, high resolution bathymetry and
topography data are needed. Hence, we advise that
future marine studies should aim to acquire high
resolution bathymetric maps showing the details of
the continental margins and seamounts.
Variation in Earthquake Location
The initial tsunami wave carries the most valuable
information about its source. In particular,
bathymetric structures at the earthquake source
change the shape and velocity of the initial tsunami
wave, while the propagating wave train is further
complicated by reflected and refracted tsunami
waves resulting from topography along its course
both at sea and on shores. The effects of deviation in
earthquake location in the far and near fields were
also previously studied (Okal 1988; Titov et al. 1999;
Gica et al. 2007; Okal & Synolakis 2008), as one of
the commonly accepted crucial earthquake
parameters determining the characteristics of final
tsunami waves arriving at the coasts. However,
archaeological and historical evidences for an
earthquake are not always sufficiently clear or
unambiguous for precise comment. Even so,
compiled reliable historical documents and records
are the most precious sources of information in
assessing historic earthquake parameters (e.g.,
magnitude, intensity and macroseismic epicentral
coordinates). By varying the earthquake locations,
the sea-floor geometries, water depth, bathymetric
structures and distances to the shorelines will
change, thus affecting the initial tsunami wave
amplitudes and shapes. For instance, Titov et al.
(1999) demonstrated the effect of the bathymetry of
the area around the source, and suggested that
tsunami wave characteristics would be different for
an earthquake source near shallow bathymetric
S. YOLSAL & T. TAYMAZ
structures, near seamounts or subduction zones.
However, Okal & Synolakis (2008) reported that the
epicentre of a large source has only a limited effect on
the large-scale tsunami properties in the distant field.
To indicate the significance of earthquake
location, we have selected two different possible
locations for the historical 1303 Crete earthquake (M
~8.0) and calculated synthetic tsunami waves at
Greece
ANATOLIA
od
es
Antalya
Bay
Mediterranean Ridge
Herodotus
Basin
aR
aki
Alexandria
Eratosthenes
AFRICA
Nile Delta
e
idg
t
La
Lev
Tobruk
(a)
Cyp
Mediterranean Sea
Libya
n
rus Lar
Florence
Rise
ge
Rid
sin
Gavdos
Rise
y
in
Pl bo
ra
St
aka
Ba
Crete
Cilicia Basin
Rhodes
Basin Anaximander
ant
ine
Ionian
Sea
Rh
Aegean Sea
Palmyra
Fold Belt
ARABIA
Gaza
Matruh
(b)
Figure 5.
(a) Main bathymetrical features depicting active tectonics and complexity of the Eastern Mediterranean
Basin. Bathymetry data are taken from GEBCO-BODC (1997), (b) locations of bathymetric profiles
discussed in this study, (c) cross sections of P1-P8 profiles in the Eastern Mediterranean. Coloured vertical
bars indicate water depths in metres.
325
EARTHQUAKE SOURCE RUPTURE PARAMETERS AND FAR-FIELD TSUNAMI WAVES
P1
P2
P3
P4
P5
P7
(c)
Figure 5. Continued.
326
P6
P8
Figure 6.
t (min)
(20)
H: 26 cm, T: 25 min
t (min)
(9)
t (min)
(18)
H: 23 cm, T: 10 min
t (min)
(11)
H: 9 cm, T: 10 min
t (min)
(15)
H: 57 cm, T: 1 min
t (min)
(23)
H: 22 cm, T: 2 min
t (min)
(14)
H: 11 cm, T: 26 min
Tsunami wave propagation profiles and synthetic tsunami mareograms calculated to check the propagation of wave characteristics along
the path in the sea and near the shore, marked with numbers, adapting the historical 1222 Cyprus earthquake (M~7.0–7.5; Yolsal et al.
2007a). Dashed rectangle indicates extended sedimentary shelf area near the Nile Delta. Coloured vertical bar shows water surface
elevation (wse) in metres. Above each tsunami mareogram are maximum synthetic wave heights (H) and theoretical arrival times (T),
given in centimetres and minutes, respectively.
t (min)
(22)
H: 54 cm, T: 49 min
t (min)
(8)
H: 6 cm, T: 45 min
t (min)
(4)
wse (cm)
wse (cm)
H: 32 cm, T: 1 min
wse (cm)
wse (cm)
wse (cm)
wse (cm)
wse (cm)
wse (cm)
wse (cm)
wse (cm)
H: 11 cm, T: 22 min
S. YOLSAL & T. TAYMAZ
327
Figure 7.
t (min)
(6)
H: 204 cm, T: 26 min
t (min)
(e)
t (min)
(10)
H: 25 cm, T: 38 min
t (min)
(h)
H: 14 cm, T: 72 min
t (min)
(14)
H: 202 cm, T: 65 min
t (min)
(2)
H: 80 cm, T: 2 min
t (min)
(l)
H: 37 cm, T: 124 min
Tsunami wave propagation profiles and synthetic tsunami mareograms calculated to check the propagation of wave characteristics along the path
in the sea and near the shore, marked with numbers and letters, estimating the historical 1303 Crete earthquake (M ~8.0; Yolsal et al. 2007a). A
coloured vertical bar shows the water surface elevation (wse) in metres. Above each tsunami mareogram are maximum synthetic wave heights
(H) and theoretical arrival times (T), given in centimetres and minutes, respectively.
t (min)
(4)
H: 76 cm, T: 5 min
t (min)
(1)
H: 67 cm, T: 1 min
t (min)
(a)
wse (cm)
wse (cm)
H: 16 cm, T: 35 min
wse (cm)
wse (cm)
wse (cm)
wse (cm)
wse (cm)
wse (cm)
wse (cm)
328
wse (cm)
H: 75 cm, T: 2 min
EARTHQUAKE SOURCE RUPTURE PARAMETERS AND FAR-FIELD TSUNAMI WAVES
S. YOLSAL & T. TAYMAZ
selected coasts to compare the deviation of their
characteristics (wave heights, shapes, travel times as
such). Other earthquake source parameters (e.g.,
focal mechanisms, source depth and vertical
displacement) are fixed at the same values in
numerical simulations. We initially computed the
corresponding co-seismic vertical displacement
using the dislocation model of Okada (1985). The
initial wave heights are shown at the lower left corner
of all figures with positive and negative amplitudes
(Figure 8).
As can easily be seen in Figure 9, we have
observed that the final tsunami wave amplitudes can
be affected by variations in bathymetry along the
propagation direction, despite identical initial wave
amplitudes (~2.5 m for both cases). Therefore, when
we varied the earthquake location, tsunami wave
amplitudes, wave energy distribution and arrival
times of initial waves were calculated to be different
at the same pseudo-tide gauge points. For example,
wave height was calculated to be ~1.5 m at location 4
near Rhodes, but it swiftly increased to ~15 m when
the earthquake epicentre was moved to Location 2
coordinates. These variations are strongly related to
the change of wave propagation path along the
earthquake source and coastal locations. These
differences in synthetic mareograms can also be seen
at other tide gauge locations in the near field.
Variation in Fault Rupture Area
Abe & Okada (1995) indicated the importance of
fault area size on tsunami spectra in numerical
simulations and suggested that increasing the fault
length contributes to a large predominant period,
while also increasing the fault width accelerates a
sharpness of the spectral peak. However, other
studies conducted by Titov et al. (1999) and Okal &
Synolakis (2008) implied that the tsunami waves
exhibit minor sensitivity to the dimensions of the
rupture plane in the far field.
We have applied three tests to assess the effects of
faulting area dimensions on the wave characteristics.
We have modified the faulting area (A) for three
alternative cases while other source parameters are
assumed to be the same. We have observed that the
variation in fault length and fault width affected the
shapes and periods of synthetic tsunami waves
(mareograms) by visually examining simulation
results (Figures 10 & 11). For instance, in the first
case, we have assumed the fault length and fault
width of the 1303 Crete earthquake (Table 1) to be 30
km and 100 km, respectively, as suggested by Yolsal
et al. (2007a, b). In the other cases, we have changed
these source parameters in proportions of ±30%.
After three alternative tsunami simulations, we have
calculated three different wave amplitudes and
shapes at the same pseudo-tide gauge sites.
Theoretical arrival times of initial tsunami waves
were calculated as being similar in each case. As a
result, by increasing the rupture area, initial and final
tsunami wave amplitudes have also been distinctively
increased (Figure 11).
Variation in Focal Mechanism
Tsunami waves are generally caused by submarine
earthquakes that have dip-slip fault mechanisms
such as normal and/or thrust faulting. Many studies
showed that tsunami waves travel outwards in all
directions from the source, with the direction of the
main energy distribution being orthogonal to the
fault strike of the earthquake rupture zone at various
speeds depending on the water depth propagated
(e.g., Yamashita & Sato 1974). Also, Okal (1988)
emphasized the effects on directivity caused by
rupture propagation along the fault and the
possibility of enhanced tsunami excitation in
material with weaker elastic properties such as
sedimentary layers. Furthermore, the importance of
the properties of material such as rigidity and the
model of rigidity (μ) variation with depth in a region
is essential for the tsunamigenic earthquakes to
produce unusually strong tsunamis for their seismic
moment (Kanamori 1972; Bilek & Lay 1999; Polet &
Kanamori 2000; Taymaz et al. 2005; Stein & Okal
2005; Ammon et al. 2005; Ni et al. 2005; Konca et al.
2008). However, Titov et al. (1999, 2005) suggested
that for a given fault mechanism, moderate changes
in the dip and rake angles have scant effect on far
field tsunami amplitudes, compared to other source
parameters. They applied some tests indicating that
lowering the dip angle from 20° to 10° leads to a 30%
decrease in the amplitudes for leading tsunami
waves, but they explained that the period and the
329
EARTHQUAKE SOURCE RUPTURE PARAMETERS AND FAR-FIELD TSUNAMI WAVES
115°/45°/110°/20 km
Dmax = 8 m W = 30 km L = 100 km
Location 1
Location 2
Figure 8.
Snapshots of the initial tsunami wave heights generated with the parameters summarized above and
locations of pseudo tide gauge stations by varying epicentre location. Initial wave heights and earthquake
epicentre locations are shown in the boxes located at the lower left corners. Above the map, source
parameters used in the study are given in order of strike, dip, rake angles, focal depth, maximum
displacement, fault width and length. Red squares show the trial earthquake epicentres. A vertical colour
scale indicates the water surface height given on the right-hand side in metres.
shape of the initial wave stays nearly the same for all
dip angles. Also, Ioualalen (2007) pointed out that
earthquake focal mechanism solution (e.g., dip
angle) is a key parameter that controls the
subsidence/uplift dipole for tsunami waves.
330
Here, we present three different tests of focal
mechanism solutions in order to compare synthetic
tsunami wave characteristics (Figure 12; Table 2). All
the models consist of thrust faulting mechanisms,
but their strike, dip and rake angles are different.
S. YOLSAL & T. TAYMAZ
Figure 9.
Comparison of synthetic tsunami records calculated at pseudo-tide
gauge locations in case of variation in earthquake epicentres for
cases of 1 and 2.
331
EARTHQUAKE SOURCE RUPTURE PARAMETERS AND FAR-FIELD TSUNAMI WAVES
A1 (W = 21 km, L = 70 km)
115°/45°/110°/20 km/8 m
A2 (W = 30 km, L = 100 km)
115°/45°/110°/20 km/8 m
A3 (W = 39 km, L = 130 km)
115°/45°/110°/20 km/8 m
Figure 10. Snapshots of the initial tsunami wave heights generated with the parameters summarized above and locations of pseudotide gauge stations by varying faulting area (A). Initial wave heights with maximum positive and negative amplitudes are
shown in the boxes located at the lower left corners. Above the map, at the upper left corner fault width and length and at
the upper right corner strike, dip, rake angles, focal depth and maximum displacement used in simulations are given. Red
squares show the earthquake epicentres. A vertical colour scale indicates the water surface height given on the right-hand
side in metres.
332
S. YOLSAL & T. TAYMAZ
Figure 11. Comparison of synthetic tsunami records at selected pseudo-tide
gauge locations in case of variation in faulting area dimensions
for models of A1, A2 and A3.
333
EARTHQUAKE SOURCE RUPTURE PARAMETERS AND FAR-FIELD TSUNAMI WAVES
While the first focal mechanism reveals nearly E–Woriented thrust faulting, the second and third ones
indicate approximately N–S-oriented thrust faulting
parameters with variable dip and rake angles. Other
relevant earthquake source parameters are assumed
to be fixed throughout the simulations (Table 2).
Consequently, we have observed that tsunami waves
propagate in such a way that most of the wave energy
is directed perpendicular to the fault plane on which
the earthquake was initiated (Figures 12 & 13) from
the resulting obvious complexities of tsunami wave
characteristics.
Variation in Vertical Displacement
The initial size of tsunami waves is also determined
by the amount of vertical sea-floor deformation with
respect to earthquake magnitude, seismic moment
(Mo), focal depth and fault properties. Among other
parameters, only the amount of vertical
displacement is linearly related to the coastal
deformation and consequently to initial wave heights
at the source (Satake & Tanioka 1995). However,
heterogeneous slip distribution, particularly in the
dip direction for subduction zone earthquakes, has
crucial effects on the static vertical displacement
field and tsunami generation (Freund & Barnett
1976; Geist & Dmowska 1999; Geist 2002). Modern
seismological tools help us to estimate the amount of
maximum vertical displacement by modelling slip
distribution and the rupture process of tsunamigenic
earthquakes (Taymaz et al. 2005).
We have calculated the water surface fluctuations
and velocities for Dmax to be 5 m, 8 m and 10 m at the
source for propagating tsunami waves at selected tide
gauge locations, even for shallow water and land
regions within the limitations of the bathymetric grid
size (Figure 14). Simulation results showed
increasing tsunami wave amplitudes with increasing
vertical displacements. For example at location 1
(near Crete) wave amplitude is calculated to be ~4.5
m and ~8.7 m for Dmax 5 m and 10 m, respectively.
These values are nearly twice those specified by Dmax
values. However, the shapes of total synthetic
tsunami waveforms and theoretical arrival time of
waves at eight selected coastal locations were
determined to be similar (Figure 15).
334
Variation in Focal Depth
Earthquake focal depth, defined as a centroid point
within the Earth, from which seismic energy is
released, is another essential source parameter for
tsunami wave simulations in the far field. For
instance, shallow subduction zone earthquakes can
excite destructive tsunamis and cause catastrophic
consequences on coastal plains (Polet & Kanamori
2000). In addition, Okal (1988) examined the
influence of focal depth on tsunami waves, and
explained that the source depth plays only a minor
role in the generation of tsunamis with an example
showing that the tsunami wave amplitude is reduced
by a factor of 2 when focal depth ranges from 20 km
to 100 km.
Table 2. Earthquake source parameters used in sensitivity tests
of variation in focal mechanism. Focal depth (H= 20
km), maximum vertical displacement (Dmax= 8 m),
fault length (L= 100 km), and fault width (W= 30 km)
are fixed to be same at each simulations (see Figure
12).
Model No
Strike / Dip / Rake
Model 1
115° / 45° / 110°
Model 2
220° / 40° / 140°
Model 3
150° / 40° / 095°
In this study, we have established the major
effects of focal depths on tsunami wave
characteristics in the far field by changing the
earthquake focal depths to be 5 km, 10 km and 20
km. Other parameters are assumed to be same in
each case (Figure 16). We found that tsunami wave
amplitudes changed considerably by varying focal
depths. When we fixed the focal depth at 5 km, the
amplitude of tsunami wave was calculated to be ~2 m
at location 4. However, when the focal depths were
fixed at values of 10 km and 20 km, wave amplitudes
decreased to ~1.7 m and ~1.5 m at the same location,
respectively. The shape and frequency of synthetic
tsunami waveforms (mareograms) and theoretical
arrival times of tsunami waves were observed to be
nearly the same at each selected pseudo tide gauge
location (see Figure 17).
S. YOLSAL & T. TAYMAZ
115°/45°/110°/20 km
Dmax = 8 m W = 30 km L = 100 km
Model 1
220°/40°/140°/20 km
Dmax = 8 m W = 30 km L = 100 km
Model 2
150°/40°/95°/20 km
Dmax = 8 m W = 30 km L = 100 km
Model 3
Figure 12. Snapshots of the initial tsunami wave heights generated with the parameters summarized above and locations of pseudotide gauge stations by varying source mechanisms. Initial wave heights with maximum positive and negative amplitudes are
shown in the boxes located at the lower left corners. Above the map, source parameters used in the study are given in order
of strike, dip, rake angles, focal depth, maximum displacement, fault width and length. Red squares show the earthquake
epicentres. A vertical colour scale indicates the water surface height given on the right-hand side in metres.
335
EARTHQUAKE SOURCE RUPTURE PARAMETERS AND FAR-FIELD TSUNAMI WAVES
Figure 13. Comparison of synthetic tsunami records at selected pseudo-tide
gauge locations in case of variation in earthquake focal
mechanism solution for models of M1, M2 and M3.
336
S. YOLSAL & T. TAYMAZ
115°/45°/110°/20 km
Dmax = 5 m W = 30 km L = 100 km
D=5m
115°/45°/110°/20 km
Dmax = 8 m W = 30 km L = 100 km
D=8m
115°/45°/110°/20 km
Dmax = 10 m W = 30 km L = 100 km
D = 10 m
Figure 14. Snapshots of the initial tsunami wave heights generated with the parameters summarized above and locations of pseudotide gauge stations by varying maximum displacement (Dmax). Initial wave heights with maximum positive and negative
amplitudes are shown in the boxes located at the lower left corners. Above the map, source parameters used in the study
are given in order of strike, dip, rake angles, focal depth, maximum displacement, fault width and length. Red squares show
the earthquake epicentres. A vertical colour scale indicates the water surface height given on the right-hand side in metres.
337