Geochemical characterization and palynological studies of some Agbada Formation deposits of the Niger Delta basin: implications for paleodepositional environments
Bạn đang xem bản rút gọn của tài liệu. Xem và tải ngay bản đầy đủ của tài liệu tại đây (1.23 MB, 19 trang )
Turkish Journal of Earth Sciences
/>
Research Article
Turkish J Earth Sci
(2016) 25: 573-591
© TÜBİTAK
doi:10.3906/yer-1512-8
Geochemical characterization and palynological studies of some Agbada Formation
deposits of the Niger Delta basin: implications for paleodepositional environments
1
1,
1
Olajide Femi ADEBAYO , Segun Ajayi AKINYEMI *, Henry Yemagu MADUKWE ,
2
1
Adeyinka Oluyemi ATURAMU , Adebayo Olufemi OJO
1
Department of Geology, Ekiti State University, Ado Ekiti, Nigeria
2
Department of Geology, University of Leicester, Leicester, UK
Received: 14.12.2015
Accepted/Published Online: 06.09.2016
Final Version: 01.12.2016
Abstract: Forty-two ditch cutting samples of the KR-1 offshore well from depths of 9660 ft to 10,920 ft composited at 90-ft intervals
were subjected to sedimentological, micropaleontological, and geochemical analyses using standard procedures and the laser ablationinduced coupled plasma mass spectrometry technique, respectively. Sedimentological analysis revealed the presence of glauconites and
the rare occurrence of framboidal pyrites, indicative of deposition in a slightly anoxic marine environment. Palynomorph percentage
distribution shows that there are more terrestrially derived miospores (dominated by Zonocostites ramonae (Rhizophora spp.),
Psilatricolporites crassus (Tabernaemontana crassa), Acrotichum aureum, and Laevigatosporites sp.) than marine phytoplanktons. Rare
occurrence of Globoquadrina venezuelana, Globigerinoides promordius, and Globigerina sp. denotes an Early Miocene age and proximal
shelf. These indicate that the main environment of deposition in the KR-1 well is coastal to marginal marine consisting of coastal deltaicinner neritic, made up of tidal channel and shoreface deposits. Geochemical results show that the average concentrations of considered
rare earth elements are less than their concentrations in world average shale. Trace metal ratios (such as Th/Cr, Cr/Th, Th/Co, and Cr/
Ni) suggest that the investigated sediments were derived from felsic source rocks. Rare earth element patterns (such as La/Yb, Gd/Yb,
La/Sm, and Eu/Eu) and Th data established the felsic composition of the source rocks. Ratios of U/Th, Ni/Co, Cu/Zn, and V/Sc suggest
a well-oxygenated bottom water condition. Estimated europium and cerium anomalies of the studied samples suggest an oxidizing
environment of deposition. Nonetheless, the ratios of V/Cr suggest a range of environmental conditions. Moreover, ratios of V/(V+Ni)
suggest the rare occurrence of suboxic to anoxic environments of deposition.
Key words: Sedimentology, palynomorphs, traces elements, rare earth element, environment of deposition, Niger Delta, Nigeria
1. Introduction
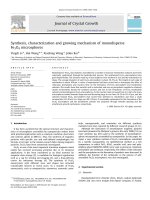
The Niger Delta basin is one of the sedimentary basins
in Nigeria (Figure 1). It is an important basin because
it contains large hydrocarbon resources. This makes
Nigeria the most prolific oil producer in Sub-Saharan
Africa, ranking as the third largest producer of crude
oil in Africa and the tenth largest in the world. Nigeria’s
economy is predominantly dependent on its oil sector;
oil supplies 95% of Nigeria’s foreign exchange earnings
and 80% of its budgetary revenues (Olayiwola, 1987;
Adenugba and Dipo, 2013). This petroliferous nature has
made the basin, for many years, the subject of continuous,
consistent, and extensive geologic investigations both
for academic and economic purposes (Adebayo, 2011).
Intensive exploration and exploitation of hydrocarbon in
the basin has been ongoing since the early 1960s due to the
discovery of oil in commercial quantity in the Oloibiri-1
well in 1956 (Nwajide and Reijers, 1996). Biostratigraphy
*Correspondence:
played an important role in the exploration of oil and
gas in the Niger Delta basin. Microfossils were employed
among other things to reconstruct the paleoenvironment
of the studied sections. This is important because different
depositional settings imply different reservoir qualities
in terms of architecture, connectivity, heterogeneity, and
porosity-permeability characteristics (Simmons et al.,
1999).
Trace element abundances in sedimentary rocks
have added significantly to our understanding of crustal
evolution with rare earth element (REE) patterns and
Th being particularly useful in determining provenance
(Ganai and Rashid, 2015). The geochemical behavior
of trace elements in modern organic-rich, fine-grained
sedimentary rocks (i.e. shales) and anoxic basins has
often been documented to determine paleoenvironmental
conditions of deposition (Brumsack, 1989; Calvert and
Pedersen, 1993; Warning and Brumsack, 2000; Algeo
573
ADEBAYO et al. / Turkish J Earth Sci
Figure 1. Geological map of the Niger Delta (Weber and Daukoru, 1975).
and Maynard, 2004). Redox-sensitive trace element
(TE) concentrations or ratios are among the main
extensively used indicators of redox conditions in
modern and ancient sedimentary deposits (e.g., Calvert
and Pedersen, 1993; Jones and Manning, 1994; Crusius
et al., 1996; Dean et al., 1997, 1999; Yarincik et al.,
2000; Morford et al., 2001; Pailler et al., 2002; Algeo
and Maynard, 2004). Enrichments of redox-sensitive
elements replicate the depositional environment of
ancient organic carbon-rich sediments and sedimentary
rocks as well and can consequently be used to reveal
the likely paleodepositional conditions leading to their
formation (Brumsack, 1980, 1986; Hatch and Leventhal,
1992; Piper, 1994). The degree of enrichment/depletion
is usually based on the element/Al ratio in a sample,
calculated relative to the respective element/Al ratio of
a common standard material, e.g., average marine shale
(Turekian and Wedepohl, 1961). The purpose of this
paper is to interpret the paleoenvironmental changes
during the deposition of the sediments in the studied
section of the Niger Delta basin. To achieve the objective, a
multidisciplinary approach combining sedimentological
features and palynological and geochemical analyses was
employed.
574
2. The geologic setting of the basin
The present-day Niger Delta Complex is situated on the
continental margin of the Gulf of Guinea in the southern
part of Nigeria. It lies between longitudes 4 °E and 8.8 °E
and latitudes 3 °N and 6 °N (Figure 1).The onshore portion
of the basin is delineated by the geology of southern
Nigeria and southwestern Cameroon. It is bounded in
the north by outcrops of the Anambra Basin and the
Abakaliki Anticlinorium, and delimited in the west by the
Benin Flank, a northeast-southwest trending hinge line
south of the West African basement massif. The Calabar
Flank, a hinge line bordering the Oban massif, defines the
northeastern boundary. The offshore boundary of the basin
is defined by the Cameroon volcanic line to the east and
the eastern boundary of the Dahomey Basin (the easternmost West African transform-fault passive margin) to
the west. The evolution of the delta is controlled by preand synsedimentary tectonics as described by Evamy et
al. (1978), Ejedawe (1981), Knox and Omatsola (1987),
and Stacher (1995). It is a large arcuate delta covering an
area of about 300,000 km2 (Kulke, 1995), with a sediment
volume of 500,000 km3 (Hospers, 1965) and a sedimentary
thickness of over 10 km in the basin depocenter (Kaplan
et al., 1994).
ADEBAYO et al. / Turkish J Earth Sci
The evolution of the basin has been linked to that of
a larger sedimentary complex called the Benue-Abakaliki
Trough. The trough, a NE-SW trending aborted rift basin
with folded sedimentary fill, runs obliquely across Nigeria
(Figure 1). The Niger Delta basin is actually the youngest
and the southernmost subbasin in the trough (Murat,
1972; Reijers et al., 1997).
The evolution of the trough, which began in the
Cretaceous, during the opening of the South Atlantic,
led to the separation of the African and South American
plates. The tectonic framework of the continental
margin along the western coast of Africa is controlled by
Cretaceous fracture zones expressed as trenches and ridges
in the deep Atlantic. The fracture zone ridges subdivided
the margin into individual basins and, in Nigeria, form
the boundary faults of the Cretaceous Benue-Abakaliki
Trough, which cuts far into the West African Shield.
The rifting greatly diminished in the Late Cretaceous in
the Niger Delta region (Ako et al., 2004). A well section
through the Niger Delta basin generally displays three
vertical lithostratigraphic subdivisions, namely a prodelta
lithofacies, a delta front lithofacies, and upper delta top
facies (Nwajide and Reijers, 1996). These lithostratigraphic
units correspond respectively to the Akata Formation
(Paleocene-Recent), Agbada Formation (Eocene-Recent),
and Benin Formation (Oligocene-Recent) (Short and
Stauble, 1967).
3. Materials and methods
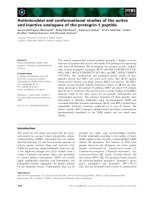
Forty-two ditch cutting samples of the KR-1 offshore well
(Figure 2) were taken from depths of 9660 to 10,920 ft at 90ft interval (Figure 3). These were processed and analyzed
for sedimentological, palynological, micropaleontological,
and geochemical studies.
3.1. Sedimentological analysis
The samples were subjected to sedimentological analysis
using visual inspection and a binocular microscope.
Physical characteristics such as color, texture, hardness,
fissility, and rock types were noted. Dilute HCl (10%) was
added to identify the calcareous samples. Fossil contents,
presence of accessory minerals, and postdepositional
effects such as ferruginization were determined.
3.2. Palynological preparation
Ten grams of each dry sample was crushed into small
fractions between 0.25 mm and 2.5 mm. Standard
palynological processing procedures were employed
(Faegri and Iversen, 1989; Wood et al., 1996). These
included the digestion of the mineral matrix using dilute
HCl for carbonates and concentrated HF for silicates.
Removal of the fluoride gel (formed during the HF
treatment) was done using hot concentrated HCl and wet
sieving the residue using a 10-µm polypropylene Estal
Mono sieve. The residues were oxidized and inorganic
materials were separated from the organic ones using
ZnCl2 of specific gravity 2.0. Slides were mounted using
Norland adhesive mounting medium and dried under
UV light. One slide per sample was analyzed under the
optical microscope and the photomicrographs of wellpreserved palynomorph specimens were taken using an
Olympus CH30 transmitted light microscope (Model
CH30RF200) with an attached camera. Palynomorph
identifications were done using the works of Germeraad et
al. (1968) and Evamy et al. (1978) (i.e. Shell Oil Company
Scheme, 1978). The data were plotted using StrataBugs
software at 1:5000 scale with depth on the y-axis and the
identified taxa on the x-axis.
3.3. Foraminiferal preparation
Twenty-five grams of each sample was processed for their
foraminiferal content using the standard preparation
techniques. The weighed samples were soaked in kerosene
and left overnight to disaggregate, followed by soaking in
detergent solution overnight. The disaggregated samples
were then washed-sieved under running tap water over
a 63-µm mesh sieve. The washed residues were then
dried over a hot electric plate and sieved (when cooled)
into three main size fractions, namely coarse, medium,
and fine (250-, 150-, and 63-µm meshes). Each fraction
was examined under a binocular microscope. All the
foraminifera, ostracodes, shell fragments, and other
microfossils observed were picked with the aid of a
picking needle and counted. Foraminifera identification
was made to genus and species levels where possible
using the taxonomic scheme of Loeblich and Tappan
(1964) and other relevant foraminiferal literature such
as the works of Fayose (1970), Postuma (1971), Petters
(1979a, 1979b, 1982), Murray (1991), and Okosun and
Liebau (1999).
3.4. XRF and LA-ICPMS analyses
The pulverized ditch cutting samples were analyzed with
X-ray fluorescence (XRF) and laser ablation-induced
coupled plasma mass spectrometry (LA-ICPMS)
techniques. The elemental data for this work were
acquired using XRF and LA-ICPMS analyses.
The analytical procedures were as follows:
Pulverized ditch cutting samples were analyzed for
major elements using an Axios instrument (PANalytical)
with a 2.4-kW Rh X-ray tube. The same set of samples
was further analyzed for trace elements using LA-ICPMS
instrumental analysis. LA-ICPMS is a powerful and
sensitive analytical technique for multielement analysis.
The laser was used to vaporize the surface of the solid
sample, while the vapor and any particles were then
transported by the carrier gas flow to the ICP-MS. The
detailed procedures for sample preparation for both
analytical techniques are reported below.
575
ADEBAYO et al. / Turkish J Earth Sci
Figure 2. Simplified geologic map of Nigeria and location of KR-1 well (Adebayo et al., 2015b).
3.4.1. Fusion bead method for major element analysis
• Weigh 1.0000 ± 0.0009 g of milled sample.
• Place in oven at 110 °C for 1 h to determine H2O+.
• Place in oven at 1000 °C for 1 h to determine LOI.
• Add 10.0000 ± 0.0009 g of Claisse flux and fuse in M4
Claissefluxer for 23 min.
• Add 0.2 g of NaCO3 to the mix and preoxidize the
sample+flux+NaCO3 at 700 °C before fusion.
• Flux type: Ultrapure Fused Anhydrous Li-TetraborateLi-Metaborate flux (66.67% Li2B4O7 + 32.83% LiBO2) and
releasing agent Li-iodide (0.5% LiI).
3.4.2. Pressed pellet method for trace element analysis
• Weigh 8 ± 0.05 g of milled powder.
• Mix thoroughly with 3 drops of Mowiol wax binder.
• Press pellet with pill press to pressure of 15 t.
• Dry in oven at 100 °C for 30 min. before analyzing.
These analytical methods yielded data for 11 major
elements, reported as oxide percent by weight [SiO2, TiO2,
Al2O3, Fe2O3, MgO, MnO, CaO, Na2O, K2O, Cr2O3, and
576
P2O5] and 21 trace elements [Ni, Cu, Zn, Ga, Rb, Sr, Y, Zr,
Nb, Co, V, Pb, Th, U, Ti, Cr, Ba, La, Ce, Nd, and P] reported
as mg/kg (ppm).
4. Results and discussion
4.1. Sedimentological analysis
Lithologically, the sequence is characterized by the
alternation of shale and sandy shale facies (Figure 3).
The shales are light gray, fissile, effervescent and slightly
ferruginized while the sandy shales are light gray and
ferruginous. These sediments contain muscovite flakes.
There are few to common occurrences of glauconite
while pyrite and shell fragments are rare to few. Quartz
grains within the sediments vary from fine to medium,
subangular to well-rounded and moderately sorted.
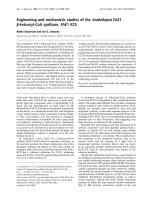
4.2. Palynological assemblage
Palynomorph preservation in the analyzed sediments
is fairly good with high concentration and diversity (see
Figures 4 and 5). All the samples yielded common to
ADEBAYO et al. / Turkish J Earth Sci
Figure 3. The lithology of the KR-1 well (after Adebayo et al., 2015b).
abundant assemblages that range from moderate to well
preserved. Dinoflagellate cysts are sporadically present
and range in abundance from very rare to few and do not
occur in all the samples.
There are 256 pollen grains, 220 spores, 231
Botryococcus and Pediastrum, 9 dinoflagellate cysts, and
3 microforaminiferal wall linings, making a total of 719
recovered palynomorphs. The assemblage is dominated
by angiospermous pollen with an equally significant
occurrence of pteridophyte spores. The angiosperms
consist mainly of Tricolporites, Tetraporites, and
Monoporites while Laevigatosporites, Verrucatosporites,
and Polypodiaceoisporites are the dominant pteridophyte
spores (Figures 4 and 5). The biostratigraphically
important palynomorphs recovered from the well are
Zonocostites ramonae (Rhisophora sp.), Psilatricolporites
crassus
(Tabermaemontana
sp.),
Pachydermites
diederixi (Symphonia globulifera), Retitricolporites
irregularis (Amanoa sp.), Praedapollis africanus, and
Verrucatosporites usmensis (Polypodium sp.) (Figures 4
and 5). The palynomorph assemblage as a whole shows
strong similarities with those previously identified in
the San Jorge Gulf Basin, southern Patagonia, Argentina
(Palamarczuk and Barreda, 1998), and especially those
from the Mazarredo Subbasin (Barreda and Palamarczuk,
2000), dated as Early Miocene and Latest OligoceneEarly Miocene, respectively. The KR-1 well assemblage
is also closely comparable to the Early Miocene interval
577
ADEBAYO et al. / Turkish J Earth Sci
1
2 0
1
1
1
1
2 7
5
1
3
3 3
5
1
1
7
1
1
1
5
1
1
5
1
3
1
3
1 0 9 2 0
2
1
2
1
?
f
?f
10500'
10750'
TD
10920
3
2
5 0
De pth (ft)
i s B A S E o f d e p t h ra n g e
2
S am p l es
2
T ota l coun t: Bot ryococ cus And P edias trum
1
Div ersity : Botr yococ cus A nd Pe diastr um
5
Dive rsity: Dinof lagella te Cy sts
2
T ot al cou nt: Mo nopor ites A nnula tus
Div ersity : Mon oporit es An nulatu s
T otal co unt: Z onoc ostites Ram onae
D iversi ty: Z o nocos tites R amo nae
T o tal cou nt: S pore
D iversit y: Sp ore
T otal count : Polle n
Dive rsity: Polle n
Mono porit es ann ulatus
Z o nocos tatite s ramo nae
Spini ferites sp
T uberc ulod inium vancam poa e
H ystrich okol poma rigaud iae
Po lyspha eridi um zo haryi
Spi niferit es ram osus
Lingu lodin ium m achae ropho rum
Microf orami nifera wall li ning
Pe diastru m sp
1 2
*4
1
3
7
3
6
1
2 1
9
2
2 0
2
2
8
4
3
7
3
3
5
9
1
3
4 0
1
3
2
6
3
2 0
1 6
2
4
5
2 0
2
6
5
3
1
8
1
1 0
1 0
2 3
2
2
2
6
1 1
1
1
9 9 3 0
6 8
2 9
3
9 8 4 0
2 7
2
2 2
1 0 2 0 0
2 0
1
9
2 1 7
1 0 3 8 0
1
2 0
2 1 8
1 0 4 7 0
2 3
1 0 5 6 0
1 0
1
1 0
1
3
3
5
4
1 1
1
2 0 1
1
1
4 0 1
1
1
6
1
10000'
1 0 0 2 0
1 0 1 1 0
1 3
1
9750'
9 7 5 0
2 0
1
1
3
1
1 5 1
1
4
2
3
1 0
9
3
2
3 3 1
5 8 1
2
4
2
1 0
2
4
1
4
1 0
1
1
3
3
1
1 1
2
10250'
1 0 2 9 0
10500'
1 0 6 5 0
10750'
1 0 7 4 0
1 0 8 3 0
2 5
TD
1 0 9 2 0
(5 m m = 1 0 c o u n t s )
a
? F a u lt
A b s o lu te a b u n d a n c e
(5 m m = 4 c o u n t s )
*2
*3
A b s o lu te a b u n d a n c e
A b s o lu te a b u n d a n c e
(5 m m = 3 c o u n t s )
(5 m m = 2 c o u n t s )
CRYSTAL AGE LIMITED
LAGOS
K R -1
APPENDIX-2
r oject : DEM O
P
Car t : KR- 1- M
h
FOBC
FOBC
Fora m inife ra Calc a re ous
15
L e n ti c u l i n a i n o rn a ta
C i b i c i d o i d e s u n g e ri a n u s
Fl o ri l u s a tl a n ti c u s
200
C a n c ri s a u ri c u l u s
E p onides s pp.
H opk ins ina bo noni ens is
D i v e rs i ty : Fo ra m i n i fe ra C a l c a re o u s
To ta l c o u n t: Fo ra m i n i fe ra C a l c a re o u s
5
FOBA
FOBA
MM
Sem i- quant it at ive, ( Def ault Abundance Schem e)
M ic ro.
M ic ro.
Pa la e oe nv ironm e nt
Pa la e oe nv ironm e nt
*1
3
1
150
Bioevents
15
D e pth (ft)
FOP
P l a n k ti c s i n d e te rm i n a te
G l o b i g e ri n a c i p e ro e n s i s a n g u s ti u m b i l i c a ta
G l o b i g e ri n o i d e s p ra e b u l l o i d e s
D i v e rs i ty : Fo ra m i n i fe ra P l a n k to n i c
dept h r an ge
1
6
A b s o lu te a b u n d a n c e
*1
FOP
3
6
2
2
6
3
1 5
1 0
M i d d l e Ne ri ti c
Pla n k t ic F o r a m in if e r a Z o n e
?N 5 & Y ounge r
? Ear ly M ioc ene
10250'
s a n d y m u d s to n e
2
1
3 4 1
9750'
9750
10000'
s h a l e /m u d s to n e
3 0
7
5
2
2 0
1
3
8
1
3
4
9 6 5 0 .0
9750'
Ba s e Lithology
To ta l c o u n t: Fo ra m i n i fe ra P l a n k to n i c
2000
1
2
7
Te x t Ke y s
S am pl e d ept h i s B A S E of
m/ m )
4
BIODATUMS
? U n c o n f o rm a b l e
F a u lt
*1
Zon e
De e p Induc tion
0. 2( ohm
9840
Possible
Pr obable
Conf ident
6
9
9930
10020
1
1
24
9
26
10000'
11
1
10110
1
10200
10250'
10290
10470
1
2
1
2
1
117
14
1
1
10560
10650
1
121
18
3
2
3
1
175
10830
10920
?U
ncon f or m ab
e
l
?
Fa
ult
f
?f
?F
ault
Defa ult Abu nda nc e Sc he m e
Pr esent ( 1 )
Presence of Globigerina
ciperoensis angustiumbilicata
10500'
b
10750'
10740
25
Un
conf or m able
Lith ology Stringe r s
IGD Bounda ry Ke y
4
7
10380
N ot Yo unger
than N 5
150
4
2
3
3
U n c o n f o rm a b l e
2
1 0
2
1 3
DEPT. OF GEOLOGY, EKITI STATE UNIVERSITY, ADO - EKITI, NIGERIA
Pe r io d /Ep o c h C h r o n o s t r a t ig r a p h y
( API )
7
1
2
1 5
2 2
1 2
1
1
1
1
Po s s ib le
2
FORAM INIFERAL DISTRIBUTION CHART OF WELL KR-1
L it h o lo g y
Ga m m a Log
0
5
4
1 0
1 3
1 6
1
2
1
IGD Bounda ry Ke y
Sam ples
1
6
2
FOP
1
1
1 0
7
7
6
1 5
1
6 1
2
1
1
In n e r Ne ri ti c
: 2 0 Fe brua ry 2 0 0 6
1
1
2
Co a s t a l De t l ta i c
Cha rt da te
2 6
7
1
1 8
D i v e rs i ty : M i c ro p a l a e o n to l o g y
: 1 :5 0 0 0
2
T o ta l c o u n t: M i c ro p a l a e o n to l o g y
: 9660' - 10920'
D e pth (ft)
: KR-1 -M
Sc a le
2
3
Well Name : KR-1
Inte rv a l
2
1 7
9
1
2 3
1
G a s t ro p o d .
1
1
3
1 0 9 2 0
8
1
P ro b a b l e
Co n fid e n t
We ll Code
fun gal sp ore
Ver rucato spori tes us mensi s
Lyco podiu m sp
Magn astria tites h oward ii
B otryo coccu s brau nii
Verruc atosp orites spp
4
1
S h e l l fra g m e n ts
S pon ges .
O s tra c o d .
S c aph opoda .
1
Lithology Stringe rs
Lithology Ac c e s s orie s
*1
T ota l coun t: Din oflage llate C ysts
2
1
s a n d y m u d s to n e
*4
D i v e rs i ty : Fo ra m i n i fe ra A g g l u ti n a ti n g
s h a l e /m u d s to n e
Lae vigato sporit es spp
Pa chyde rmites diede rixi
Reti tricolp orites irregu laris
Stere ispori tes sp p.
P odoc arpidi tes sp p
S apota ceae .
P raeda pollis spp
Ch arred grami nee cu tticle
Prie dapo llis afr icanus
Psila tricol porites crass us
Pro xaper tites c ursus
Poll en in determ inate
Polyp odia ceoisp orites spp.
P silatr icolp orites spp.
A crosti chum aureu m
E va m y et a l . (1 978 )
S ub Zo ne
Z one
1
1 09 2 0
Lithology Qua lifie rs
EM O
D
K- 1
R
-P
MW ZO MA Pollen Pollen Spor e Spor e ZO ZO MA MA DC DC ALBO ALBO
*3
9 6 6 0 .0
1
1 0 9 2 0
Ba s e Lithology
Pr oject :
Char t :
DC
*2
B ri z a l i n a m a n d o ro v e e n s i s
V a l v u l i n e ri a s p p .
10750'
TD
( 5 m m = 5 *1
c o u n ts )
To ta l c o u n t: Fo ra m i n i fe ra A g g l u ti n a ti n g
10500'
APPENDIX-3
ALBO
A b s o lu te a b u n d a n c e
B oliv ina s pp.
B u l i m i n e l l a a ff . s u b f u s i fo rm i s
C a l c a r e o u s i n d e te rm i n a t e
10250'
9 6 6 0 .0
LAGOS
Fu rs e n k o i n a p u n c ta ta
H a n z a w a i a c o n c e n tri c a
P o ro e p o n i d e s l a te ra l i s
Q u i n q u e l o c u l i n a l a m a rc k i a n a
E arly M i oc en e
10000'
9 6 6 0 .0
Spor e
(5 m m = 3 c o u n t s )
A m m o n i a b e c c a ri i
E p i s to m i n e l l a v i tre a
E p o n i d e s c f. i o j i m a e n s i s
9 6 6 0 .0
9750'
Pollen
A b s o lu te a b u n d a n c e
P 62 0
0
P 600
Deep
Induction
0 .2
( o h m m / m ) 2 00
P eri o d/ E poc hC hron os trati grap hy
DEPT. OF GEOLOGY, EKITI STATE UNIVERSITY, ADO EKITI, NIGERIA
Li th ol o gy
De pth (ft)
Gam( Am
a Log1 5 0
P I)
0
GE R M E RA AD et al . ( 196 8)
: 1:5000
Char t date : 18 August 2014
E c h it ri c olp orit e s s pino s us z on e Zon e
Scale
CRYSTAL AGE LIMITED
KR-1
PALYNOMORPH DISTRIBUTION CHART OF KR-1
N o n i o n e l l a a u ri s
U v i g e ri n a s u b p e re g ri n a
Fl o ri l u s e x .g r.c o s ti fe ru m
Well Code : KR-1-P
Inter val
: 9660' - 10920'
S a mp l e d e p th
Well Name : KR-1
Fl o ri l u s b o u e a n u m
Fl o r i l u s s p p .
L e n ti c u l i n a g ra n d i s
11
6
4
1
2
1
180
30
14
10
TD
Rar e ( 2 )
Com m on ( 5 )
Abundant ( 15 )
+
Super Abundant ( 50 )
Pr esent out side count
Te x t Ke y s
*1
Sem i- quant ti at v
i e, ( Def ault Abundance Schem e)
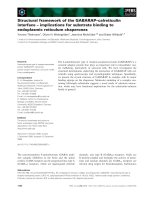
Figure 4. Chart of recovered (a) palynomorph and (b) foraminiferal assemblages from the investigated intervals from KR-1
well, Niger Delta (Adebayo et al., 2015b).
of coeval tropical-subtropical South American and
Asian palynological assemblages (Graham, 1977; Kogbe
and Sowunmi, 1980; Demchuk and Moore, 1993). This
palynofloral association, the acme (or highest appearance
datum, HAD) of some of the few recovered dinoflagellate
cysts (Lingulodinium machaerophorum, Polysphaeridium
zoharyi, Hystrichokopoma rigaudiase) among the taxa
found in the rocks of Miocene age (El-Beialy et al., 2005),
and the absence of Eocene and Oligocene forms such as
Crassoretitriletes vanraadshooveni, Bombacacidites sp.,
578
Operculodinium xanthium, and Thalassiphora pelagica
support the assignment of Early Miocene age.
4.3. Paleoenvironment of deposition
The reconstruction of the depositional environment of
the studied well is based on some parameters such as
palynomorph assemblage, abundance, diversity, and
frequency distribution, as well as the relative abundance of
Zonocostites ramonae to Monoporites annulatus, freshwater
algae, organic wall microplanktons, lithologic characters,
and accessory mineral contents. Environmentally
ADEBAYO et al. / Turkish J Earth Sci
Figure 5. Plates of recovered palynomorphs from the investigated intervals from the KR-1 well (1000×). 1.
Laevigatosporites sp.; 2. Botryococcus braunii Kützing, 1849; 3. Pachydermitesdiederixi Germeraad, Hopping
& Muller, 1968; 4. Verrucatosporites sp.; 5. Palaeocystodinum sp.; 6. Monoporites annulatus van der Hammen,
1954; 7. Sapotaceae; 8. Psilatricolporites crassus van der Hammen & Wijmstra 1964; 9. Retitricolporites
irregularis van der Hammen & Wijmstra, 1964; 10. charred Gramineae; 11. microforaminiferal wall lining.
important marker species such as Zonocostites ramonae
(mangrove pollen), Monoporites annulatus (Poaceae pollen
suggesting open vegetation found in coastal Savannah),
Magnastriatites howardi (a small aquatic fern of alluvial
plain and coastal swamps), Pachydermites diederixi (an
angiosperm of coastal swamps), foraminiferal wall linings,
and dinocysts are recovered. Lithologically, glauconite and
pyrite are the most important accessory minerals in the
studied well that can be used for environmental deductions.
Glauconite forms only as an authigenic mineral during
the early stage of the diagenesis of marine sediments. It is
extremely susceptible to subaerial weathering and is not
known as a reworked second cycle detrital mineral (Selley,
1976). The presence of glauconite in the sandy shales
therefore indicates a marine origin. On the other hand,
rare occurrence of pyrite in the shale bodies probably
suggests a reducing condition during deposition.
The studied sequence can be categorized into three
sections based on significant changes in the occurrence
of the recovered taxa (Figure 4). The lowermost section,
which lies between depths of 10,920 and 10,560 ft,
constituted a paleoecological zone. It is characterized
by the appreciable occurrence of organic wall
microplanktons such as foraminiferal wall linings and
dinocysts (Palaeocystodinum spp.), uphole decrease in the
population of Monoporites annulatus, rare occurrence of
Botryococcus braunii, and the paucity of fresh water forms
represented by Pediastrum (Figures 4 and 5). This section
is assigned to a marginal marine environment (Sarjeant,
1974; Durugbo, 2013). The depth between 10,560 and
9930 ft belongs to a continental-mangrove environment
based on the dominance of terrestrially derived taxa
(Psiltricolporites crassus and Pachydermites diederixi),
the acme of Zonocostites ramonae, and the absence or
rarity of microplanktons. The topmost section, which lies
between 9930 and 9750 ft, is a mixed environment that
ranges from back-mangrove to brackish water swamp to
marshes. Though this section of the well is dominated
by Botryococcus braunii and Zonocostites ramonae, the
significant presence of Psilatricolporites crassus and
Acrotichum aureum (similar to Deltoidospora adriennis)
(Figures 4 and 5) and the occurrence of microplanktons
enable the suggestion of back-mangrove-brackish water
swamp-marshes (Tomlinson, 1986; Thanikaimoni, 1987).
4.4. Trace element/Al ratios and enrichments
The enrichment factor (EF) for an individual element is
equal to (element/Al)sample / (element/Al) shale, where the
579
ADEBAYO et al. / Turkish J Earth Sci
ratio in the numerator is that for the shale in question and
the ratio in the denominator is that for a “typical” shale
(using data from Wedepohl, 1971, 1991). Any relative
enrichment is then expressed by EF > 1, whereas depletion
elements have EF < 1. This approach has been used by
various authors to evaluate trace-element enrichments in
modern and ancient sediments (e.g., Calvert and Pedersen,
1993; Arnaboldi and Meyers, 2003; Rimmer, 2004;
Brumsack, 2006). Generally, comparisons of V/Al ratios in
the Agbada Formation samples with world average shale
(Wedepohl, 1971) show high enrichment factors (EFV =
5.74–1.15) at some depth intervals such as 9660–9750 ft,
9750–9840 ft, 9840–9930 ft, and 9930–10,020 ft (Table
1). In contrast, other investigated intervals were marked
by low enrichment factors (EFV = 0.40–0.05). Compared
with average shale, Mo/Al ratios in the studied Agbada
Formation samples show high enrichment factors (EFMo
= 115.45–5.56) in all the investigated depth intervals. The
observed variability in Mo/Al and V/Al ratios in the studied
Agbada Formation samples are indicative of a mixed
environment of deposition (i.e. paralic setting). Compared
with world average shale, Ni/Al ratios in the Agbada
Formation samples show high enrichment factors (EFNi
= 5.21–1.21) at 9660–9750 ft, 9750–9840 ft, 9840–9930 ft,
and 9930–10,020 ft depth intervals (Table 1). Alternatively,
other investigated depth intervals show low enrichment
factors (EFNi = 0.81–0.27). In comparison with the world
average shale, Co/Al ratios in the studied samples show
high enrichment factors (EFCo = 14.56–1.64). Variability in
the enrichment of Ni/Al and Co/Al ratios in the Agbada
Formation samples indicate a mixed environment of
deposition. U/Al ratios compared with average shale show
high enrichment factors (EFU = 5.28–1.11) in samples
taken at depth intervals such as 9660–9750 ft, 9750–9840
ft, 9840–9930 ft, 9930–10,020 ft, 10,650–10,740 ft, 10,740–
10,830 ft, and 10,830–10,920 ft (Table 1). Conversely,
other investigated depth intervals show low enrichment
factors (EFU = 0.82–0.20). Compared with average shale,
Cr/Al ratios show high enrichment factors (EFCr = 12.16–
0.52), with the exception of the sample taken at the depth
interval of 10,020-10,110 ft. Lower U/Al and Cr/Al ratios
imply oxic bottom water conditions during deposition.
Compared with world average shale, Sr/Al ratios in the
Agbada Formation samples show high enrichment factors
(EFSr = 4.60–1.01) at 10,650–10,740 ft, 10,740–10,830 ft,
10,830–10,920 ft, 9840–9930 ft, and 9930–10,020 ft depth
intervals. Conversely, low enrichment factors (EFSr = 0.99–
0.19) were observed in other investigated depth intervals.
Ba/Al ratios in the studied samples compared with world
average shale show high enrichment factors (EFBa = 54.71–
1.31) in all the investigated depth intervals. Furthermore,
a relatively high enrichment of Ba/Al and Sr/Al ratios
suggest well-oxygenated bottom water conditions during
580
deposition. The Cu/Al ratios in Agbada Formation samples
compared with world average shale show high enrichment
factors (EFCu = 6.97–1.64) at 10,380–10,470 ft, 10,650–
10,740 ft, 10,740–10,380 ft, 10,380–10,920 ft, 9660–9750
ft, 9750–9840 ft, 9840–9930 ft, and 9930–10,020 ft depth
intervals. Other investigated depth intervals show low
enrichment factors (EFCu = 0.95–0.38). Zn/Al ratios in
the studied samples compared with world average shale
show high enrichment factors (EFZn = 12.92–0.79) with
the exception of the sample taken at the 10020–10110 ft
depth interval. Compared with world average shale, Pb/
Al ratios for all samples show high enrichment factors
(EFPb = 18.35–0.80), with the exception of samples taken
at 10,020–10,110 ft and 10,200–10,290 ft depth intervals.
Going by the world average shale standard, Rb/Al ratios
show evidence of low enrichment factors (EFRb = 3.34–0.10)
with the exception of the sample taken at the 9660–9750
ft depth interval. Similarly, compared with world average
shale, the Y/Al ratios in Agbada Formation samples show
low enrichment factors (EFY = 4.38–1.04). Alternatively,
low enrichment factors (EFY = 0.98–0.09) were obtained in
samples taken at 9660–9750 ft, 9840–9930 ft, 9930–10,020
ft, 10,650–10,740 ft, and 10,740–10,830 ft depth intervals.
Zr/Al ratios in Agbada Formation samples compared
with world average shale show high enrichment factors
(EFZr = 11.42–0.92), with the exception of the sample
taken at the 10,020–10,110 ft depth interval. The studied
Agbada Formation samples exhibit different degrees of
trace-element enrichment, with the approximate order of
enrichment relative to world average shale as follows: Mo
> Ba > Pb > Cr > Co > Zn > Zr > Cu > V > U > Ni > Sr > Rb.
4.5. Provenance and paleoredox conditions
Armstrong-Altrin et al. (2004) revealed that low contents
of Cr imply a felsic provenance, and high levels of Cr
and Ni are essentially found in sediments derived from
ultramafic rocks. Nickel concentrations are lower in the
Agbada Formation sediments compared with world
average shale (WSA) (Table 2), but chromium shows
higher contents. Accordingly, the low Cr/Ni ratios in
Agbada Formation samples are between 1.32 and 10.93.
This indicates that felsic components were the major
components among the basement complex source rocks.
Some authors showed that ratios such as La/Sc, Th/Sc, Th/
Co, and Th/Cr are significantly different in felsic and basic
rocks and may possibly allow constraints on the average
provenance composition (Wronkiewicz and Condie,
1990; Cullers, 1994, 1995, 2000; Cox et al., 1995; Cullers
and Podkovyrov, 2000; Nagarajan et al., 2007). The ratios
of Th/Cr (~0.03–0.09; average = ~0.05), Cr/Th (~10.70–
30.64; average = ~20.37), Th/Co (~0.01–0.48; average =
~0.25), and Cr/Ni (~1.32–10.93; average = ~5.13) (Table
3) imply that the Agbada Formation sediments recovered
from the KR-1 well were derived from felsic source
ADEBAYO et al. / Turkish J Earth Sci
Table 1. Trace element ratios and enrichments in the Agbada Formation Sediments compared to world average shale (WSA) (Wedepohl,
1971).
Element
WSA
Ni (ppm)
(Ni/Al)*104
EF
Co (ppm)
(Co/Al)*104
EF
Cu (ppm)
(Cu/Al)*104
EF
Zn (ppm)
(Zn/Al)*104
EF
V (ppm)
(V/Al)*104
EF
Cr (ppm)
(Cr/Al)*104
EF
Ba (ppm)
(Ba/Al)*104
EF
68
7.7
19
2.1
45
5.1
95
11
130
15
90
10.2
580
66
9660–
9750 ft
46.25
40.15
5.21
35.22
30.57
14.56
40.97
35.56
6.97
163.73
142.12
12.92
99.13
86.05
5.74
142.85
124.00
12.16
896.83
778.49
11.80
9750–
9840 ft
32.92
9.73
1.26
125.82
37.17
17.70
32.68
9.65
1.89
170.23
50.29
4.57
57.92
17.11
1.14
150.93
44.59
4.37
1063.47
314.17
4.76
9840–
9930 ft
30.60
10.89
1.41
51.60
18.36
8.74
23.53
8.37
1.64
196.74
70.02
6.37
66.57
23.69
1.58
135.35
48.17
4.72
515.00
183.29
2.78
9930–
10,020 ft
36.28
9.99
1.30
53.42
14.71
7.01
37.58
10.35
2.03
280.27
77.21
7.02
74.24
20.45
1.36
196.18
54.04
5.30
556.06
153.18
2.32
10,020–
10,110 ft
18.17
2.04
0.27
149.73
16.85
8.02
17.07
1.92
0.38
77.06
8.67
0.79
25.74
2.90
0.19
46.71
5.26
0.52
766.98
86.30
1.31
10,110–
10,200 ft
23.77
2.85
0.37
104.40
12.52
5.96
29.29
3.51
0.69
165.94
19.90
1.81
50.14
6.01
0.40
100.47
12.05
1.18
3455.12
414.36
6.28
10,020–
10,110 ft
14.02
1.58
0.10
57.11
6.43
0.19
147.83
16.63
0.92
17.70
1.99
0.80
0.76
0.09
0.20
4.94
0.56
5.56
3.60
0.41
0.09
10,110–
10,200 ft
32.27
3.87
0.24
150.23
18.02
0.53
250.34
30.02
1.67
21.82
2.62
1.05
1.59
0.19
0.45
5.69
0.68
6.82
10.82
1.30
0.28
10,200–
10,290 ft
25.40
3.11
0.19
87.92
10.77
0.32
179.02
21.93
1.22
18.74
2.30
0.92
1.20
0.15
0.35
4.70
0.58
5.76
8.67
1.06
0.23
Table 1. (Continued).
Element
WSA
Rb (ppm)
(Rb/Al)*104
EF
Sr (ppm)
(Sr/Al)*104
EF
Zr (ppm)
(Zr/Al)*104
EF
Pb (ppm)
(Pb/Al)*104
EF
U (ppm)
(U/Al)*104
EF
Mo (ppm)
(Mo/Al)*104
EF
Y (ppm)
(Y/Al)*104
EF
140
16
300
34
160
18
22
2.5
3.7
0.42
1
0.1
41
4.6
9660–
9750 ft
61.60
53.47
3.34
180.24
156.45
4.60
236.75
205.51
11.42
23.48
20.38
8.15
2.56
2.22
5.28
13.30
11.55
115.45
23.22
20.15
4.38
9750–
9840 ft
31.90
9.42
0.59
114.33
33.77
0.99
185.52
54.81
3.04
15.96
4.71
1.89
1.78
0.52
1.25
10.68
3.16
31.55
13.12
3.87
0.84
9840–
9930 ft
36.73
13.07
0.82
113.34
40.34
1.19
195.99
69.75
3.88
23.69
8.43
3.37
1.96
0.70
1.66
7.77
2.76
27.64
15.40
5.48
1.19
9930–
10,020 ft
41.58
11.45
0.72
124.33
34.25
1.01
208.18
57.35
3.19
35.42
9.76
3.90
2.07
0.57
1.35
12.86
3.54
35.41
17.38
4.79
1.04
581
ADEBAYO et al. / Turkish J Earth Sci
Table 1. (Continued).
Element
WSA
Ni (ppm)
(Ni/Al)*104
EF
Co (ppm)
(Co/Al)*104
EF
Cu (ppm)
(Cu/Al)*104
EF
Zn (ppm)
(Zn/Al)*104
EF
V (ppm)
(V/Al)*104
EF
Cr (ppm)
(Cr/Al)*104
EF
Ba (ppm)
(Ba/Al)*104
EF
68
7.7
0.59
19
2.1
45
5.1
95
11
130
15
90
10.2
580
66
10,290–
10,380 ft
36.60
4.52
0.59
59.08
7.30
3.48
39.01
4.82
0.95
184.82
22.85
2.08
55.22
0.68
0.05
168.83
20.87
2.05
1248.17
154.31
2.34
10,380–
10,470 ft
52.90
6.23
0.81
30.04
3.54
1.69
72.07
8.49
1.67
336.85
39.69
3.61
107.15
1.26
0.08
282.78
33.32
3.27
1150.91
135.61
2.05
10,470–
10,560 ft
41.83
4.96
0.64
29.01
3.44
1.64
32.86
3.90
0.76
354.01
42.01
3.82
98.92
1.17
0.08
456.95
54.23
5.32
4258.03
505.35
7.66
10,560–
10,650 ft
41.82
5.04
0.65
30.34
3.66
1.74
38.02
4.58
0.90
218.42
26.32
2.39
95.68
1.15
0.08
316.78
38.18
3.74
4015.67
483.96
7.33
10,650–
10,740 ft
39.77
9.68
1.26
47.51
11.57
5.51
34.75
8.46
1.66
263.23
64.09
5.83
93.75
2.28
0.15
278.54
67.81
6.65
3826.19
931.54
14.11
10,740–
10,830 ft
57.15
10.93
1.42
31.11
5.95
2.83
75.20
14.39
2.82
374.79
71.71
6.52
105.60
2.02
0.13
413.02
79.02
7.75
18,872.96
3610.98
54.71
10,830–
10,920 ft
54.48
9.32
1.21
29.66
5.07
2.42
54.90
9.39
1.84
222.20
38.02
3.46
103.66
1.77
0.12
193.70
33.14
3.25
5193.40
888.61
13.46
10,290–
10,380 ft
35.49
4.39
0.27
124.35
15.37
0.45
168.12
20.78
1.15
23.92
2.96
1.18
1.51
0.19
0.45
9.84
1.22
12.16
12.09
1.49
0.32
10,380–
10,470 ft
63.37
7.47
0.47
236.67
27.89
0.82
288.00
33.93
1.89
42.81
5.04
2.02
2.87
0.34
0.81
12.28
1.45
14.47
29.33
3.46
0.75
10,470–
10,560 ft
64.55
7.66
0.48
249.57
29.62
0.87
310.47
36.85
2.05
37.66
4.47
1.79
2.90
0.34
0.82
6.18
0.73
7.33
25.78
3.06
0.67
10,560–
10,650 ft
64.09
7.72
0.48
217.20
26.18
0.77
264.10
31.83
1.77
46.27
5.58
2.23
2.69
0.32
0.77
5.44
0.66
6.56
25.26
3.04
0.66
10,650–
10,740 ft
60.71
14.78
0.92
200.15
48.73
1.43
302.52
73.65
4.09
37.02
9.01
3.61
2.60
0.63
1.50
4.32
1.05
10.51
24.02
5.85
1.27
10,740–
10,830 ft
61.74
11.81
0.74
524.14
100.28
2.95
229.66
43.94
2.44
95.92
18.35
7.34
2.52
0.48
1.15
30.54
5.84
58.42
24.95
4.77
1.04
10,830–
10,920 ft
59.05
10.10
0.63
260.04
44.49
1.31
278.13
47.59
2.64
43.54
7.45
2.98
2.73
0.47
1.11
26.61
4.55
45.52
26.35
4.51
0.98
Table 1. (Continued).
Element
WSA
Rb (ppm)
(Rb/Al)*104
EF
Sr (ppm)
(Sr/Al)*104
EF
Zr (ppm)
(Zr/Al)*104
EF
Pb (ppm)
(Pb/Al)*104
EF
U (ppm)
(U/Al)*104
EF
Mo (ppm)
(Mo/Al)*104
EF
Y (ppm)
(Y/Al)*104
EF
140
16
582
300
34
160
18
22
2.5
3.7
0.42
1
0.1
41
4.6
ADEBAYO et al. / Turkish J Earth Sci
Table 2. Major element (wt. %) and trace element (mg/kg) abundances of Agbada Formation sediments and world shale average (WSA).
nd: Not determined.
Element
Al2O3
CaO Cr2O3 Fe2O3
K2O
MgO
MnO
Na2O
P2O5
SiO2
TiO2
LOI
Total As
93.44 10
WSA
16.7
2.20 nd
6.90
3.60
2.60
nd
1.60
0.16
58.90
0.78
nd
9660–9750 ft
15.68
1.51 0.02
7.31
1.59
1.16
0.05
0.55
0.22
58.80
0.95
10.93 98.76 nd
Ni
68
46.25
9750–9840 ft
7.76
1.12 0.02
4.40
0.91
0.76
0.03
0.30
0.13
76.21
0.50
7.52
99.66 nd
32.92
9840–9930 ft
9.87
0.87 0.02
4.40
0.99
0.79
0.03
0.36
0.12
73.20
0.61
8.23
99.50 nd
30.60
9930–10,020 ft
11.04
1.22 0.03
5.35
1.16
0.91
0.04
0.46
0.12
68.23
0.69
9.42
98.68 nd
36.28
10,020–10,110 ft
2.18
0.42 0.01
1.50
0.47
0.30
0.01
0.11
0.03
92.02
0.19
2.40
99.63 nd
18.17
10,110–10,200 ft
6.40
1.35 0.01
3.10
1.00
0.79
0.02
0.29
0.07
78.07
0.47
6.64
98.21 nd
23.77
10,200–10,290 ft
5.31
0.82 0.01
2.57
0.80
0.53
0.02
0.23
0.07
82.41
0.35
6.21
99.32 nd
19.77
10,290–10,380 ft
6.86
1.45 0.03
4.55
1.05
0.82
0.03
0.31
0.11
74.69
0.43
8.31
98.63 nd
36.60
10,380–10,470 ft
15.92
2.51 0.02
8.73
1.61
1.25
0.06
0.60
0.19
48.78
0.89
16.48 97.04 nd
52.90
10,470–10,560 ft
16.79
3.03 0.04
8.53
1.66
1.49
0.07
0.66
0.27
48.36
1.00
15.58 97.49 nd
41.83
10,560–10,650 ft
15.75
2.37 0.06
6.78
1.72
1.37
0.04
0.67
0.17
50.52
0.94
17.13 97.52 nd
41.82
10,650–10,740 ft
15.42
1.37 0.04
6.72
1.69
1.25
0.04
0.56
0.16
57.58
0.86
12.46 98.15 nd
39.77
10,740–10,830 ft
15.28
1.18 0.04
5.88
1.65
1.05
0.04
0.56
0.14
60.31
0.90
11.51 98.52 nd
57.15
10,830–10,920 ft
16.03
3.06 0.03
8.73
1.72
1.31
0.06
0.55
0.19
47.04
0.87
13.19 92.79 nd
54.48
Element
Mn
U
Mo
V
Cr
Co
Ba
Sr
Y
Zr
La
Rb
Cu
Zn
Pb
WSA
850
3.7
1
130
90
19
580
300
41
160
41
140
45
95
22
9660–9750 ft
75.59
2.56 13.30 99.13
142.85 35.22
896.83
180.24 23.22 236.75 51.28 61.60 40.97 163.73 23.48
9750–9840 ft
144.61
1.78 10.68 57.92
150.93 125.82 1063.47
114.33 13.12 185.52 27.96 31.90 32.68 170.23 15.96
9840–9930 ft
145.28
1.96 7.77
66.57
135.35 51.60
515.00
113.34 15.40 195.99 33.75 36.73 23.53 196.74 23.69
9930–10,020 ft
213.04
2.07 12.86 74.24
196.18 53.42
556.06
124.33 17.38 208.18 37.37 41.58 37.58 280.27 35.42
10,020–10,110 ft
523.07
0.76 4.94
25.74
46.71
10,110–10,200 ft
320.91
1.59 5.69
50.14
100.47 104.40 3455.12
150.23 10.82 250.34 24.10 32.27 29.29 165.94 21.82
10,200–10,290 ft
271.2
1.20 4.70
42.55
98.93
87.92
55.22
149.73 766.98
89.31
979.62
57.11
3.60
8.67
147.83 7.41
14.02 17.07 77.06
17.70
179.02 17.73 25.40 18.18 106.12 18.74
10,290–10,380 ft
274.14
1.51 9.84
168.83 59.08
1248.17
124.35 12.09 168.12 24.63 35.49 39.01 184.82 23.92
10,380–10,470 ft
470.64
2.87 12.28 107.15 282.78 30.04
1150.91
236.67 29.33 288.00 58.20 63.37 72.07 336.85 42.81
10,470–10,560 ft
452.8
2.90 6.18
98.92
456.95 29.01
4258.03
249.57 25.78 310.47 53.40 64.55 32.86 354.01 37.66
10,560–10,650 ft
413.91
2.69 5.44
95.68
316.78 30.34
4015.67
217.20 25.26 264.10 51.78 64.09 38.02 218.42 46.27
10,650–10,740 ft
232.35
2.60 4.32
93.75
278.54 47.51
3826.19
200.15 24.02 302.52 50.51 60.71 34.75 263.23 37.02
10,740–10,830 ft
213.23
2.52 30.54 105.60 413.02 31.11
18872.96 524.14 24.95 229.66 50.08 61.74 75.20 374.79 95.92
10,830–10,920 ft
280.62
2.73 26.61 103.66 193.70 29.66
5193.40
rocks. Rare earth element mobilization can occur during
chemical weathering of bedrock, and source bedrock REE
signatures are preserved in the weathering profile because
there is no net loss of REE abundance (Condie et al., 1991;
Cullers et al., 2000; Kutterolf et al., 2008). Therefore, REE
ratios such as La/Yb, Gd/Yb, La/Sm, and Eu/Eu*(where
Eu* = europium anomalies) of sediments are considered
to be similar to provenance and are usually used to
determine bulk source composition (Kutterolf et al., 2008;
Dabard and Loi, 2012). REE patterns and Th data of the
260.04 26.35 278.13 50.81 59.05 54.90 222.20 43.54
investigated Agbada Formation sediments indicate the
felsic composition of source rocks.
Trace element ratios like Ni/Co, V/Cr, Cu/Zn, and U/
Th were used to evaluate paleoredox conditions (Hallberg,
1976; Jones and Manning, 1994). The ratio of uranium
to thorium may be used as a redox indicator with the U/
Th ratio being higher in organic-rich mudstones (Jones
and Manning, 1994). U/Th ratios below 1.25 suggest
oxic conditions of deposition, whereas values above 1.25
indicate suboxic and anoxic conditions (Dill et al., 1988;
583
ADEBAYO et al. / Turkish J Earth Sci
Table 3. Trace and rare earth element ratios of the studied Agbada Formation sediments.
Sample name
Ni/Co
V/Cr
U/Th
Cr/Ni
V/Sc
La/Sc
La/Yb
Gd/Yb
La/Th
La/Sm
Th/Yb
9660–9750 ft
1.31
0.69
0.19
3.09
5.80
3.00
22.69
3.07
3.84
6.13
5.91
9750–9840 ft
0.26
0.38
0.23
4.58
3.92
1.89
21.13
2.84
3.62
6.23
5.83
9840–9930 ft
0.59
0.49
0.21
4.42
4.27
2.17
21.22
2.82
3.71
6.55
5.72
9930–10,020 ft
0.68
0.38
0.20
5.41
4.74
2.39
21.54
2.82
3.59
6.12
5.99
10,020–10,110 ft
0.12
0.55
0.33
2.57
1.98
0.57
13.81
1.96
3.17
6.31
4.35
10,110–10,200 ft
0.23
0.50
0.23
4.23
3.61
1.73
19.56
2.54
3.49
6.27
5.60
10,200–10,290 ft
0.22
0.43
0.26
5.00
3.18
1.32
20.27
2.74
3.77
6.62
5.37
10,290–10,380 ft
0.62
0.33
0.22
4.61
4.01
1.79
19.23
2.76
3.55
5.68
5.42
10,830–10,920 ft
1.76
0.38
0.19
5.35
6.45
3.51
20.07
2.87
3.84
5.83
5.23
10,380–10,470 ft
1.44
0.22
0.19
10.93
6.30
3.40
20.34
2.78
3.58
6.13
5.68
10,470–10,560 ft
1.38
0.30
0.18
7.57
5.90
3.19
19.46
2.81
3.55
5.80
5.48
10,560–10,650 ft
0.84
0.34
0.18
7.00
5.61
3.02
19.65
2.58
3.53
6.03
5.57
10,650–10,740 ft
1.84
0.26
0.18
7.23
6.72
3.19
21.31
3.07
3.56
5.73
5.99
10,740–10,830 ft
1.84
0.54
0.19
3.56
6.48
3.18
19.58
2.83
3.62
5.68
5.41
Minimum
0.12
0.22
0.18
2.57
1.98
0.57
13.81
1.96
3.17
5.68
4.35
Maximum
1.84
0.69
0.33
10.93
6.72
3.51
22.69
3.07
3.84
6.62
5.99
Average
0.94
0.41
0.21
5.40
4.93
2.45
19.99
2.75
3.60
6.08
5.54
Standart deviation
0.64
0.13
0.04
2.18
1.46
0.90
2.04
0.27
0.17
0.30
0.42
Table 3. (Continued).
Sample name
Th/U
U/Pb
Eu/Eu*
V/Ni
Cr/Th
Th/Co
Th/Cr
Cu/Zn
Th/Sc
V/(Ni+V)
9660–9750 ft
5.23
0.11
0.72
2.14
10.70
0.38
0.09
0.25
0.78
0.68
9750–9840 ft
4.35
0.11
0.67
1.76
19.56
0.06
0.05
0.19
0.52
0.64
9840–9930 ft
4.65
0.08
0.68
2.18
14.87
0.18
0.07
0.12
0.58
0.69
9930–10,020 ft
5.03
0.06
0.71
2.05
18.87
0.19
0.05
0.13
0.66
0.67
10,020–10,110 ft
3.07
0.04
0.78
1.42
20.00
0.02
0.05
0.22
0.18
0.59
10,110–10,200 ft
4.34
0.07
0.78
2.11
14.56
0.07
0.07
0.18
0.50
0.68
10,200–10,290 ft
3.91
0.06
0.72
2.15
21.05
0.05
0.05
0.17
0.35
0.68
10,290–10,380 ft
4.58
0.06
0.73
1.51
24.34
0.12
0.04
0.21
0.50
0.60
10,830–10,920 ft
5.28
0.07
0.68
2.03
18.65
0.50
0.05
0.21
0.91
0.67
10,380–10,470 ft
5.14
0.08
0.70
2.37
30.64
0.51
0.03
0.09
0.95
0.70
10,470–10,560 ft
5.43
0.06
0.71
2.29
21.74
0.48
0.05
0.17
0.90
0.70
10,560–10,650 ft
5.51
0.07
0.73
2.36
19.47
0.30
0.05
0.13
0.86
0.70
10,650–10,740 ft
5.59
0.03
0.87
1.85
29.32
0.45
0.03
0.20
0.90
0.65
10,740–10,830 ft
5.15
0.06
0.71
1.90
13.80
0.47
0.07
0.25
0.88
0.66
Minimum
3.07
0.03
0.67
1.42
10.70
0.02
0.03
0.09
0.18
0.59
Maximum
5.59
0.11
0.87
2.37
30.64
0.51
0.09
0.25
0.95
0.70
Average
4.80
0.07
0.73
2.01
19.83
0.27
0.05
0.18
0.68
0.66
Standart deviation
0.71
0.02
0.05
0.29
5.60
0.19
0.02
0.05
0.24
0.04
584
ADEBAYO et al. / Turkish J Earth Sci
Nath et al., 1997; Jones and Manning, 1994). The studied
sediments show low U/Th ratios (~0.18–0.33; average
= 0.21) (Tables 3 and 4), which imply that the Agbada
Formation sediments were deposited in an oxygenated
bottom water condition. Th/U ratios in the sediments
range between ~5.59 and 3.07 with an average value of
~4.80, which indicates oxidizing conditions. Th/U ratios
are high in oxidizing conditions and low in reducing
conditions (Kimura and Watanabe, 2001).
A few authors have used the V/Cr ratio as an indicator
of bottom water oxygenated condition (Bjorlykke, 1974;
Shaw et al., 1990; Nagarajan et al., 2007). Chromium is
mainly incorporated in the detrital fraction of sediments
and it may substitute for Al in the structure of clays
(Bjorlykke, 1974). Vanadium may be bound to organic
matter by the amalgamation of V4+ into porphyrins, and
it is normally found in sediments deposited in reducing
environments (Shaw et al., 1990; Kimura and Watanabe,
2001). V/Cr ratios above 2 indicate anoxic conditions,
whereas values below 2 imply oxic conditions (Jones and
Manning, 1994). The V/Cr ratios in Agbada Formation
sediments range from ~0.22 to 0.69, with an average
value of ~0.41 (Tables 3 and 4), which indicates that
Agbada Formation sediments were deposited in an oxic
depositional condition. Numerous authors have used
the Ni/Co ratio as a redox indicator (Bjorlykke, 1974;
Brumsack, 2006; Nagarajan et al., 2007). Ni/Co ratios
below 5 indicate oxic environments, whereas ratios above
5 suggest suboxic and anoxic environments (Jones and
Manning, 1994). The Ni/Co ratios vary between ~0.12 and
3.58 with an average value of ~1.11 (Table 2), implying
that Agbada Formation sediments were deposited in a
well-oxygenated bottom water condition. The Cu/Zn ratio
is also used as a redox parameter (Hallberg, 1976). High
Cu/Zn ratios indicate reducing depositional conditions,
while low Cu/Zn ratios suggest oxidizing conditions
(Hallberg, 1976). Consequently, the low Cu/Zn ratios vary
between ~0.05 and 0.22 with an average value of ~0.17 in
the studied Agbada Formation sediments (Tables 3 and
4), suggesting sediment deposition under oxic conditions.
V/(Ni+V) ratios below 0.46 indicate oxic environments,
but ratios above 0.54 to 0.82 suggest suboxic and anoxic
environments (Hatch and Levanthal, 1992). The V/(Ni +
V) ratios in the Agbada Formation sediments encountered
at the KR-1 well vary between ~0.59 and 0.70 with an
average value of ~0.66, which suggests that there might
be rare occurrence of suboxic to anoxic environments
of deposition. V/Sc ratios below 9.1 indicate an oxic
environment of deposition (Hetzel et al., 2009). The V/Sc
ratios in the Agbada Formation sediments vary between
~1.98 and 6.72 with an average value of ~4.93, which
indicates an oxic environment of deposition (Tables 3
and 4). Based on REE studies of the early Cretaceous
sediments, numerous geoscientists convincingly argued
that the REE patterns (including Eu* anomalies), though
mostly dependent on their provenance, can also be
controlled by fO2 and sedimentary environment (Ganai
and Rashid, 2015). They observed that when fO2 is low (a
reducing environment), the sediments deposited should be
characterized by low REE values and a positive europium
anomaly (Eu*), whereas sediments deposited in oxidizing
conditions (i.e. fO2 is high) should be characterized by high
total REE and Eu depletion (Ganai and Rashid, 2015). As
a result, it appears that the Agbada Formation sediments
recovered from the KR-1 well, which are characterized
by high total REEs and strong negative Eu anomaly, were
deposited in an oxidizing environment.
4.6. Rare earth element geochemistry
A comparison of the REE contents in this study and a
number of works on the behavior of REEs in secondary
environments is shown in Table 5. Standards that are
normally used include the world shale average (WSA),
as calculated by Piper (1974) from published analyses
(Haskin and Haskin, 1964; Wedepohl, 1995); the
North American Shale Composite (NASC), analyzed
by Gromet et al. (1984); the Upper Continental Crust
(UCC), with several slightly different values reported by
several authors (e.g., Wedepohl, 1969–1978; McLennan,
Table 4. Some trace element ratios to evaluate paleoredox conditions.
Element ratios
Oxic
Dysoxic
Suboxic to anoxic
Ni/Co
<5
5–7
>7
V/Cr
<2
2–4.25
>4.25
<0.75
0.75–1.25
>1.25
<0.46
0.46–0.60
0.54–0.82
1
1
U/Th1
V/(Ni + V)
V/Sc3
2
>0.84
<9.1
Jones and Manning, 1994;
Adebayo et al., 2015a.
1
Euxinic
2
Hatch and Levantal, 1992; 3Akinyemi et al., 2013;
585
ADEBAYO et al. / Turkish J Earth Sci
Table 5. Comparison of normalized rare earth element (REE) contents with literature data.
Element WSA
UCC
PAAS
NASC
Aver.
9660–
chondrites 9750 ft
9750–
9840 ft
9840–
9930 ft
9930–
10,020– 10,110– 10,200–
10,020 ft 10,110 ft 10,200 ft 10,290 ft
La
41
30
38.20
31.1
0.32
51.28
27.96
33.75
37.37
7.41
24.10
17.73
Ce
83
64
79.60
66.7
0.90
107.79
58.13
69.52
76.76
17.01
50.37
38.19
Pr
10.1
7.1
8.83
7.7
0.13
11.96
6.44
7.62
8.69
1.81
5.41
4.15
Nd
38
26
33.90
27.4
0.57
45.28
24.23
28.35
32.30
5.98
20.60
15.02
Sm
75
4.5
5.55
5.59
0.21
8.37
4.49
5.16
6.11
1.18
3.84
2.68
Eu
1.61
0.88
1.08
1.18
0.07
1.81
0.90
1.07
1.27
0.28
0.88
0.60
Gd
6.35
3.8
4.66
4.9
0.31
6.93
3.76
4.49
4.89
1.05
3.13
2.40
Tb
1.23
0.64
0.77
0.85
0.05
0.90
0.52
0.55
0.64
0.16
0.42
0.28
Dy
5.5
3.5
4.68
4.17
0.30
4.99
2.85
3.35
3.81
0.73
2.30
1.68
Ho
1.34
0.8
0.99
1.02
0.07
0.90
0.53
0.63
0.71
0.15
0.49
0.33
Er
3.75
2.3
2.85
2.84
0.21
2.40
1.48
1.64
1.94
0.42
1.10
0.88
Tm
0.63
0.33
0.41
0.84
0.03
0.35
0.18
0.24
0.26
0.10
0.18
0.14
Yb
3.53
2.2
2.82
3.06
0.18
0.90
0.52
0.55
0.64
0.16
0.42
0.28
Lu
0.61
0.32
0.43
0.46
0.03
0.33
0.19
0.21
0.25
0.08
0.18
0.14
∑REE
271.65 146.37 184.773 157.81 3.393
157.094
175.6255 36.525
113.41
84.49
244.1635 132.155
Element WSA
UCC
PAAS
NASC
Aver.
10,290– 10,380– 10,470– 10,560– 10,650– 10,740– 10,830–
chondrites 10,380 ft 10,470 ft 10,560 ft 10,650 ft 10,740 ft 10,830 ft 10,920 ft
La
41
30
38.20
31.1
0.32
24.63
58.20
53.40
51.78
50.51
50.08
50.81
Ce
83
64
79.60
66.7
0.90
52.94
124.13
111.31
109.18
103.82
105.18
107.23
Pr
10.1
7.1
8.83
7.7
0.13
5.79
13.69
12.48
12.35
11.61
11.90
12.12
Nd
38
26
33.90
27.4
0.57
22.76
51.97
47.27
47.16
43.64
45.20
46.62
Sm
75
4.5
5.55
5.59
0.21
4.34
9.98
8.72
8.92
8.38
8.74
8.95
Eu
1.61
0.88
1.08
1.18
0.07
0.94
2.04
1.83
1.90
1.77
2.28
1.88
Gd
6.35
3.8
4.66
4.9
0.31
3.54
8.33
7.31
7.47
6.62
7.22
7.34
Tb
1.23
0.64
0.77
0.85
0.05
0.48
1.12
1.02
1.00
0.94
1.00
0.98
Dy
5.5
3.5
4.68
4.17
0.30
2.49
6.39
5.76
5.46
5.00
5.40
5.70
Ho
1.34
0.8
0.99
1.02
0.07
0.49
1.16
1.01
1.03
0.96
0.99
1.00
Er
3.75
2.3
2.85
2.84
0.21
1.33
3.19
2.78
2.77
2.57
2.47
2.75
Tm
0.63
0.33
0.41
0.84
0.03
0.18
0.43
0.39
0.37
0.36
0.35
0.36
Yb
3.53
2.2
2.82
3.06
0.18
0.48
1.12
1.02
1.00
0.94
1.00
0.98
Lu
0.61
0.32
0.43
0.46
0.03
0.17
0.42
0.36
0.34
0.34
0.34
0.37
∑REE
271.65 146.37 184.77
120.52
282.15
254.63
250.72
237.44
242.13
247.07
157.81 3.39
WSA (Piper, 1974); UCC (Wedepohl, 1969–1978; McLennan, 1989; Rudnick and Gao, 2003); PAAS (McLennan, 2001); NASC (Gromet
et al., 1984); average chondrites (Schmidt et al., 1963).
1989; Rudnick and Gao, 2003), but with rather similar
interelement concentrations; the Post-Archean Australian
Shale (PAAS), proposed by McLennan (2001); and finally
an average of chondrites (Schmidt et al., 1963). The
586
concentrations of the REEs in these standards represent
two compositional extremes of siliciclastic source-rocks,
one felsic (WSA, UCC, PAAS, and NASC) and the second
ultramafic (chondrites) (Piper and Bau, 2013).
ADEBAYO et al. / Turkish J Earth Sci
Table 5 shows that the concentration range of La in
Agbada Formation sediments is from ~58.20 to 7.41
ppm with an average value of ~38.50 ppm and standard
deviation of ~15.96. The average value of La in Agbada
Formation samples is lower than in WSA (Table 5) but
higher than those of other standards such UCC, PAAS,
NASC, and average chondrites.
Cerium contents in studied samples range between
~124.13 and 17.01 ppm with an average value of ~ 80.82
ppm and standard deviation of ~33.27. The average value
of Ce in the studied samples is relatively lower than
in WSA and less than that of UCC, PAAS, NASC, and
average chondrites. The concentration range of Pr in the
studied sediments is between ~13.69 and 1.81 ppm with
an average value of ~ 9.00 ppm and standard deviation of
~3.78. The average concentration value of Pr in Agbada
Formation samples is less than in WSA but higher than
those of other standards. Concentration levels of Nd
range from ~51.97 to 5.98 ppm with an average value of
~34.02 ppm and standard deviation of ~14.57. The average
concentration level of Nd is less than in WSA but higher
than those of other standards.
Concentration levels of Sm in Agbada Formation
sediments range from ~9.98 to 1.18 ppm with an
average value of ~6.42 and standard deviation of ~2.79.
Concentration levels of Eu in the studied samples range
between ~2.28 and 0.28 ppm with an average value of
~1.39 ppm and standard deviation of ~0.61. The average
concentration of Sm is less than in WSA but higher than
those of the other commonly used standards (Table 5).
The concentration levels of Gd range from ~8.33 to
1.05 ppm with an average value of ~5.32 ppm and standard
deviation of ~2.28. The average value of Gd in the studied
samples is less than in WSA but less high than those of
the other commonly used standards. The levels of Tb in
Agbada Formation sediments range between ~8.33 and
1.05 ppm with an average value of ~0.72 ppm and standard
deviation of ~0.31. The average concentration level of
Tb in studied samples is less than in WSA, PAAS, and
NASC but higher than in UCC and average chondrites.
Concentration levels of Dy in studied samples range
between ~6.39 and 0.73 ppm with an average value of
~3.99 ppm and standard deviation of ~1.77. The average
value of Dy in Agbada Formation sediments is higher than
in UCC and average chondrites but lower than in the other
considered standards. The content levels of Ho in studied
samples range from ~1.16 to 0.15 ppm with an average
value of ~ 0.74 ppm and standard deviation of ~0.31. The
average concentration value of Ho in studied samples is
less than those of all considered commonly used standards.
Concentration levels of Er range from ~3.19 to 0.42 ppm
with an average value of ~1.98 ppm and standard deviation
of 0.31. The average concentration of Er in studied samples
is higher than in average chondrites but lower than in the
other standards. Concentration levels of Tm in studied
samples range between ~0.43 and 0.10 ppm with an
average value of ~0.28 ppm and standard deviation
of ~0.11. The average concentration of Tm in studied
samples is higher than in average chondrites but lower
than in other considered standards. The contents of Yb in
Agbada Formation sediments range from ~1.12 to 0.16
ppm with an average value of ~0.72 ppm and standard
deviation of ~0.31. The average concentration of Yb in
studied samples is higher than in average chondrites but
lower than in other considered standards. Contents of
Lu in Agbada Formation sediments range from ~0.42
to 0.08 ppm with an average value of ~0.27 ppm and
standard deviation of ~0.10. The average concentration
level of Lu is higher than in average chondrites but lower
than its concentration in other considered standards.
Cerium anomaly may perhaps be quantified by
comparing the measured concentration (Ce) with an
expected concentration (Ce*) obtained by interpolating
between the values of the neighboring elements. Ce
anomalies in shales of the anoxic facies are attributed to
eustatic sea level changes (Wilde et al., 1996). Similar to
Mn, Ce4+ is less soluble under oxic conditions, whereas
under anoxic conditions it will be mobilized, leading to
the depletion in Ce in anoxic sediments relative to those
deposited under oxic conditions. A negative Ce anomaly
would be indicative of postdepositional remobilization
of Ce in the water column.
Table 6 shows two different values given for the Ce
anomaly, which are based on different calculations.
Taylor and McLennan (1985) suggested the use of
the geometric mean Ce* = √(La*Pr). The ratio Ce/
Ce* is then a measure of the anomaly, with values
greater than unity being termed positive. Wilde et al.
(1996) promoted the use of the arithmetic mean Ce* =
(La+Pr)/2 and calculated the logarithm of the ratio Ce/
Ce*. Both calculations lead to the same values as Ce*
by KR-1 well samples mostly showing positive anomaly
values. Therefore, the Agbada Formation sediments
were deposited under oxic conditions, which indicates
the incorporation of this cerium from the water
column.
5. Conclusions
Lithologically, glauconite and rare pyrite are the most
important accessory minerals in the studied well, indicating
a slightly anoxic marginal marine environment of
deposition while the palynomorph percentage distribution
shows that there are more terrestrially derived miospores
(dominated by Zonocostites ramonae, Psilatricolporites
crassus, Arostichum aurium, and Laevigatosporites sp.)
than marine phytoplanktons. These indicate that the main
587
ADEBAYO et al. / Turkish J Earth Sci
Table 6. Ce anomaly for Agbada Formation sediments (two quantification approaches are given).
Authors
Equations
9660–
9750 ft
9750–
9840 ft
9840–
9930 ft
9930–
10,020 ft
10,020–
10,110 ft
10,110–
10,200 ft
10,200–
10,290 ft
Taylor and McLennan
(1985)
Ce* = √(La*Pr)
24.76
13.42
16.04
18.02
3.66
11.42
8.57
Ce/Ce*
4.35
4.33
4.34
4.26
4.64
4.41
4.45
Ce* = (La + Pr)/2
57.26
31.18
37.56
41.71
8.32
26.80
19.80
Wilde et al. (1996)
Authors
Log (Ce/Ce*)
0.64
0.64
0.64
0.63
0.67
0.64
0.65
Equations
10,290–
10,380 ft
10,380–
10,470 ft
10,470–
10,560 ft
10,560–
10,650 ft
10,650–
10,740 ft
10,740–
10,830 ft
10,830–
10,920 ft
Ce* = √(La*Pr)
24.63
58.20
53.40
51.78
50.51
50.08
50.81
Taylor and McLennan
(1985)
Ce/Ce*
2.15
2.13
2.08
2.11
2.06
2.10
2.11
Wilde et al. (1996)
Ce* = (La + Pr)/2
36.95
87.30
80.09
77.66
75.77
75.11
76.22
Log (Ce/Ce*)
0.33
0.33
0.32
0.32
0.31
0.32
0.32
Ce* = Cerium anomaly.
environment of deposition in the KR-1 well is coastal to
marginal marine consisting of coastal deltaic-inner neritic,
made up of tidal channel and shoreface deposits (Adeigbe
et al., 2013). Geochemical results show that the average
concentrations of considered REEs are less than their
concentrations in WSA. Trace metal ratios such as Th/Cr,
Cr/Th, Th/Co, and Cr/Ni suggest that the sediments were
derived from felsic source rocks. REE patterns such as La/
Yb, Gd/Yb, La/Sm, and Eu/Eu* and Th data confirmed the
felsic composition of the sediments. Ratios of U/Th, Ni/
Co, Cu/Zn, and V/Sc indicate well-oxygenated bottom
water conditions. Estimated Eu* and Ce* anomalies
obtained from the studied samples suggest an oxidizing
environment of deposition. Nonetheless, the ratios of V/
Cr suggest a range of environmental conditions. Moreover,
ratios of V/(Ni+V) suggest rare suboxic to anoxic
environments of deposition.
Acknowledgments
The authors sincerely acknowledge the technical assistance
of the final-year students who participated in the fieldwork
(Sedimentary/Petroleum Geology Option 2012/2013
and 2014/2015 academic sessions). The authors would
also like to acknowledge Ms Riana Rossouw, LA-ICPMS laboratory of the University of Stellenbosch, for
multielement analysis.
References
Adebayo OF (2011). Biostratigraphy, Sequence Stratigraphic Analysis
of Three Offshore Wells from the Niger Delta, Nigeria. PhD,
University of Ado Ekiti, Ado Ekiti, Nigeria.
Adenugba AA, Dipo SO (2013). Non-oil exports in the economic
growth of Nigeria: a study of agricultural and mineral
resources. J Educ Soc Res 3: 403-418.
Adebayo OF, Akinyemi SA, Madukwe HY, Aturamu AO, Ojo AO
(2015a). Paleoenvironmental studies of Ahoko Shale, south
eastern Bida basin, Nigeria: insight from palynomorph
assemblage and trace metal proxies. International Journal of
Scientific and Research Publications 5: 1-16.
Akinyemi SA, Adebayo OF, Ojo OA, Fadipe OA, Gitari, WM
(2013). Mineralogy and geochemical appraisal of paleoredox indicators in Maastrichtian outcrop shales of Mamu
Formation, Anambra Basin, Nigeria. J Nat Sci Res 10: 48-64.
Adebayo OF, Ojo AO, Aturamu AO (2015b). Foraminiferal
and calcareous nannofossil studies of KR-1 well, offshore,
Southwest Niger Delta Basin, Nigeria. Elixir Earth Science 79:
30323-30328.
Adeigbe OC, Ola-Buraimo AO, Moronhunkola AO (2013).
Palynological characterization of the Tertiary offshore Emi1 well, Dahomey Basin, Southwestern Nigeria. International
Journal of Scientific and Technological Research 2: 58-70.
588
Ako BD, Ojo SB, Okereke CS, Fieberg FC, Ajayi TR, Adepelumi
AA, Afolayan JFO, Afolabi O, Ogunnusi HO (2004). Some
observation from gravity/magnetic data interpretation of the
Niger Delta. NAPE Bulletin 17: 4-8.
Algeo TJ, Maynard JB (2004). Trace-element behavior and redox
facies in core shales of Upper Pennsylvanian Kansas-type
cyclothems. Chem Geol 206: 289-318.
ADEBAYO et al. / Turkish J Earth Sci
Arnaboldi M, Meyers PA (2003). Geochemical evidence for
paleoclimatic variations during deposition of two Late
Pliocene sapropels from the Vrica section, Calabria. Palaeo
Palaeo Palaeo 190: 257-271.
Cullers RL (2000). The geochemistry of shales, siltstones and
sandstones of Pennsylvanian-Permian age, Colorado, USA:
implications for provenance and metamorphic studies. Lithos
51: 305-327.
Barreda VD, Palamarczuk S (2000). Palinomorfos continentales y
marinos de la Formación Monte León en su área tipo, provincia
de Santa Cruz, Argentina. Ameghiniana 37: 3-12 (in Spanish).
Cullers RL, Podkovyrov VN (2000). Geochemistry of the
Mesoproterozoic Lakhanda shales in southeastern Yakutia,
Russia: implications for mineralogical and provenance control,
and recycling. Precambrian Res 104: 77-93.
Bjorlykke K (1974). Geochemical and mineralogical influence of
Ordovician island arcs on epicontinental clastic sedimentation:
a study of Lower Palaeozoic sedimentation in the Oslo region,
Norway. Sedimentology 21: 251-272.
Brumsack HJ (1980). Geochemistry of Cretaceous black shales from
the Atlantic Ocean (DSDP Legs 11, 14, 36, and 41). Chem Geol
31: 1-25.
Brumsack HJ (1986). The inorganic geochemistry of Cretaceous black
shales (DSDP Leg 41) in comparison to modern upwelling
sediments from the Gulf of California. In: Summerhayes CP,
Shackleton NJ, editors. North Atlantic Palaeoceanography.
London, UK: Geological Society of London Special
Publications, pp. 447-462.
Brumsack HJ (1989). Geochemistry of recent TOC-rich sediments
from the Gulf of California and the Black Sea. Geol Rundsch
78: 851-882.
Brumsack HJ (2006). The trace metal content of recent organic
carbon-rich sediments: implications for Cretaceous black shale
formation. Palaeo Palaeo Palaeo 232: 344-361.
Calvert SE, Pedersen TF (1993). Geochemistry of recent oxic and
anoxic marine sediments: implications for the geological
record. Mar Geol 113: 67-88.
Condie KC, Marais DJD, Abbott D (2001). Precambrian superplumes
and supercontinents: a record in black shales, carbon isotopes,
and paleoclimates. Precambrian Res 106: 239-260.
Condie KC, Wilks M, Rosen DM, Zlobin VL (1991). Geochemistry
of metasediments from the Precambrian Hapschan Series,
eastern Anabar Shield, Siberia. Precambrian Res 50: 37-47.
Cox R, Lowe DR, Cullers RL (1995). The influence of sediment
recycling and basement composition on evolution of mudrock
chemistry in the southwestern United States. Geochim
Cosmochim Ac 59: 2919-2940.
Crusius J, Calvert S, Pedersen T, Sage D (1996). Rhenium and
molybdenum enrichments in sediments as indicators of oxic,
suboxic and sulfidic conditions of deposition. Earth Planet Sc
Lett 145: 65-78.
Cullers RL (1994). The controls on the major and trace element
variation of shales, siltstones and sandstones of PennsylvanianPermian age from uplifted continental blocks in Colorado to
platform sediment in Kansas, USA. Geochim Cosmochim Ac
58: 4955-4972.
Cullers RL (1995). The controls on the major and trace element
evolution of shales, siltstones and sandstones of Ordovician
to Tertiary age in the Wet Mountains region, Colorado, U.S.A.
Chem Geol 123: 107-131.
Dabard MP, Loi A (2012). Environmental control on concretionforming processes: examples from Paleozoic terrigenous
sediments of the North Gondwana margin, Amorican Massif
(Middle Ordovician and Middle Devonian) and SW Sandinia
(Late Ordovician). Sediment Geol 267: 93-103.
Dean WE, Gardner JV, Piper DZ (1997). Inorganic geochemical
indicators of glacial-interglacial changes in productivity
and anoxia of the California continental margin. Geochim
Cosmochim Ac 61: 4507-4518.
Dean WE, Piper DZ, Peterson LC (1999). Molybdenum accumulation
in Cariaco basin sediment over the past 24 k.y.: a record of
water-column anoxia and climate. Geology 27: 507-510.
Demchuk TD, Moore TA (1993). Palynofloral and organic
characteristics of a Miocene bog-forest, Kalimantan, Indonesia.
Org Geochem 20: 119-134.
Dill HG, Teshner M, Wehner H (1988). Petrography, inorganic and
organic geochemistry of Lower Permian Carboniferous fan
sequences (Brandschiefer Series) FRG: constraints to their
palaeogeography and assessment of their source rock potential.
Chem Geol 67: 307-325.
Durugbo EU (2013). Palynostratigraphy, age determination and
depositional environments of Imo Shale Exposures at the
Okigwe/Port Harcourt Express Road Junction Okigwe, Southeastern Nigeria. Greener Journal of Physical Science 3: 255272.
Ejedawe JE (1981). Patterns of incidence of oil reserves in Niger
Delta Basin. AAPG Bull 65: 1574-1585.
El-Beialy SY, Mahmoud MS, Ali SA (2005). Insights on the age,
climate and environment of the Miocene Rudeis and Kareem
formations, GS-78-1 well, Gulf of Suez, Egypt: a palynological
approach. Rev Espanola Micropaleont 37: 273-289.
Evamy DD, Haremboure J, Kamerling P, Knaap WA, Mollot FA,
Rowlands PH (1978). Hydrocarbon habitat of Tertiary Niger
Delta. AAPG Bull 62: 1-39.
Faegri K, Iversen J (1989).Textbook of Pollen Analysis. New York,
NY, USA: John Wiley & Sons.
Fayose EA (1970). Stratigraphical paleontology of Afowo-1 well,
southern Nigeria. J Min Geol 5: 1-97.
Ganai JA, Rashid SA (2015). Rare earth element geochemistry of the
Permo-Carboniferous clastic sedimentary rocks from the Spiti
Region, Tethys Himalaya: significance of Eu and Ce anomalies.
Chin J Geoch 34: 252-264.
Germeraad JJ, Hopping GA, Muller J (1968). Palynology of Tertiary
sediments from tropical areas. Rev Palaeobot Palyno 6: 189348.
589
ADEBAYO et al. / Turkish J Earth Sci
Graham A (1987). Miocene communities and paleoenvironments of
southern Costa Rica. Am J Bot 74: 1501-1518.
Gromet PL, Dymektev FP, Haskin LA, Korotev RO (1984). The
North American shale composite: its composition, major and
minor element characteristics. Geochim Cosmochim Ac 48:
2469-2482.
Hallberg RO (1976). A geochemical method for investigation of
palaeoredox conditions in sediments. Ambio Spec Rep 4: 139147.
Haskin MA, Haskin L (1964). Rare earth elements in European
shales: a redetermination. Science 748: 507-509.
Hatch JR, Leventhal JS (1992). Relationship between inferred redox
potential of the depositional environment and geochemistry
of the Upper Pennsylvanian (Missourian) Stark Shale Member
of the Dennis Limestone, Wabaunsee County, Kansas, U.S.A.
Chem Geol 99: 65-82.
Hetzel A, Böttcher ME, Wortmann UG, Brumsack H (2009). Paleoredox conditions during OAE 2 reflected in Demerara Rise
sediment geochemistry (ODP Leg 207). Palaeo Palaeo Palaeo
273: 302-328.
Hopping CA (1967). Palynology and the oil industry. Rev Palaeobot
Palyno 2: 23-48.
McLennan SM (1989). Rare earth elements in sedimentary rocks:
influence of provenance and sedimentary processes. Rev Miner
Geochem 21: 169-200.
McLennan SM (2001). Relationships between the trace element
composition of sedimentary rocks and upper continental crust.
Geochem Geophy Geosys 2: 1-24.
Morford JL, Russell AD, Emerson S (2001). Trace metal evidence for
changes in the redox environment associated with the transition
from terrigenous clay to diatomaceous sediment, Saanlich Inlet,
BC. Mar Geol 174: 355-369.
Murat RC (1972). Stratigraphy and paleogeography of the Cretaceous
and Lower Tertiary in Southern Nigeria, In: Dessauvagie TFJ,
Whiteman AJ, editors. African Geology. Ibadan, Nigeria:
University of Ibadan, pp. 261-269.
Murray JW (1991). Ecology and Paleontology of Benthic Foraminifera.
London, UK: Longman.
Nagarajan R, Madhavaraju J, Nagendral R, Armstrong-Altrin JS,
Moutte J (2007). Geochemistry of Neoproterozoic shales of
the Rabanpalli Formation, Bhima Basin, Northern Karnataka,
southern India: implications for provenance and paleoredox
conditions. Rev Mex Cienc Geol 24: 150-160.
Hospers J (1965). Gravity field and structure of the Niger Delta,
Nigeria, West Africa. Geol Soc Am Bull 76: 407-422.
Nath BN, Bau M, Rao BR, Rao ChM (1997). Trace and rare earth
elemental variation in Arabian Sea sediments through a transect
across the oxygen minimum zone. Geochim Cosmochim Ac 61:
2375-2388.
Jones B, Manning DAC (1994). Comparison of geological indices
used for the interpretation of palaeoredox conditions in
ancient mudstones. Chem Geol 111: 111-129.
Nwajide CS, Reijers TJA (1996). Sequence architecture in outcrop:
examples from the Anambra Basin, Nigeria. NAPE Bulletin 11:
23-32.
Kaplan A, Lusser CU, Norton IO (1994). Tectonic Map of the World,
Panel 10. Scale 1:10,000,000. Tulsa, OK, USA: American
Association of Petroleum Geologists.
Okosun EA, Liebau A (1999). Foraminiferal biostratigraphy of Eastern
Niger Delta, Nigeria. NAPE Bulletin 14: 136-156.
Kimura H, Watanabe Y (2001). Oceanic anoxia at the PrecambrianCambrian boundary. Geology 21: 995-998.
Knox GJ, Omatsola EM (1987). Development of the Cenozoic Niger
Delta in terms of the “Escalator Regression” model and impact
on hydrocarbon distribution. In: Proceedings of the KNGMG
Symposium: Coastal Lowlands, Geology and Geotechnology.
Dordrecht, the Netherlands: Kluwer, pp. 181-202.
Kogbe CA, Sowunmi MA (1980). The age of the Gwandu Formation
(Continental Terminal) in North-Western Nigeria. Ann Min
Geol 28: 43-53.
Kulke H (1995). Nigeria. In: Kulke H, editor. Regional Petroleum
Geology of the World. Part II: Africa, America, Australia and
Antarctica. Berlin, Germany: Gebruder Borntraeger, pp. 143172.
Kutterolf S, Diever R, Schacht U, Krawinkel H (2008). Provenance
of the Carboniferous Hodiwipfel Formation (Karawanken
Mountains, Austri/Slovenia) geochemistry versus petrography.
Sediment Geol 203: 246-266.
Loeblich AR Jr, Tappan H (1964). Treatise on Invertebrate
Paleontology, Part C, Protista, Vols. 1 and 2, Sarcodina Chiefly
“Thecamoebians” and Foraminiferida. Lawrence, KS, USA:
University of Kansas Press.
590
Olayiwola PO (1987). Petroleum and Structural Change in a
Developing Country: The Case of Nigeria. New York, NY, USA:
Praeger.
Pailler D, Bard E, Rostek F, Zheng Y, Mortlock R, van Geen A
(2002). Burial of redox-sensitive metals and organic matter in
the equatorial Indian Ocean linked to precession. Geochim
Cosmochim Ac 66: 849-865.
Palamarczuk S, Barreda VD (1998). Bioestratigrafıa de dinoflagelados
de la Formacion Chenque (Mioceno), provincia del Chubut.
Ameghiniana 35: 415-426 (in Spanish).
Petters SW (1979a). Nigerian Paleocene benthonic foraminiferal
biostratigraphy, paleoecology and paleobiologeography. Mar
Micropaleontol 4: 85-99.
Petters SW (1979b). Some Late Tertiary foraminifera from parabe-1
well, Eastern Niger Delta. Rev Esp Micropaleontol 11: 1190-133.
Petters SW (1982). Central West African Cretaceous-Tertiary benthic
foraminifera and stratigraphy. Palaeontographica Abt A 179:
1-104.
Piper DZ (1974). Rare-earth elements in the sedimentary cycle: a
summary. Chem Geol 14: 285-304.
Piper DZ (1994). Seawater as the source of minor elements in black
shales, phosphorites and other sedimentary rocks. Chem Geol
114: 95-114.
ADEBAYO et al. / Turkish J Earth Sci
Piper DZ, Bau M (2013). Normalized rare earth elements in water,
sediments, and wine: identifying sources and environmental
redox conditions. American Journal of Analytical Chemistry
4: 69-83.
Postuma JA (1971). Manual of Planktonic Foraminifera. New York,
NY, USA: Elsevier Publishing.
Reijers TJA, Petters SW, Nwajide CS (1997). The Niger Delta Basin.
In: Selley RC, editor. African Basins-Sedimentary Basin of the
World 3. Amsterdam, the Netherlands: Elsevier Science, pp.
151-172.
Rimmer SM (2004). Geochemical paleoredox indicators in
Devonian–Mississippian black shales, Central Appalachian
Basin (USA). Chem Geol 206: 373-391.
Rudnick RL, Gao S (2003). Composition of the continental crust. In:
Holland HD, Turekian KK, editors. Treatise on Geochemistry.
New York, NY, USA: Elsevier, pp. 1-64.
Thanikaimoni G (1987). Mangrove Palynology. Pondicherry,
India: Institut francais de Pondichery, Travaux de la Section
Scientifique et Technique.
Tomlinson PB (1986). The Botany of Mangroves. Cambridge, UK:
Cambridge University Press.
Turekian KK, Wedepohl KH (1961). Distribution of the elements in
some major units of the Earth’s crust. Geol Soc Am Bull 72: 175192.
Warning B, Brumsack HJ (2000). Trace metal signatures of eastern
Mediterranean sapropels. Palaeo Palaeo Palaeo 158: 293-309.
Weber KJ, Daukoru EM (1975). Petroleum geological aspects of the
Niger Delta. J Min Geol 12: 9-32.
Wedepohl KH (1969–1978). Handbook of Geochemistry, I–IV. Berlin,
Germany: Springer-Verlag.
Sarjeant WAS (1974). English Jurassic dinoflagellate cysts and
acritarch: a re-examination of some type and figure specimen.
Geosci Man 1: 1-25.
Wedepohl KH (1971). Environmental influences on the chemical
composition of shales and clays. In: Ahrens LH, Press F,
Runcorn SK, Urey HC, editors. Physics and Chemistry of the
Earth. Oxford, UK: Pergamon, pp. 305-333.
Schmidt RA, Smith RH, Lasch JE, Mosen AW, Olehy DA, Vasilevshis
J (1963). Abundances of fourteen rare-earth elements,
scandium, and yttrium in meteoritic and terrigenous matter.
Geochim Cosmochim Ac 27: 577-622.
Wedepohl KH (1991). The composition of the upper earth’s crust
and the natural cycles of selected metals. Metals in natural raw
materials. In: Merian E, editor. Metals and Their Compounds in
the Environment. Weinheim, Germany: VCH, pp. 3-17.
Selley RC (1976). An Introduction to Sedimentology. London, UK:
Academic Press.
Wedepohl WE (1995). The composition of the continental crust.
Geochim Cosmochim Ac 59: 1217-1232.
Shaw TJ, Geiskes JM, Jahnke RA (1990). Early diagenesis in differing
depositional environments: the response of transition metals
in pore water. Geochim Cosmochim Ac 54: 1233-1246.
Wilde P, Quinby-Hunt MS, Erdtmann BD (1996). The whole-rock
cerium anomaly: a potential indicator of eustatic sea-level
changes in shales of the anoxic facies. Sediment Geol 101: 43-53.
Short KC, Stauble AJ (1967). Outline of geology of Niger Delta.
AAPG Bull 51: 761-779.
Wood GD, Gabriel AM, Lawson JC (1996). Palynological techniques processing and microscopy. In: Jansonius J, McGregor V, editors.
Palynology: Principles and Applications. Dallas, TX, USA:
American Association of Stratigraphic Palynologists, pp. 29-50.
Simmons MD, Bidgood MD, Brenac P, Crevello PD, Lambiase JJ,
Morley CK (1999). Microfossil assemblages as proxies for
precise palaeoenvironmental determination – an example
from Miocene sediments of northwest Borneo. In: Jones RW,
Simmons MD, editors. Biostratigraphy in Production and
Development Geology. London, UK: Geological Society of
London Special Publications, pp. 219-241.
Stacher P (1995) Present understanding of the Niger Delta
hydrocarbon habitat. In: Oti MN, Postma G, editors. Geology
of Deltas. Rotterdam, the Netherlands: AA Balkema, pp. 257267.
Wronkiewicz DJ, Condie KC (1990). Geochemistry and mineralogy
of sediments from the Ventersdorp and Transvaal Supergroups,
South Africa: Cratonic evolution during the early Proterozoic.
Geochim Cosmochim Ac 54: 343-354.
Yarincik KM, Murray RW, Lyons TW, Peterson LC, Haug GH (2000).
Oxygenation history of bottom waters in the Cariaco Basin,
Venezuela, over the past 578,000 years: results from redoxsensitive metals (Mo, V, Mn, and Fe). Paleoceanography 15:
593-604.
591