Organic geochemical characteristics and depositional environment of Lower-Middle Miocene Küçükkuyu Formation, Edremit Gulf, NW Turkey
Bạn đang xem bản rút gọn của tài liệu. Xem và tải ngay bản đầy đủ của tài liệu tại đây (3.87 MB, 23 trang )
Turkish Journal of Earth Sciences
Turkish J Earth Sci
(2017) 26: 354-376
© TÜBİTAK
doi:10.3906/yer-1703-23
/>
Research Article
Organic geochemical characteristics and depositional environment of Lower-Middle
Miocene Küçükkuyu Formation, Edremit Gulf, NW Turkey
Ayşe BOZCU*
Department of Geological Engineering, Faculty of Engineering, Çanakkale Onsekiz Mart University, Çanakkale, Turkey
Received: 31.03.2017
Accepted/Published Online: 11.09.2017
Final Version: 13.11.2017
Abstract: The Lower-Middle Miocene Küçükkuyu Formation crops out extensively in the Edremit Gulf area (NW Turkey). In this
study, shale samples from this unit were investigated to evaluate source rock characteristics, depositional conditions, and hydrocarbon
potential. Outcrop samples of the Küçükkuyu Formation were taken from different locations and analyzed by Rock-Eval pyrolysis,
vitrinite reflectance (Ro), stable carbon isotope (δ13C), total sulfur (TS), gas chromatography (GC), and gas chromatography-mass
spectrometry (GC-MS). The total organic carbon (TOC) values range from 0.23 to 6.1 wt.% with an average of 1.76 wt.% for the
northern samples and 0.24 to 2.82 wt.% with an average of 1.66 wt.% for the southern samples around the Edremit Gulf. Hydrogen index
(HI) values were up to 606 and 712 mg HC/g TOC in the north and south of the gulf, respectively. Organic matter type in the formation
consists predominantly of Type II and III kerogen with a minor component of Type I kerogen. Tmax values ranging from 414 to 496 °C
in the north and 423 to 446 °C in the south of the gulf indicate that most samples are at the beginning of the oil generation window and
are thermally immature or early-mid-mature. Vitrinite reflectance (Ro) and biomarker maturity parameters support this result. Based
on geological observations, biomarker distributions, and TOC/TS ratios, the Küçükkuyu Formation was deposited in a freshwater to
slightly brackish water environment under anoxic-suboxic conditions with organic matter input from aquatic organisms and from
terrestrial higher plants. According to Rock-Eval pyrolysis data, the Küçükkuyu Formation mostly has medium to good hydrocarbongeneration potential. However, as these potential source rocks are in general immature and/or early-mature, the hydrocarbon potential
of the study area is very limited.
Key words: Küçükkuyu Formation, Lower-Middle Miocene, source rock, Edremit Gulf, NW Turkey
1. Introduction
The study area is the region to the north and south of the
Edremit Gulf in northwestern Anatolia (Figure 1). The
area is located between the Thrace basin in the north,
the Prinos oil field of Greece in the northwest, and the
western Aegean grabens to the south. Neogene sediments
represented by lacustrine sedimentary rocks and volcanics
are exposed around the Edremit Gulf. Sedimentary rocks
such as shale, siltstone, tuff, and lignite were deposited
contemporaneously with the Lower-Middle Miocene
volcanics, deposited in small, isolated, fault-bounded
lacustrine basins (Siyako et al., 1989). The shales are thinbedded, laminated, and bituminous. The Küçükkuyu
Formation, which has wide exposures and a certain source
rock potential, is represented by these lacustrine sediments
in the region.
The oil seeps observed in calcite-filled fractures of the
Küçükkuyu Formation have been mentioned in previous
studies (Saka, 1979; Siyako et al., 1989; Kesgin, 2001; Çiftçi
et al., 2004, 2010). In these studies, possible elements of
*Correspondence:
354
the hydrocarbon system in western Anatolia and around
the Edremit Gulf were identified, but the Küçükkuyu
Formation shales have not been investigated in detail
according to their organic geochemical properties to
date. Published investigations related to the source rock
properties of the Küçükkuyu Formation are limited (Çiftçi
et al., 2004, 2010; Bozcu, 2015). In this study, organic
geochemical properties and hydrocarbon generation
potential of the Küçükkuyu Formation at different
outcrop locations are evaluated. In addition, depositional
conditions of the formation were interpreted using δ13C
values, TOC/TS ratios, and biomarker distributions.
2. Geological setting
The Edremit Gulf and the adjacent area is a depression
bordered by active faults between Kazdağ High in the
north and Kozakdağ High in the south (Figure 1).
Kazdağ
High
geologically
consists
of
tectonostratigraphic units of different origins and ages.
These are: 1- Kazdağ Group (Bingöl, 1968, Bingöl et al.,
BOZCU / Turkish J Earth Sci
0
0
26 30'
40 0 30'
Gökçeada
aros
fS
ulf o
G
27 30'
Şarköy
Marmara Sea
Karabiga
Gelibolu
es
ell
n
a
rd
Da
Al
Biga
Al
Çanakkale
Gönen
Çan
0
40 00'
Çamlıca
Bozcaada
N
Bayramiç
Ezine
K
A
Z
1
Küçükkuyu
0
39 30'
D
Yenice
Ğ
A
Al
Balya
Edremit
Al
mit
f Edre
Gulf o
2
Ayvalık
Z
KO
Lesbos
0
Kavala
Greece
1-2
Study areas
Al
Alluvium
20
40 km
Thrace
27
İstanbul
Saros
Bursa
eg
ea
n
Se
a
Miocene-Pliocene
continental sediments
Oligocene-Lower Miocene
volkanic rocks
Oligocene-Lower Miocene
granitoids
Eocene-Miocene
marine sediments
K. Menderes G.
B. Menderes G
Athens
A
EXPLANA TIONS
Cretaceous Çetmi
ophiolitic melange
Triassic Karakaya
complex
Jurassic-Cretaceous
sedimentary sequence
Çamlıca metamorphic
rocks
Kazdağ metamorphic
complex
Ultramafic
rocks
AĞ
D
AK
0
100
200 km
36
Figure 1. Location map of Biga Peninsula and generalized geological map of the Edremit Gulf and surroundings, northwestern
Turkey, with the location of the studied areas (revised from Okay and Satır, 2000; Şengün et al., 2011).
355
BOZCU / Turkish J Earth Sci
young faults formed by extensional tectonics (Yılmaz et al.,
2001). E-W/NE-SW trending normal faults and/or oblique
faults form the region’s main tectonic framework, which is
developing during the neotectonic period in relation to the
N-S extensional regime in western Anatolia.
Terrestrial deposits (Küçükkuyu Formation) developed
along with volcanic rocks in the Early-Mid Miocene. These
are bituminous shales, claystones with intercalations of coal,
siltstone, sandstone, and tuffs (Saka, 1979; Siyako et al.,
1989). The Küçükkuyu Formation unconformably overlies
the Kazdağ group and the Çetmi Ophiolitic Mélange or their
contacts are faulted to the north of Edremit Gulf (Figure
2). In the Late Miocene-Pliocene, conglomerate, sandstone,
shale, and clayey limestone levels were deposited and these
associations reflect fluvial and lacustrine environments
(İlyasbaşı Formation) (Saka, 1979). These sediments show
lateral and vertical transition to shallow marine sandstone,
conglomerate, shale, marl, and oolitic limestones (Bayramiç
Formation) (Siyako et al., 1989).
1975; Okay et al., 1990a, 1990b; Okay and Satır, 2000);
2- Çamlıca Group (Çamlıca Metamorphics) (Okay et al.,
1990a, 1990b); 3- Karakaya Complex (Bingöl et al., 1975;
Okay et al., 1990a, 1990b); and 4- Çetmi Ophiolitic Mélange
(Okay et al., 1990a, 1990b; Duru et al., 2004; Şengün and
Çalık, 2007).
A very thick magmatic sequence (>2500 m) with various
chemical compositions was formed in the Eocene-Pliocene
interval. The sequence has an interfingering contact with
sedimentary rocks (Siyako et al., 1989; Ercan et al., 1995).
Magmatic activity was renewed in the Oligo-Miocene in the
region and shallow intrusive rocks (Evciler and Kestanbol
granites and granodiorites, Birkle and Satır, 1995; Karabiga
and Kuşçayırı granites and granodiorites, Delaloya and
Bingöl, 2000; Ilıca-Şamlı granites and granodiorites, Bingöl
et al., 1982) were intruded into pre-Oligo-Miocene rocks
during this period.
At the end of the Late Miocene, volcanic activity was
renewed again and alkaline basalts were replaced along
+
KPç
44
Tkü
Tküa
20
Tkü Tküa Arıklı
Tküa
22
Yeşilyurt
iver
Mıhlı R
Adatepe 30
Tküad
26
19
Tküa
Qal
Tkü
18
Tkü
Tkı
50000
0
4
55000
4
TRgr
Tb
EDREMİT GULF
75000
4
Td
Tküa
43
Qal
ALTINOLUK
Küçükkuyu
Qal
Tkı
Ti
Tküa
Tkü
Td Doyran
Narlı Tez
Tez
Tkü
Td
12
+
Tkü
Kpç
30
Nusratlı
T
PRka
Td, Tez
Tkü
Td
Ahmetçe
KPç
Tkı
Qal
N
kçt
kçt
Td, Tez
Ti
Takp
kçt
e
+
Takp
Td, Tez
kçt
Tkı
KPç
Td
Kızılyar
+
80000
T
PRka
Td, Tez
Tb
Td, Tez
Kpç kçt
+
Td, Tez
AYVACIKQal
43
Ti
Qal
000
85
e
KPç
Ti
Tb
43
kçt
Ti
Takp
+
Ti
+
Td, Tez
60000
4
4
65000
1
2
4
70000
3
4
5 km.
75000
EXPLANATIONS
PT
Rka
Granitoid
(Triassic)
Kazdağ Metamorphics
(Permo-Triassic)
Alluvium
Tb
Bayramiç Formation
(Pliocene)
Ti
İlyasbaşı Formation
(Upper Miocene)
Tküad
Tkü
TRgr
Küçükkuyu Formation
(Lower-Middle Miocene)
KPç
of Çetmi Ophiolitic Melange
(Cretaceous)
e
Qal
Tküa
Tkı
Adatepe Sandstone Member
Arıklı Tuff Member
Kızılyar Conglomerate
Takp
Td, Tez
15
Bedding strike and dip
16
Foliation strike and dip
Akpınar Tuff Member
Thrust fault
Doyran - Ezine Volcanics
Normal fault
+
kçt
Strike-slip fault
Synclinal axis
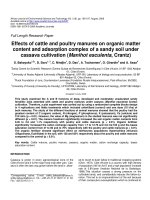
Figure 2. Geological map showing outcrops of the Küçükkuyu Formation in the north of the Edremit Gulf (revised from Okay
et al., 1990b).
356
BOZCU / Turkish J Earth Sci
Coal plant fragments, thin coal levels, and pyrite
crystals are observed in sandstone-shale alternations of
the formation. Sedimentary structures, including planar
parallel stratification, lamination, grading, spheroidal
nodules, ripple marks, slump structures, and mud
dykes, are common in the formation (Bozcu, 2015). The
formation is overlain unconformably by the İlyasbaşı
Formation (Saka, 1979). The İlyasbaşı Formation starts
with conglomerate and continues with sandstone-shale
alternations (Figure 4).
The Kızılyar conglomerate consists of reddish, weakly
cemented conglomerate and sandstone. The conglomerate
is reddish, dark purplish-red, and purple colored, well
rounded but poorly sorted, and consists of andesite, chert,
alkaline lava pebbles, and coarse-grained sandstone layers
around the Kızılyar village. The depositional environment
of the unit was braided-river and/or steeply dipping alluvial
fan (Beccaletto, 2004; Çiftçi et al., 2004). Lateral thickness
change and geometry of the unit in a section near Kızılyar
village reflects sedimentation as fan sediments (Bozcu,
2015).
The Arıklı tuff is white-beige in color on a fresh surface
and yellow-brownish on weathered surfaces. It is thickbedded, massive, and quite hard in unweathered areas.
The tuff also contains thick-medium-bedded tuffite levels.
Kozakdağ High is located to the south of the Gulf
(Figure 1). In this area Triassic units (Karakaya complex)
form the basement. Oligo-Miocene plutonic and volcanic
rocks (Kozak pluton and Yuntdağ volcanics) cut this
basement. Miocene-Pliocene aged fluvial and lacustrine
sediments (Küçükkuyu Formation, Mutlu Formation,
Soma Formation) unconformably overlie these units
(Figure 3).
2.1. Stratigraphy of the Küçükkuyu Formation
The stratigraphy of the formation is studied with the help
of detailed lithological columns established from key areas
in the north (Bozcu et al., 2014; Bozcu, 2015) and in the
south (Aytepe, 2010; Bozcu et al., 2014). The Küçükkuyu
Formation (Saka, 1979), which consists of alternating
bituminous shale and sandstone, crops out extensively
around the Edremit Gulf (Figures 1–3) The formation is
Lower-Middle Miocene in age (İnci, 1984; Kesgin, 2001;
Çiftçi et al., 2004).
In the north the Küçükkuyu Formation is divided into
three members according to lithological and stratigraphic
characteristics (Saka, 1979). The formation starts with
a conglomerate level (Kızılyar conglomerate member),
continues through sandstone-shale alternations, with
observed tuff levels above (Arıklı tuff member), and ends
with sandstone (Adatepe sandstone member).
70
Ören
N
000
BURHANİYE
EDREMİT GULF
Tküa
28
Tkü
Tkü
Pl-Qd
43 60 000
Tkük
Tküa
Tyu
Tyu
Tyu
Trk
Qal
Ağacık
Tkük
11
30
Hacıhüseyinler
Tk
Trk
10
13
Tyut
15
Tyu
40
Ulubeyler
Tkü
Murateli
25
Tyu
28
Tyu
Yabancılar
Qal
Keremköy
Tkü
Yunuslar
Tkük
Tyu
43 55 000
15
Hacıoğlu
Tm
Tk
Tm
35
Tk
17
Tyut
62
Tkü
Tyu
5
Tkük
Tıfıllar
Yeniköy
47
Mutlu
Trk
Bağyüzü
Tk
10
Tyu
Okçular
Kırcalar
Tyua
ALTINOVA
4
75
000
0
Tk
Qal
70
Tyut
Tyu
Kızılyar Conglomerate
Tuff Member
Yuntdağ Volcanics
Tyua
Andesite Member
Ty
Yürekli Dacite
Tk
Kozak Granodiorite
(Oligocene)
Karakaya Complex
(Triassic)
Aşağıbey
Tyu
23
Qal
65
Tkük
Trk
Çakmak
000
Arıklı Tuff
Küçükkuyu Formation
Tk
Tm
4345 000
4
Tküa
Tkü
35
Tm
000
Mutlu Formation
(U. Miocene-Pliocene)
Trk
Tyu
Qal
4
Tm
30
AYVALIK
43 50 000
Dededağ Basalt
(Plio-Quaterner)
Tyut
Kuyualanı
GÖMEÇ
Tyu
Hisarköy
Alluvium
Pl-Qd
Tahtacı
40
Tkü
Tküa
Tküa
Şahinler
Tkük
Tküa
Tkü
28
Tyu
Tm
Tküa
Qal
Tkü
Tkü
Tyu
Tküa
5
Tyua
Tkü
30
25
Trk
KARAAĞAÇ
Tkü
15Tküa
30
Ty
Trk
20
Tküa
28
Tkü
Tküa
Pelitköy
43 65 000
Şarköy
Tküa
Taylıeli
Trk
EXPLANATIONS
Qal
Qal
Lower-Middle Miocene
43
4
80
000
5
10 km
Tk
Tyua
4
85
000
4
90
000
4
95 000
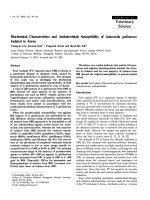
Figure 3. Geological map showing outcrops of the Küçükkuyu Formation in the south of the Edremit Gulf (revised from Akyürek
and Soysal, 1983; Çiftçi et al., 2004, Aytepe, 2010).
357
BOZCU / Turkish J Earth Sci
Formation
Member
Late Mio.Pliocene
İlyasbaşı
Age
Lithology
Explanations
Sandstone, fine-grained conglomerate
Arıklı Tuff
Adatepe
Sandstone
Conglomerate, sandstone, claystone, clayey
limestone
Küçükkuyu
Early-Middle Miocene
White, pale brown rhyolitic tuff
Kızılyar
Conglomerate
Sandstone, siltstone, claystone and
bitumineous shale alternation
ne
oce
i
o-M
ig
Ol
yra
Do
ge
i
tm elan
e
Ç cM
liti
hio
s
eou
ac
ret
C
U.
ol.
nV
Op
Reddish, weakly cemented
conglomerate and sandstone
Andesitic, dasitic volcanics (lava,
aglomerate and tuff)
Serpentinite, gabbro, basic lava,
sandstone, mudstone with limestone
block
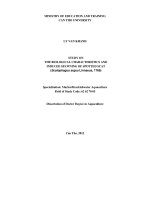
Figure 4. Stratigraphic column of the Küçükkuyu Formation in the north of the Edremit Gulf.
358
no scale
BOZCU / Turkish J Earth Sci
In thin section it consists of fine-grained components and
has vitric tuff characteristics. Quartz-plagioclase minerals
and ferrous alteration are observed (Bozcu, 2015).
The Adatepe sandstone occurs at the upper level of the
formation. It crops out in a restricted area along a synclinal
structure to the north of Küçükkuyu near Adatepe village.
The unit starts with sandstone-shale alternation at lower
levels, passing into sandstone with pebbles. The dominant
lithology is tuffite and carbonate-cemented sandstone
(Bozcu, 2015).
In the south, the Küçükkuyu Formation starts with
a conglomerate level and continues through sandstoneshale and carbonated siltstone alternations, with tuff levels
above. The formation comprises two members. The lower
is the Kızılyar conglomerate, consisting of chert, schist,
and volcanic rock pebbles; the upper is tuff named Arıklı
tuff. It is white-yellow in color, medium-thick-bedded,
massive, and quite hard.
Sandstone content increases towards the upper part
of the formation. The formation ends in medium-thick
layered sandstone. Lamination, thin coal levels, and pyrite
crystals are observed in the formation. The formation is
overlain unconformably by the Mutlu Formation (Çiftçi
et al., 2004). The Mutlu Formation (equivalent of İlyasbaşı
Formation) starts with conglomerate, continuing to
sandstone, clayey limestone, and marl (Figure 5).
3. Materials and methods
A total of 63 shale samples from the Küçükkuyu Formation
outcrops in the north of the Edremit Gulf (44 samples)
and to the south of the Edremit Gulf (19 samples) were
analyzed. These shale samples were collected from
measured sections systematically: around Narlı, Adatepe,
Yeşilyurt, and Arıklı in the north from 10 measured
sections, and around Burhaniye and Gömeç in the south
from 6 measured sections.
Rock-Eval pyrolysis/TOC and Ro (vitrinite
reflectance), GC (gas chromatography), GC-MS (gas
chromatography-mass spectrometry), δ13C isotope, and TS
(total sulfur) measurements were performed. The analyses
were carried out in the Turkish Petroleum Corporation
Research Group laboratories (TPAO, Ankara).
Rock-Eval pyrolysis/TOC analyses of all the samples
were carried out using a Rock-Eval 6 instrument equipped
with a TOC module and results are presented in Table 1.
The vitrinite reflectance measurements were performed
on polished sections in reflected light. GC analyses were
performed on 10 samples via Agilent 6850 whole-extract
gas chromatographic analysis. GC-MS analyses were
conducted on whole-rock extracts obtained from five
samples. The saturated fractions were also analyzed using
Agilent 7890A/5975C gas GC-MS equipment. Sterane
and terpane distributions were defined in light of peak
descriptions on m/z 191 and m/z 217 chromatograms.
Stable carbon isotope (δ13C) analyses were conducted
on 8 samples using a GV Instruments Isoprime GC-CIRMS device. The results are presented in ‰ versus (PDB).
4. Results
4.1. TOC content and Rock-Eval pyrolysis
Rock-Eval pyrolysis results of shale samples from north
and south of the Edremit Gulf are given in Tables 1 and 2.
The TOC content of 44 shale samples from north of
the Edremit Gulf ranges from 0.23 to 6.1 wt.% (mean: 1.76
wt.%). Rock-Eval S1 and S2 values are 0–1.07 and 0.03–
33.08 mg HC/g rock, respectively. The HI varies from 8 to
606 mg HC/g TOC.
The TOC content of 19 shale samples from south of the
Edremit Gulf ranges from 0.24 to 2.82 wt.% (mean: 1.66
wt.%). Rock-Eval S1 and S2 values are 0–0.28 and 0.05–
22.07 mg HC/g rock, respectively. The HI varies from 21
to 712 mg HC/g TOC.
Rock-Eval pyrolysis results of the Küçükkuyu
Formation were plotted in HI versus Tmax (Espitalié et al.,
1985) and HI versus OI diagrams (Espitalié et al., 1977)
separately for the northern and southern areas of the
Edremit Gulf. Although a few samples are in the Type I
kerogen field, the majority of the samples are in Type II
and Type III kerogen fields (Figures 6a and 6b).
Tmax values vary between 414 and 496 °C (except
one, 607 °C) in the north and between 423 and 446 °C in
the south. The production index (PI) values are 0–0.48
(average: 0.11) in the north and 0–0.19 (average 0.02) in
the south (Tables 1 and 2).
4.2. Vitrinite reflectance
Vitrinite reflectance (Ro) is generally used as a maturity
indicator (Dow, 1977). Ro data are given in Table 3.
Measured vitrinite reflectance (Ro) values of the Küçükkuyu
samples are 0.40%–1.73% Ro (average: 0.73% Ro).
4.3. Stable carbon isotopic composition
Stable carbon isotope (δ13C) values are listed in Table 4.
δ13C values are ranging from –26.15‰ to –30.50‰ with
an average of –28.28‰.
4.4. Total sulfur
TS analysis was performed on 15 samples. Results for TOC
and TS are shown in Table 5. Measured samples have TS
values ranging from 0.0035% to 0.63%.
4.5. Molecular composition
4.5.1. n-Alkanes and isoprenoids
GC analyses were carried out for 10 samples (5 samples
from the northern part and 5 samples from the southern
part of the investigated area) and n-alkane distribution and
isoprenoids were assessed based on gas chromatograms.
Selected gas chromatograms of the total extracts are
presented in Figure 7 and their parameters are given in
359
Age
Member
Formation
BOZCU / Turkish J Earth Sci
Lithology
Explanations
.
Conglomerate, sadstone, claystone
and clayey limestone and limestone.
Küçükkuyu
Light yellow, rhyolitic tuff
Kızılyar
Congl. Yürekli Dacite - Andesite -Tuff
Kozak
Pluton
Karakaya
Complex
Yuntdağ Volcanics
Oligocene
Triassic
Early-Middle Miocene
Arıklı tuff
Late Mio.-Pliocene
Mutlu / Dededağ bas.
tern
Qua
Sandstone, siltstone, claystone and bitumineous
shale alternation
Reddish- purplish weakly cemented polygenic
conglomerate and sandstone
no scale
Figure 5. Stratigraphic column of the Küçükkuyu Formation in the south of the Edremit Gulf (revised from Aytepe, 2010).
360
BOZCU / Turkish J Earth Sci
Table 1. Rock-Eval pyrolysis results for Küçükkuyu Formation samples in the north of the Edremit Gulf (*: from Bozcu, 2015).
Sample
S1 (mg
TOC
HC/
(%)
g rock)
S2 (mg
HC/
g rock)
S3 (mg
CO2/
g rock)
Tmax
(°C)
HI
(mg HC/g
TOC)
OI
(mg CO2/
g TOC)
PI
(S1 /
S1 + S2)
RC
(%)
PC
(%)
MINC PY
(%)
(S1 + S2)
Do-1
Do-2
Do-3
Do-6
Na1
Na2
Na3
Na4
Kü-2*
Kü-5*
Kü-6*
Kü-10*
Kü-11*
Bd-2
Bd-3
Bd-4
Bd-6
Ad-1
Ad-3
Ad-5
A2-07*
A4-07*
Kç-4
Kç-5
Kç-6
Kç-7
Nu-2
N-6*
Ar-2
Ar-3
Ar-4
Ar-5
Ar-6a
Yk-1
Yk-2
Ye-1
Ye-2
Ye-3
Y-1*
Y-2*
Y-4*
Y-8*
B-1*
B-2*
0.96
1.94
0.87
1.2
0.25
0.23
0.50
1.68
2.43
6.1
0.56
0.97
1.34
2.7
0.92
2.41
1.63
0.37
1.44
1.42
0.93
1.54
0.47
2.18
1.2
1.88
1,76
1.04
1.43
3.01
2.73
1.07
4.29
1.98
2.83
1.99
1.66
2.15
4.18
2.08
1.7
1.55
3.91
0.27
0.46
1.12
0.29
0.88
0.04
0.03
0.04
1.14
5.36
33.8
0.21
0.52
1.14
8.84
1.18
5.4
1.82
0.15
1.96
1.97
1.63
2.74
0.15
8.99
2.3
7.57
4,74
1.57
3.81
17.37
16.55
3.77
24.28
6.08
10.93
6.31
5.02
8.38
11.8
11.4
9.6
6.47
15.8
0.11
0.62
0.87
1.16
0.4
0.93
0.98
0.48
0.61
1.47
1.83
0.74
0.43
1.00
0.53
0.38
0.91
0.86
0.22
0.91
0.6
1.03
0.73
0.77
0.86
0.59
0.18
1,01
0.93
0.98
1.17
0.93
0.49
1.25
0.9
1.11
1.13
0.74
0.79
1.89
1.39
1.22
1.08
2.21
0.58
447
443
442
447
496
435
607
454
440
438
450
453
448
441
445
441
450
462
444
446
445
443
447
443
439
444
436
440
441
436
434
428
425
440
440
441
436
429
438
439
440
423
431
414
48
58
33
73
16
13
8
68
221
554
38
54
85
327
128
224
112
41
136
139
175
178
32
412
192
403
269
151
266
577
606
352
566
307
386
317
302
390
282
548
565
417
404
41
65
45
133
33
372
426
96
36
60
30
132
44
75
20
41
38
53
59
63
42
111
47
164
39
49
10
57
89
69
39
34
46
29
45
39
57
45
37
45
67
72
70
57
215
0.48
0.4
0.22
0.34
0.37
0.34
0.28
0.33
0.03
0.01
0.06
0.19
0.12
0.04
0.13
0.12
0.12
0.02
0.18
0.17
0.12
0.26
0
0.02
0.03
0.02
0,01
0.01
0.01
0.02
0.02
0.02
0.03
0.02
0.03
0.03
0.04
0.02
0.02
0.04
0.02
0.03
0.02
0.12
0.86
1.75
0.79
1.07
0.22
0.20
0.48
1.51
1.91
3.18
0.51
0.9
1.2
1.9
0.79
1.86
1.42
0.35
1.21
1.19
0.74
1.2
0.43
1.37
0.98
1.22
1.31
0.87
1.07
1.47
1.27
0.72
2.14
1.42
1.84
1.4
1.19
1.4
3.1
1.04
0.84
0.95
2.48
0.24
0.1
0.19
0.08
0.13
0.03
0.03
0.02
0.017
0.52
2.92
0.05
0.07
0.14
0.8
0.13
0.55
0.21
0.02
0.23
0.23
0.19
0.34
0.04
0.81
0.22
0.66
0,45
0.17
0.36
1.54
1.46
0.35
2.15
0.56
0.99
0.59
0.47
0.75
1.08
1.04
0.86
0.6
1.43
0.03
0.22
0.42
1.38
0.08
0.15
1.31
1.12
0.88
0.19
0.14
0.58
0.53
0.85
0.29
0.51
1.3
0.38
0.8
0.81
0.43
2.73
0.19
0.79
0.64
0.15
0.65
0.47
0.06
1.28
5.01
5.58
9.18
0.14
0.22
0.16
0.22
0.08
0.11
0.34
0.14
0.46
0.12
0.26
0.52
0.44
0.74
0.08
0.44
0.02
0.02
0.02
0.56
0.17
0.24
0.01
0.12
0.16
0.4
0.18
0.74
0.26
0
0.44
0.4
0.23
1.07
0
0.22
0.07
0.18
0,02
0.01
0.02
0.36
0.36
0.07
0.7
0.12
0.32
0.17
0.23
0.15
0.26
0.42
0.2
0.19
0.28
0.02
0.90
1.86
0.37
1.32
0.06
0.05
0.06
1.60
5.53
33.32
0.22
0.64
1.30
8.92
1.36
5.78
2.08
0.15
2.4
2.37
1.86
3.81
0.15
9.21
2.37
7.75
4.76
1.58
3.83
17.73
16.91
3.84
24.98
6.2
11.25
6.48
5.25
8.53
12.06
11.82
9.8
6.66
16.08
0.13
361
BOZCU / Turkish J Earth Sci
Table 2. Rock-Eval pyrolysis results for Küçükkuyu Formation samples in the south of the Edremit Gulf.
Sample
TOC
(%)
S1
(mg HC/
g rock)
S2
(mg HC/
g rock)
S3
(mg CO2/
g rock)
Tmax
(°C)
HI
OI
(mg HC/ (mg CO2/
g TOC) g TOC)
PI
RC
(S1 /
(%)
S1 + S2)
PC
(%)
MINC PY
(%)
(S1 + S2)
Br-2
1.7
0.2
6.85
0.9
438
403
53
0.03
1.07
0.63
2.18
6.87
Br-5
2.82
0.2
13.78
0.53
439
489
19
0.01
1.62
1.2
1.19
13.80
Br-6
1.81
0.07
7.32
1
438
404
55
0.01
1.15
0.66
3.33
7.39
UL-2
0.73
0
0.56
0.44
431
77
60
0
0.66
0.07
0.47
0.56
UL-3
1.06
0.07
2.16
0.34
430
204
32
0.03
0.85
0.21
0.86
2.23
UL-5
0.24
0
0.05
0.51
446
21
212
0
0.22
0.02
0.38
0.05
Yn-1
0.28
0
0.06
0.54
445
21
193
0
0.25
0.03
3.89
0.06
Yn-3
1.13
0.06
3.66
0.57
426
324
50
0.02
0.79
0.34
4.95
3.72
Yn-4
0.35
0
0.13
0.38
445
37
109
0
0.32
0.03
1.28
0.13
Hi-01
2.73
0.18
18.61
0.52
438
682
19
0.01
1.13
1.6
3.91
18.79
Hi-02
1.56
0.07
6.58
0.68
437
422
44
0.01
0.97
0.59
5.56
6.65
Ul-02
0.77
0.1
0.44
1.55
423
57
201
0.19
0.66
0.11
0.32
0.45
Ul-07
0.57
0.07
0.79
1.08
442
139
189
0.08
0.46
0.11
1.92
0.86
Yu-03
2.01
0.28
8.22
0.95
433
409
47
0.03
1.25
0.76
2.69
8.50
Ş-02
1.32
0.13
6.18
0.57
436
468
43
0.02
0.76
0.56
7.17
6.31
Ş-07
2.09
0.15
8.58
1.68
440
411
80
0.02
1.3
0.79
4.49
8.73
Ş-12
1.52
0.09
5.01
1.07
436
330
70
0.02
1.05
0.47
3.46
5.10
Şr-06
3.1
0.4
22.07
0.54
437
712
17
0.02
1.19
1.91
1.07
22.47
Ao-09
0.84
0.06
2.21
0.7
436
263
83
0.02
0.62
0.22
2.86
2.27
Table 6. Küçükkuyu samples comprise n-alkanes in the
range of C12–C35. The chromatograms show a dominance
of mid chain (n-C21–25) and long chain (n-C27–32) n-alkanes.
The Pr (pristane) and Ph (phytane), the main acyclic
isoprenoids, also exist, with the Pr/Ph ratio ranging
between 0.22 and 1.42 (Table 6).
The Pr/n-C17 and Ph/n-C18 values are given in Table
6, and the Pr/n-C17 versus Ph/n-C18 cross-plot is shown
in Figure 8.
The carbon preference index (CPI) was computed
from the gas chromatography data using the n-alkanes
C25–C33 (Bray and Evans, 1961) (Table 6). The CPI values
range between 0.96 and 1.69.
4.5.2. Steranes and terpanes
The sterane (m/z 217) and terpane (m/z 191) distributions
in the Küçükkuyu samples are shown in Figure 9. The
biomarker data calculated from the m/z 217 and 191 mass
chromatograms are listed in Table 7. Peak definitions on
m/z 217 and m/z 191 chromatograms are given in Tables
8 and 9.
362
5. Discussion
5.1. TOC contents
The TOC content of the Küçükkuyu Formation in the
north and south of the Edremit Gulf (Tables 1 and 2) range
from 0.23 to 6.1 wt.% (average: 1.76 wt.%) and 0.24 to
2.82 wt.% (average: 1.66 wt.%), respectively, and generally
indicate a good source rock potential.
5.2. Type of organic matter (OM)
Figures 6a and 6b show that the organic matter in shale
samples contains mainly Type II–III (oil- and gas-prone)
kerogen, with a minor component of Type I (oil-prone)
kerogen (Tissot and Welte, 1978).
The HI values of the Küçükkuyu shales from the north
and south of the Edremit Gulf are in the range of 8–606
and 21–712 mg HC/g TOC (average: HI 238.95 and 309.10
mg HC/g TOC), respectively. These HI values indicate
that the organic matter contains predominantly Type II–
III (aquatic and terrestrial organic matter) kerogen. The
Küçükkuyu samples are predominantly represented by
long and mid-chain n-alkanes. Long chain n-alkanes are
BOZCU / Turkish J Earth Sci
Table 3. Vitrinite reflectance (Ro%) analyses results of the
Küçükkuyu Formation (*: from Bozcu, 2015).
Sample
Ro (%)
Do-2
1.35
Do-6
1.23
Kü-5*
0.50
Kü-10*
0.88
Bd-2
0.56
Bd-6
0.95
Ad-3
0.40
A2-07*
0.55
Kç-5
0.48
Kç-7
1.73
Ye-1
0.69
Ye-2
0.70
Ye-3
0.58
Br-2
1.66
Br-5
0.40
Ul-02
0.46
UL-3
0.67
Type I
Table 4. Stable carbon isotope values for Küçükkuyu Formation
samples (*: from Bozcu, 2015).
Hydrogen index (mg HC/g TOC)
Type II
Type III
Oxygen index (mg CO2/g TOC)
Figure 6. HI versus Tmax distribution (a) (Espitalié et al., 1985)
and HI versus OI distribution (b) (Espitalié et al., 1977) for
Küçükkuyu samples from north and south of the Edremit Gulf.
Sample
δ 13C
Kü-11*
–27.39
Y-2*
–29.26
B-1*
–26.15
Hi-01
–29.34
Yu-03
–30.50
Ş-02
–27.54
Ş-07
–26.97
Şr-06
–29.14
derived from terrestrial higher plant waxes (Eglinton and
Hamilton, 1967; Tissot and Welte, 1984; Meyers, 1997).
Mid chain n-alkanes are in general derived from aquatic
macrophytes (Ficken et al., 2000). Short chain n-alkanes
mainly present algae (Cranwell et al., 1987) and planktons
(Meyers, 1997).
On a Pr/n-C17 versus Ph/n-C18 cross-plot, the
Küçükkuyu Formation samples plot in the algal, mixed,
and terrigenous Type I, II/III, and III fields (Figure 8).
363
BOZCU / Turkish J Earth Sci
Table 5. TOC, TS, and TOC/TS values of the Küçükkuyu
Formation (*: from Bozcu, 2015).
Sample
TOC (%)
TS (%)
TOC/TS
Y-2*
2.08
0.041
50.73
Y-4*
1.7
0.12
14.16
Y-8*
1.55
0.077
20.12
A4-07*
1.54
0.012
128.33
N-6*
1.04
0.026
40
B-1*
3.91
0.062
63.06
Kü-2*
2.43
0.029
83.79
Kü-5*
6.1
0.63
9.68
Kü-10*
0.97
0.012
80.83
Na-1
0.25
0.067
3.73
Na-2
0.23
0.073
3.15
Na-3
0.50
0.024
20.83
Na-4
1.68
0.048
35
Do-2
1.94
0.014
138.57
Bd-2
2.7
0.029
93.10
Kç-5
2.18
0.027
80.74
Ad-3
1.44
0.015
96
Br-2
1.7
0.0174
97.70
Br-5
1.68
0.284
5.91
Br-6
1.81
0.0323
56.03
UL-2
0.73
0.2574
2.83
UL-3
1.06
0.455
2.32
Yn-1
0.28
0.0035
80
Yn-4
0.35
0.0229
15.28
Data related to type of organic matter indicate that it
temporally and spatially changed according to conditions
in the organic facies.
5.3. Maturity of organic matter
Organic matter maturity is defined based on Rock-Eval
Tmax data (Peters and Moldowan, 1993; Peters et al., 2005),
on production index (PI) values (Tissot and Welte, 1984;
Waples, 1985; Anders, 1991; Peters and Moldowan, 1993),
and on vitrinite reflectance (Ro) measurements (Tissot and
Welte, 1984; Espitalié et al., 1985).
Tmax values for Küçükkuyu samples range (except one,
607 °C) between 414 and 496 °C in the north and between
423 and 446 °C in the south. These values indicate that the
level of organic maturity is in general immature or earlymid-mature (beginning of the oil window or probably
within the oil window). Although most of the Tmax values
of the Küçükkuyu Formation samples indicate early-
364
mature to mature character, immature and overmature
values were also measured. According to Çiftçi et al. (2004),
this area is affected by an intense Neogene volcanism that
is partly synchronous and postdates the deposition of the
lacustrine Küçükkuyu Formation. Therefore, overmature
values may be related to thermal stress caused by this
volcanism.
The average PI values for the Küçükkuyu Formation
are 0.11 and 0.02, respectively. PI values of less than 0.1
are indicators for the immature zone (Anders, 1991; Peters
and Moldowan, 1993). Ro (vitrinite reflectance) values
of analyzed samples vary between 0.40% and 1.73%. The
average value is 0.78 % (Table 3), which indicates mostly
an early-mature stage.
Based on the CPI for the n-alkanes, values around 1 are
mature and values of <1 are early-mature. The CPI values
for the Küçükkuyu samples are between 0.96 and 1.69.
The maturation of the samples ranges from early mature
to mature.
Other thermal maturity indicators based on biomarkers
are 22S/(22S + 22R) homohopane and 20S/(20S + 20R)
and ββ/(ββ + αα) sterane ratios (Seifert and Moldowan,
1986; Waples and Machihara, 1991; Peters and Moldowan,
1993; Hunt, 1995). Analyzed samples have C32 22S/(22S +
22R) ratios in the range of 0.40–0.58 with an average of
0.50 (Table 7), suggesting that these samples are earlymature.
The moretane/hopane ratio can be also used as a
maturity indicator. This ratio decreases from about 0.8 to
0.15–0.05 as the thermal maturity increases (Mackenzie
et al., 1980; Seifert and Moldowan, 1980). Küçükkuyu
samples have 0.13 to 0.37 moretane/hopane ratios with an
average of 0.30, which also suggests that the samples are
immature.
5.4. Depositional environment
According to previous studies the formation was deposited
in a lacustrine environment (Saka, 1979; Siyako et al., 1989;
Kesgin, 2001; Yılmaz and Karacık, 2001; Beccaletto, 2004;
Çiftçi et al., 2004; Beccaletto and Steiner, 2005; Bozcu,
2015). It was argued by Siyako et al. (1989) and Yılmaz et
al. (2001) that volcanism developed simultaneously with
lacustrine sediments. Therefore, volcanic and lacustrine
sediments have interfingering contacts. According to
Yılmaz et al. (2001), magmatism related to collision took
place in northwestern Anatolia in the Oligocene-Late
Miocene period and the plutonics-volcanics widespread
in the region are products of this magmatism. Lacustrine
basins existed in depressions controlled by N-S faults,
which were active simultaneously with the magmatism.
On the other hand, Cavazza et al. (2009) stated that the
Kazdağ Massif was exhumed in three stages as a result
of N-S extension and the Küçükkuyu Formation was
deposited during the first stage. Consequently, it was
BOZCU / Turkish J Earth Sci
pA
500
n-C14
400
400
300
200
20
0
100
n-C35
n-C33
n-C34
Pristan
Phytane
100
n-C12
CS2
n-C13
200
n-C32
n-C31
300
Kç-5
pristane
8
phytane
600
n-C30
700
pA
n-C15
n-C16
n-C17
n-C18
n-C19
n-C20
n-C21
n-C22
n-C23
n-C24
n-C25
n-C26
n-C27
n-C28
n-C29
Do-2
40
60
80
100
120
140
min
0
20
40
60
80
100
120
140
min
pA
700
Y-2
7
500
8ph
600
400
300
200
100
min
UL-3
7
pristane
8
Br-5
Figure 7. Gas chromatograms of selected shale samples from the Küçükkuyu Formation.
deposited in a lacustrine, fault-controlled basin. Field data
also support this idea (Figure 10).
The Kızılyar Conglomerate at the lower level of the unit
consists of fault scarp fan (debris flow) and braided river
sediments on basement rock (Figure 10a). The geometry of
the unit and arrangement with sorting and rounding of the
gravels indicate a high-energy environment. Alternating
sandstone-shale in the middle part of the formation
365
BOZCU / Turkish J Earth Sci
Table 6. Parameters of gas chromatography for the Küçükkuyu
Formation samples (*: from Bozcu, 2015). CPI was calculated
using the equation of Bray and Evans (1961).
Sample
Pr/Ph
Pr/n-C17
Ph/n-C18
CPI 25–33
Do-2
1.01
0.21
0.19
1.00
Kü-11*
1.42
0.25
0.16
1.24
Ad-3
1.18
1.25
0.90
-
Kç-5
1.02
1.27
1.04
1.3
Y-2*
1.13
1.70
1.39
1.67
Br-5
1.30
3.30
2.35
0.96
UL-3
0.22
1.07
3.70
1.19
Hi-01
0.97
3.37
3.66
1.33
Ş-07
1.32
2.21
1.29
1.26
Şr-6
1.08
1.19
0.96
1.69
includes turbiditic current structures. The basin in which
the formation was deposited had a slope that allowed
turbidity currents to occur. Slump structures, boudinaged
sandstone layers, and mud dykes frequently exist in the
unit and indicate tectonic activity during deposition of the
unit (Figure 10b).
Subsequent to the end of the regressive deposition of the
formation, an extensional tectonic regime (development
of detachment: Okay and Satır, 2000; Cavazza et al.,
2009), causing the exhumation of Kazdağı, began during
the Late Miocene-Early Pliocene. In this period volcanic
activity was renewed and new depositional environments
are formed. The İlyasbaşı Formation was deposited
synchronously with volcanic activity in this period (Figure
10c). Sediments from this basin are presently observed in
grabens bounded by E-W trending faults (Figure 10d).
The depositional environment of the Küçükkuyu
Formation is also evaluated using the organic geochemical
data, namely δ13C values, TOC/TS ratios, and biomarker
distributions.
According to Meyers (1997), carbon isotopic ratios
can be used to distinguish between marine organisms
and continental plants as sources of sedimentary organic
matter and to identify organic matter from different types
of land plants. Organic matter produced from atmospheric
CO2 by land plants using the C3 pathway has an isotopic
composition of –34‰ to –24‰, averaging –27‰, δ13C
(PDB) value, and by those using the C4 pathway has –19‰
to –6‰, averaging –14‰, (O’Leary, 1988; Meyers and
Ishiwatari, 1993; Meyers, 1994, 1997). Freshwater algae
use dissolved CO2, which is usually in isotopic equilibrium
with atmospheric CO2, whereas under saline water
conditions, plants use the C4 photosynthetic pathway.
δ13C values of typical lake algae in fresh water range from
–30‰ to –25‰. Therefore, organic matter derived from
algae in lakes is isotopically indistinguishable from organic
matter derived by C3 plants in the surrounding watershed
(Meyers, 1997, 2003). Marine organic matter typically has
δ13C values between –20‰ and -22‰ and organic matter
in lacustrine sediments is mainly derived from terrestrial
and aquatic primary production (Meyers, 1994, 2003). The
δ13C values of organic matter in Küçükkuyu samples range
Figure 8. Cross plot of Pr/nC17 versus Ph/nC18 for the Küçükkuyu shale samples (fields
after Peters et al., 2005).
366
BOZCU / Turkish J Earth Sci
18
Do-2
m/z 191
23
5
9 10
8
910
8
2
2526
24 29
30
7
m/z 217
21
1
19
6
3
Do-2
4
14
13
12
5
3
11
16
15
17 1820
19
23
14
13
6 7
22
24
25
2
Kç-5
Kç-5
23
21
18
19 24
14
12
3 5
6 7 8910
21
13
16R
Y-2
11
25
17
26
27
29
2830 31
32 33
34 3536
18
8
2 3 45
1
7
20
19
1415
9
16
10 1213
Y-2
23
23
22 24
25
21
11
18
14
19
20
24
25
26
30 3132
28
3334
3536
8
3
12R13
1 2 4 56 7 910 11R 16R
Br-5
17
8
2729
18
20
15
1
2 3 45
16
9
10 1213 14
222324
Br-5
23
21
11
18 24
20 26
14 19 2527
1 2 3 56
8910
UL-3
13
12S 16R
12R
2830
29
20
17
18
8
3132 3334 3536
23
1
2 3 45
1516
9 1213 14
6 7 10
24
UL-3
21
11
2 3 56
8
18 24
21 2627
14 19 25
2830
1316R
29 32
31 3334 35 36
17
1
2 3 45
8
15
9
14
1213 16
10
7
20
25
18
22
2324
Figure 9. m/z 191 and m/z 217 fragmentograms showing the distribution of terpanes and steranes for selected shale samples from the
Küçükkuyu Formation.
367
BOZCU / Turkish J Earth Sci
Table 7. Biomarker composition based on m/z 191 and m/z 217 mass chromatograms and calculated parameters.
Sample
1
2
3
4
5
6
7
8
9
10
Do-2
0.4
1.4
1.6
0.22
0.13
-
0.58
1.07
0.45
1.09
Kç-5
0.86
0.71
0.10
0.26
0.33
0.49
0.57
0.50
0.28
0.35
Y-2
0.82
0.57
0.04
0.25
0.37
1.06
0.53
0.23
0.02
0.39
UL-3
-
0.33
0.01
0.22
0.35
0.97
0.40
0.40
0.17
0.92
Br-5
0.75
0.21
0.01
0.27
0.35
1.01
0.43
0.46
0.92
0.77
1- C24/C26(S+R): C24 tetracyclic/[C26tricyclic(S+R)]; 2- NH/H:C29 norhopane/C30 hopane; 3- C23/C30H:C23 tricyclic terpane/C30 hopane;
4- C3122R/H: C3122R/C30hopane; 5- moretane/hopane ratio; 6- C35(R+S)/C34(R+S); 7- C32 22S/(22S+22R); 8- Ts/Tm; 9- C2920S/
(20S+20R); 10- sterane/hopane ratio.
from –26.15‰ to –30.50‰ and indicate that organic
matter may have been derived from both terrestrial plants
and aquatic organic matter (Table 4).
The TOC (%) to TS (%) ratio of fine-grained sediments
is a proxy to distinguish oxic-anoxic and marine-freshwater
depositional environments (Leventhal, 1983; Berner,
1984). Marine samples have low values (0.5–5), while
samples deposited in fresh-water have high values (>10)
(Berner and Raiswell, 1984). TS analysis was performed
on 24 samples from the Küçükkuyu Formation (Table 5;
Figure 11). The values for the samples here are generally
>10, indicating that they were deposited in a lacustrine
freshwater environment with slight marine input or
occasionally brackish conditions.
GC analysis can also be used to assess depositional
conditions and the organic matter origin of source rock
(Tissot and Welte, 1984; Moldowan et al., 1985; Killops
and Killops, 1993; Hunt, 1995). The pristane/phytane (Pr/
Ph) ratio is commonly used. Low Pr/Ph ratios (<1) are
considered to be indicative of anoxic environments, high
values (>1) indicate oxic environments, and ratios between
1 and 3 are indicative of oxic to suboxic environments.
The Pr/Ph ratio is low here (0.22–1.42). Hence, it can be
interpreted that the depositional environment was anoxic
to suboxic.
The Pr/n-C17 versus Ph/n-C18 cross-plot (Figure 8) for
the Küçükkuyu samples shows that most of the samples
consist of mixed or terrestrial organic matter inputs and
were deposited in oxidizing conditions.
Biomarker characteristics also give information about
source rock depositional environments (Tissot and Welte,
1984; Waples and Machihara, 1991; Peters and Moldowan,
1993; Hunt, 1995; Peters et al., 2005). Sterane and
triterpene distributions recorded using m/z 217 and m/z
191 mass chromatograms (Volkman and Maxwell, 1986)
were examined to determine depositional environment
and parameters calculated from these distributions (Table 7).
The C27, C28, and C29 sterane distributions in analyzed
samples are similar (C29 > C27 > C28), except for one (C27
368
> C29 > C28). The relative abundances of C27, C28, and C29
steranes are used to define the source of the organic matter
(Huang and Meinschein, 1979; Moldowan et al., 1986;
Peters et al., 2005). The C27 steranes mainly derive from
phytoplankton (mainly algae), C28 steranes derive from
specific phytoplankton types, and C29 steranes derive from
terrestrial higher plants. Furthermore, C27 and C28 steranes
may also derive from algae within lacustrine or marsh
environments. Volkman (1986) stated that low C28 levels
are typical of limnic environments. The dominance of C29
steranes shows mainly terrestrial OM contribution for the
Küçükkuyu samples. The source of organic matter for one
sample (Br-5) is dominantly algae, with less terrestrial
plants.
The relative abundance of steranes to hopanes can be
evaluated as an indicator for organic matter composition.
Low sterane/hopane ratios suggest a terrigenous and/or
microorganism-reworked organic matter source (Tissot
and Welte, 1984), while high sterane/hopane ratios (>1)
point to aquatic algae observed in many marine and
evaporitic deposits (Moldowan et al., 1985; Fu et al., 1990).
Sterane/hopane ratios of the Küçükkuyu samples range
from 0.35 to 1.09, indicating mainly terrigenous with less
aquatic algal organic matter source.
The C35 (R+S) / C34 (R+S) ratio is an indicator of
depositional conditions. A C35 (R+S) / C34 (R+S) ratio
of <1 indicates suboxic conditions; >1 indicates anoxic
conditions (Peters and Moldowan, 1991). These ratios are
0.49 to 1.06 for the Küçükkuyu samples (Table 7), indicating
mostly anoxic conditions. The Ts/Tm ratio may reflect oxic
or anoxic environmental conditions during deposition.
Low Ts/Tm (<1) may indicate anoxic conditions (McKirdy
et al., 1983). This ratio in the Küçükkuyu Formation ranges
from 0.23 to 1.07 and indicates mostly anoxic conditions.
Gammacerane is a biomarker pointing out reducing
and hypersaline depositional conditions. It is commonly
available in hypersaline marine and nonmarine
depositional environments (Moldowan et al., 1985; Fu
et al., 1986; Peters and Moldowan, 1993). However, high
BOZCU / Turkish J Earth Sci
Table 8. Peak definitions of steranes in the m/z 217 mass chromatograms.
Peak
Compound
1
C19 Tricyclic terpane
2
C20 Tricyclic terpane
3
C21 Tricyclic terpane
4
C22 Tricyclic terpane
5
C23 Tricyclic terpane
6
C24 Tricyclic terpane
7
C25 (22S+22R) Tricyclic terpane
8
C24 Tetracyclic hopane (Seco)
9
C26 22(S) Tricyclic terpane
10
C26 22(R) Tricyclic terpane
11R
C28Tricyclic terpane (R)
11S
C28 Tricyclic terpane (S)
12R
C29 Tricyclic terpane (R)
12S
C29 Tricyclic terpane (S)
13
C27 18α (H)-22,29,30-Trisnorhopane (Ts)
14
C27 17α (H)-22,29,30-Trisnorhopane (Tm)
15
17α (H)-29,30-Bisnorhopane
16
C30 Tricyclic terpane
17
17α (H)-28,30-Bisnorhopane
18
C29 17α (H), 21β (H)-30-Norhopane
19
C29 Ts(18α(H)-30-Norhopane
20
C30 (17α(H)-Diahopane)
21
C29 17β (H), 21α (H)-30 Normoratene
22
Oleanane
23
C30 17α (H), 21β (H)-Hopane
24
C30 17β (H), 21α (H)-Moretane
25
C31 17α (H), 21β (H)-30-Homohopane (22S)
26
C31 17α (H), 21β (H)-30-Homohopane (22R)
27
Gammacerane
28
Homomoretane
29
C32 17α (H), 21β (H)-30,31-Bishomohopane (22S)
30
C32 17α (H), 21β (H)-30,31-Bishomohopane (22R)
31
C33 17α (H), 21β (H)-30,31,32- Trishomohopane (22S)
32
C33 17α (H), 21β (H)-30,31,32- Trishomohopane (22R)
33
C34 17α (H), 21β (H)-30,31,32,33 Tetrakishomohopane (22S)
34
C34 17α (H), 21β (H)-30,31,32,33 Tetrakishomohopane (22R)
35
C35 17α (H), 21β (H)-30,31,32,33,34 Pentakishomohopane (22S)
36
C35 17α (H), 21β (H)-30,31,32,33,34 Pentakishomohopane (22R)
369
BOZCU / Turkish J Earth Sci
Table 9. Peak definitions of terpanes in the m/z 191 mass chromatograms.
Peak
Compound
1
C2713β (H),17α (H)-Diasterane (20S)
2
C2713β (H),17α (H)-Diasterane (20R)
3
C2713α (H),17β (H)-Diasterane (20S)
4
C2713α (H),17β (H)-Diasterane (20R)
5
C2813β (H),17α(H)-Diasterane (20S)
6
C2813β (H),17α(H)-Diasterane (20R)
7
C2813α (H),17β (H)-Diasterane (20S)
8
C27 5α (H), 14α (H),17α(H)-Sterane (20S)+C28 13α (H), 17β (H)-Diasterane (20S)
9
C27 5α (H),14β (H),17β (H)-Sterane (20R)+C29 13β (H), 17α (H)-Diasterane (20S)
10
C27 5α (H), 14β (H),17β(H)-Sterane (20S)+C28 13α (H), 17β (H)-Diasterane (20R)
11
C27 5α (H), 14α (H),17α(H)-Sterane (20R)
12
C29 13β (H), 17α (H)-Diasterane (20R)
13
C29 13α (H), 17β(H)-Diasterane (20S)
14
C28 5α (H), 14α (H),17α(H)-Sterane (20S)
15
C28 5α (H), 14β (H),17β(H)-Sterane (20R) + C29 13α (H), 17β(H)-Diasterane (20R)
16
C28 5α (H), 14β (H),17β(H)-Sterane (20S)
17
C28 5α (H), 14α (H),17α(H)-Sterane (20R)
18
C295α (H), 14α (H),17α(H)-Sterane (20S)
19
C29 5α (H), 14β (H),17β(H)-Sterane (20R)
20
C29 5α (H), 14β (H),17β(H)-Sterane (20S)
21
C295α (H), 14α (H),17α(H)-Sterane (20R)
22
C305α (H), 14α (H),17α(H)-Sterane (20S)
23
C305α (H), 14β (H),17β (H)-Sterane (20R)
24
C305α (H), 14β (H),17β(H)-Sterane (20S)
25
C305α (H), 14α (H),17α(H)-Sterane (20R)
gammacerane contents are also present in freshwater
lacustrine sediments. Sinninghe Damsté et al. (1995)
suggested that gammacerane is in fact an indicator for
water column stratification. Gammacerane occurs in small
amounts in the Küçükkuyu Formation samples.
The C31 R homohopane/C30 hopane ratio is also used
to distinguish between marine and lacustrine source
rock environments. In lacustrine source rocks, the ratio
is <0.25 (Peters et al., 2005). This ratio is 0.22 to 0.27 for
the Küçükkuyu samples (Table 7), indicating a mostly
lacustrine depositional environment.
According to Katz (1990), paleoclimate and
paleogeography are very important factors to control
the distribution of lake bodies and influence the water
chemistry. Palynomorph assemblages of the Küçükkuyu
formation from the northern outcrops (det. Assoc
Prof MS Akkıraz, Dumlupınar University, Turkey) are
characterized predominantly by conifer Pinaceae forms
370
indicating higher topography paleogeographically. Pinus
diploxylon type, P. haploxylon type, Cathaya, Picea, Abies,
Larix, Tsuga, Keteeleria, and Fagus plants are common in
higher areas. In lower topographical areas CyrillaceaeClethraceae, Engelhardia, Tilia, Cycadaceae, and
Oleaceae plants are present in minor percentages. Carya,
Cupressaceae, Myricaceae (Triatriopollenites rurensis and
T. bituitus), and Sparganiaceae plants are found in freshwater swamp. Based on these results, intensive vegetation
was at the edge of the basin in a mountain area. Intensive
development of vegetation indicates that the climate was
hot and rainy. Arid climate markers of Artemisia, Ephedra,
and Chenopodiaceae forms are found in minor amounts.
The presence of these forms shows that some local areas
were arid in the region.
Beccaletto (2004) and Beccaletto and Steiner (2005)
indicate that palynomorph assemblages from the base of
the intermediate member of the Küçükkuyu Formation
BOZCU / Turkish J Earth Sci
NNE
Debris flow and
fluvial systems
SSW
İlyasbaşı form.
(Late Mio.-Pliocene)
Küçükkuyu form.
Lake
a
Unconformity
Sandstone, shale, tuff
(Early-Mid. Miocene)
Conglomerate
Doyran volcanics
Andesite, dacite
Çetmi oph. melange
Serpentinite, chert, mudstone
Kazdağ metamorphics
Gneiss, marble, schist
(Oligo-Miocene)
(Upper Cretaceous)
Early Miocene
Conglomerate, mudstone
SW
NE
Lake level
b
no scale
Early-Middle Miocene
Kazdağ
NE
SW
Bayramiç Graben
Edremit Graben
0m
c
no scale
Late Miocene-Early Pliocene
N
S
Kazdağ
1769
Edremit Graben
Bayramiç
graben
Edremit Gulf
İlyasbaşı / Mutlu form.
no scale
Kozakdağ
d
Arıklı tuff
Küçükkuyu form.
Kızılyar conglomerate
Northern area
Southern area
Doyran volcanics
Yuntdağ volcanics
Çetmi Oph. melange
Kozak pluton
Kazdağ group
Karakaya complex
Figure 10. Depositional environment of the Küçükkuyu Formation. a) Schematic block diagram showing the basin in which the
Küçükkuyu Formation was deposited; b) – c) Schematic geological cross-sections showing depositional model of the Küçükkuyu
Formation and İlyasbaşı Formation; d) Schematic geological cross-section of the basin with Neogene-age units in the Edremit Gulf
and surroundings (Early Miocene to present day).
371
BOZCU / Turkish J Earth Sci
Figure 11. TOC (%) – TS (%) diagram (Berner, 1984).
demonstrate a fresh-brackish water environment
representing a lacustrine environment. Conifers and
deciduous forests (pollens of pine, cypress, oak, etc.) are
present near the environment. This result is consistent
with the palynomorph assemblages mentioned above.
Oleanane is a biomarker derived from angiosperms
(Rullkötter et al., 1994; Bechtel et al., 2005). The absence of
oleanane indicates that the source rocks were deposited far
from angiosperm input (Moldowan et al., 1994). Oleanane
has not been observed in the Küçükkuyu samples. This is
consistent with the palynomorph assemblages that have
been determined.
Carroll and Bohacs (2001) noted that no typical
lacustrine source rocks and oils exist and lacustrine source
rocks display a high degree of geochemical heterogeneity
relative to marine facies. Powell (1986) stated that
hydrocarbon lacustrine source rocks have organic carbon
values ranging from <1% to >20% and Type I to Type III
kerogen. The organic matter can be of land plant, algal,
and bacterial origins.
Based on these data, it has been determined that the
Küçükkuyu Formation was deposited in a fresh-water
or slightly raised salinity (brackish-water) lacustrine
environment indicating anoxic and suboxic conditions.
5.5. Hydrocarbon generation potential
Hydrocarbon source rock potential was evaluated using
the pyrolysis data (TOC, HI, S1, S2, and PY). Based on
Tissot and Welte (1984), rocks with TOC values higher
than 0.5 wt.% can be regarded as potential source rock for
oil and gas. In this study, the Küçükkuyu Formation shales
372
have averages greater than 1% TOC, indicating a good
generative potential.
S2 (pyrolyzed hydrocarbons) can also be used to
evaluate hydrocarbon-generating potential of source rocks
(Peters, 1986; Bordenave, 1993). S2 yields of more than
4.0 mg HC/g rock are generally accepted as a sign of good
hydrocarbon source rocks (Bordenave, 1993). Most of the
analyzed samples have S2 values greater than 4.0 mg HC/g
rock. Thus, Rock-Eval pyrolysis S2 yields indicate that most
samples have fair to good hydrocarbon generation potential.
The Rock-Eval pyrolysis parameters S1 and S2 can
also be used to determine the source rock potential
(Tissot and Welte, 1984). Most of the potential yield (PY
= S1 + S2) values of the samples are >2.0 mg HC/g rock,
which represents fair to good hydrocarbon generation
potential. On a diagram of TOC versus S2 (Figure 12), the
Küçükkuyu samples plot in fields representing poor, fair,
good, and excellent hydrocarbon source rock potential.
These differences are probably an indication that the source
rock potential of the unit is varying depending on time and
location. Considering the maturity (in general immature
and/or early-mature), the hydrocarbon potential of the
Küçükkuyu formation is limited. On a plot of HI versus
TOC, the Küçükkuyu shale samples are dispersed in gas/oil
sources and fair oil source areas (Figure 13).
6. Conclusions
Based on the geological and geochemical results, the
source rock characterization, depositional conditions, and
hydrocarbon potential of the Küçükkuyu Formation have
been addressed.
BOZCU / Turkish J Earth Sci
Figure 12. The distribution of the Küçükkuyu samples on a plot
of TOC versus Rock-Eval S2 (source rock classification diagram
after Dembicki, 2009).
The TOC content of the Küçükkuyu Formation in the
north and south of the Edremit Gulf Basin ranges from
0.23 to 6.1 wt.% (average: 1.76 wt.%) and 0.24 to 2.82 wt.%
(average: 1.66 wt.%) respectively and points to a generally
fair to good source rock.
Rock-Eval pyrolysis data show that the organic matter
in the Küçükkuyu Formation contains mainly Type II–
III (oil- and gas-prone) kerogen, with minor Type I (oilprone) kerogen. The C27, C28, and C29 sterane distributions
of the samples are similar (C29 > C27 > C28), except for one.
This suggests that the organic matter sources are controlled
by aquatic and terrestrial higher plants.
Tmax, PI, Ro, GC, and biomarker data suggest that
the organic maturity level of the Küçükkuyu Formation
samples correspond to immature or to an early-middle
maturity stage.
Biomarker parameters, δ13C values, and TOC/TS ratios
suggest that the Küçükkuyu samples were deposited in a
mainly freshwater lacustrine depositional environment
indicating in general anoxic and suboxic conditions. The
presence of gammacerane in the Küçükkuyu samples
indicates slightly raised salinity or brackish-water
conditions developing from time to time.
With regard to hydrocarbon-generating potential,
most of the Küçükkuyu Formation shales have fair to good
Figure 13. The distribution of the Küçükkuyu samples on a plot
of TOC versus Rock-Eval HI (plot after Jackson et al., 1985).
hydrocarbon potential based on TOC contents, S2, and
PY values. According to the HI versus TOC plot, most of
the Küçükkuyu shale samples have fair oil and less gas/oil
sources. However, the hydrocarbon potential of the study
area is limited because these potential source rocks are in
general immature and/or early-mature.
Acknowledgments
This study was supported by the Scientific and
Technological Research Council of Turkey (TÜBİTAK,
Project Number: 113Y033). Some of the analyses
belong to different projects that were supported by the
Çanakkale Onsekiz Mart University Scientific Research
Foundation (ÇOMÜ-BAP, Project Numbers: 2007/46,
2009/22, 2010/159). Analyses were performed in the
Organic Geochemistry Laboratory, Turkish Petroleum
Corporation (TPAO). The author thanks these
organizations for their support. The author also thanks
Dr Mustafa Bozcu for assistance during field work and
Gülşah Durak for plotting graphs in the manuscript.
The author is also grateful to the subject editor and both
anonymous reviewers for their time and constructive
suggestions.
373
BOZCU / Turkish J Earth Sci
References
Akyürek B, Soysal Y (1981). Main geological features of the area south
of Biga Peninsula (Savaştepe-Kırkağaç-Bergama-Ayvalık).
MTA Bulletin 95/96: 1-12 (in Turkish with English abstract).
Anders D (1991). Geochemical exploration methods. In: Merril
RK, editor. Source and Migration Processes and Evaluation
Techniques. AAPG Treatise of Petroleum Geology, Handbook
of Petroleum Geology. Tulsa, OK, USA: AAPG, pp. 89-95.
Aytepe Ç (2010). An investigation of petroleum source rock
characteristics and depositional conditions of Küçükkuyu
Formation (South of Edremit Gulf). MSc, Çanakkale Onsekiz
Mart University, Çanakkale, Turkey (in Turkish with English
abstract).
Beccaletto L (2004). Geology, correlations and geodynamic evolution
of the Biga Peninsula (NW Turkey). PhD, University of
Lausanne, Lausanne, Switzerland.
Beccaletto L, Steiner C (2005). Evidence of two-stage extensional
tectonics from the northern edge of the Edremit Graben, NW
Turkey. Geodin Ac 18: 283-297.
Bechtel A, Sachsenhofer RF, Zdravkov A, Kostova I, Gratzer R
(2005). Influence of floral assemblage, facies and diagenesis on
petrography and organic geochemistry of the Eocene Bourgas
coal and the Miocene Maritza-East lignite (Bulgaria). Org
Geochem 36: 1498-1522.
Berner RA (1984). Sedimentary pyrite formation: an update. Geochim
Cosmochim Ac 48: 605-615.
Berner RA, Raiswell R. (1984). C/S method for distinguishing
freshwater from marine sedimentary rocks. Geology 12: 365368.
Bingöl E (1968). Contribution a l’etude geologique de la partie centale
et SE du massif de Kazdağ (Turquie). PhD, Université De Nancy,
Nancy, France (in French).
Bingöl E, Akyürek B, Korkmazer B (1975). Geology of the Biga
Peninsula and some characteristics of the Karakaya Formation.
In: Proceedings of the 50th Anniversary of Turkish Republic
Earth Sciences Congress. Ankara, Turkey: MTA Publications,
pp. 70-75.
Bingöl E, Delaloye M, Ataman G (1982). Granitic intrusion in
Western Anatolia: a contribution to the geodynamic study of
this area. Eclogae Geol Helv 75: 437-446.
Birkle P, Satir M (1995). Dating, geochemistry and geodynamic
significance of the Tertiary magmatism of the Biga peninsula,
NW-Turkey. In: Geology of the Black Sea Region; Proceedings
of the International Symposium on the Geology of the Black
Sea Region, 7–11 September 1992, Ankara, Turkey, pp. 171-180.
Bray EE, Evans ED (1961). Distribution of n-paraffins as a clue for
recognition of source beds. Geochim Cosmochim Ac 22: 2-15.
Bozcu A, Bozcu M, Durak G (2014). Hydrocarbon potential of
tertiary deposits in the Biga Peninsula (around Edremit Gulf)
and Gökçeada. Ankara, Turkey: TUBİTAK Project Report No.
113Y033 (in Turkish with English abstract).
Carroll AR, Bohacs KM (2001). Lake-type controls on petroleum
source rock potential in nonmarine basins. AAPG Bull 85:
1033-1053.
Cavazza W, Okay AI, Zattin M (2009). Rapid early-middle Miocene
exhumation of the Kazdağ Masif (western Anatolia). Int J
Earth Sci 98: 1935-1947.
Çiftçi NB, Temel RÖ, İztan H (2010). Hydrocarbon occurrences in
western Anatolian (Aegean) graben basins, Turkey: is there a
working petroleum system? AAPG Bull 94: 1827-1857.
Çiftçi NB, Temel RÖ, Terzioğlu MN (2004). Neogene stratigraphy
and hydrocarbon system of the region surrounding the Gulf
of Edremit, NW Turkey. TAPG Bulletin 16: 81-104 (in Turkish
with English abstract).
Cranwell PA, Eglinton G, Robinson N (1987). Lipids of aquatic
organisms as potential contributors to lacustrine sediments. II.
Org Geochem 11: 513-527.
Delaloye M, Bingöl E (2000). Granitoids from western and
northwestern Anatolia: geochemistry and modeling of
geodynamic evolution. Int Geol Rev 42: 241-268.
Dembicki H Jr (2009). Three common source rock evaluation errors
made by geologists during prospect or play appraisals. AAPG
Bull 93: 341-356.
Dow WG (1977). Kerogen studies and geological interpretations. J
Geochem Exp 7: 79-99.
Duru M, Pehlivan Ş, Şentürk Y, Yavaş F, Kar H (2004). New results on
the lithostratigraphy of the Kazdağ Massif in northwest Turkey.
Turkish J Earth Sci 13: 177-186.
Eglinton G, Hamilton RJ (1967). Leaf epicuticular waxes. Science
156: 1322-1335.
Ercan T, Satır M, Steinitz G, Dora A, Sarıfakıoğlu E, Adis C, Walter
HJ, Yıldırım T (1995). Characteristics of the Tertiary volcanism
in the Biga Peninsula, Gökçeada, Bozcaada and Tavşanadası,
NW Anatolia. MTA Bulletin 17: 55-86 (in Turkish).
Espitalié J, Laporte JL, Madec J, Marquis F, Leplat P, Paulet J, Boutefeau
A (1977). Méthode rapide de caractérisation des roches méres
de leur potential pétrolier et de leur degré d‘évolution. Revue
d’IFP 32: 23-42 (in French).
Espitalié J, Deroo G, Marquis F (1985). La pyrolyse Rock Eval et ses
applications. Revue d’IFP 10: 755-784 (in French).
Bordenave, ML (1993). Applied Petroleum Geochemistry. Paris,
France: Editions Technip.
Ficken KJ, Li B, Swain DL, Eglinton G (2000). An n-alkane proxy
for the sedimentary input of submerged/floating freshwater
aquatic macrophytes. Org Geochem 31: 745-749.
Bozcu A (2015). Source rock potential of Lower-Middle Miocene
lacustrine deposits: example of the Küçükkuyu Formation, NW
Turkey. Oil Shale 32: 313-334.
Fu JM, Shen GY, Peng, PA, Brassell SC, Eglinton G, Jiang JG (1986).
Peculiarities of salt lake sediments as potential source rocks in
China. Org Geochem 10: 119-126.
374
BOZCU / Turkish J Earth Sci
Fu JM, Shen GY, Xu JY, Eglinton G, Gowar, AP, Jia RF, Fan SF, Peng,
PA (1990). Application of biological markers in the assessment
of paleoenvironments of Chinese nonmarine sediments. Org
Geochem 16: 769-779.
Huang WY, Meinschein WG (1979). Sterols as ecological indicators.
Geochim Cosmochim Ac 43: 739-745.
Hunt JM (1995). Petroleum Geochemistry and Geology. New York,
NY, USA: WH Freeman and Company.
İnci U (1984). The stratigraphy and organic properties of Demirci
and Burhaniye bituminous shales. Bulletin of the Geological
Congress of Turkey 5: 27-40 (in Turkish with English abstract).
Jackson KS, Hawkins PJ, Bennett AJR (1985). Regional facies and
geochemical evolution of the southern Denison Trough. APEA
Journal 20: 143-158.
Katz BJ (1990). Controls on distribution of lacustrine source rocks
through time and space. In: Katz BJ, editor. Lacustrine Basin
Exploration—Case Studies and Modern Analogs, Vol. 50.
Tulsa, OK, USA: AAPG Memoirs, pp. 61–76.
Kesgin Y (2001). Tertiary geology and sedimentology of the
northeastern Aegean offshore and nearshore regions. PhD,
Ankara University, Ankara, Turkey (in Turkish with English
abstract).
Killops SD, Killops VJ (1993). An Introduction to Organic
Geochemistry. London, UK: Longman Group.
Leventhal JS (1983). Interpretation of carbon and sulfur relationships
in Black Sea sediments as indicator of environments of
deposition. Geochim Cosmochim Ac 47: 133-137.
Mackenzie AS, Patience RL, Maxwell JR, Vandenbrouke M Durand
B (1980). Molecular parameters of maturation in the Toarcian
shales, Paris Basin, France-I. Changes in the configurations of
acyclic isoprenoid alkanes, steranes and triterpanes. Geochim
Cosmochim Ac 44: 1709-1721.
McKirdy DM, Aldridge AK, Ypma PJM (1983). A geochemical
comparison of some crude oils from pre-Ordovician carbonate
rocks. In: Bjoroy M, Albrecht P, Cornford C, de Groot K,
Eglinton G, Galimov E, Laythaeuser D, Pelet R., Rullkötter J,
Speers G, editors. Advances in Organic Geochemistry 1981.
Chichester, UK: John Wiley & Sons, pp. 99-107.
Meyers PA (1994). Preservation of elemental and isotopic source
identification of sedimentary organic matter. Chem Geol 114:
289-302.
Meyers PA (1997). Organic geochemical proxies of paleoceanographic,
paleolimnologic, and paleoclimatic processes. Org Geochem
27: 213-250.
Meyers PA (2003). Applications of organic geochemistry to
paleolimnological reconstructions: a summary of examples
from the Laurentian Great Lakes. Org Geochem 34: 261-289.
Moldowan JM, Seifert WK, Gallegos EJ (1985). Relationship between
petroleum composition and depositional environment of
petroleum source rocks. AAPG Bull 69: 1255-1268.
Moldowan JM, Sundararaman P, Schoell M (1986). Sensitivity
of biomarker properties to depositional environment and/
or source input in the Lower Toarcian of SW-Germany. Org
Geochem 10: 915-926.
Okay AI, Satır M (2000). Coeval plutonism and metamorphism in
a latest Oligocene metamorphic core complex in northwest
Turkey. Geol Mag 137: 495-516.
Okay AI, Siyako M, Bürkan KA (1990a). Geology and tectonic
evolution of the Biga Peninsula. TAPG Bulletin 2: 83-121 (in
Turkish with English abstract).
Okay AI, Siyako M, Bürkan KA (1990b). Geology and Tectonic
Evolution of the Biga Peninsula. TPAO Technical Report No:
2746. Ankara, Turkey: TPAO (in Turkish).
O’Leary MH (1988). Carbon isotope in photosynthesis. Bioscience
38: 328-336.
Peters KE (1986). Guidelines for evaluating petroleum source rock
using programmed pyrolysis. AAPG Bull 70: 318-329.
Peters KE, Moldowan JM (1991). Effect of source, thermal maturity
and biodegradation on the distribution and isomerisation of
homohopanes in petroleum. Org Geochem 17: 47-61.
Peters KE, Moldowan JM (1993). The Biomarker Guide. Interpreting
Molecular Fossils in Petroleum and Ancient Sediments.
Englewood Cliffs, NJ, USA: Prentice Hall.
Peters KE, Walters CC, Moldowan, JM (2005). The Biomarker Guide.
Biomarkers and Isotopes in Petroleum Exploration and Earth
History. 2nd ed. Cambridge, UK: Cambridge University Press.
Rullkötter J, Peakman TM, TEN Haven H (1994). Early diagenesis
of terrigenous triterpenoids and its implications for petroleum
geochemistry. Org Geochem 21: 215-233.
Saka K (1979) Geology and Possibility of Edremit Gulf and
Surroundings of Neogene. TPAO Technical Report No: 1341.
Ankara, Turkey: TPAO (in Turkish).
Seifert WK, Moldowan JM (1986). Use of biological markers in
petroleum exploration. In: Johns RB, editor. Methods in
Geochemistry and Geophysics. Amsterdam, the Netherlands:
Elsevier, pp. 261-190.
Şengün F, Çalık A (2007). Metamorphic features and correlation
of the Çamlıca Metamorphics (Biga Peninsula, NW Turkey.
Bulletin of the Geological Congress of Turkey 50: 1-16 (in
Turkish with English abstract).
Şengün F, Yiğitbaş E, Tunç İO (2011). Geology and tectonic
emplacement of eclogite and blueschists, Biga peninsula,
northwest Turkey. Turkish J Earth Sci 20: 273-285.
Meyers PA, Ishiwatari R (1993). Lacustrine organic geochemistry
– an overview of indicators of organic matter sources and
diagenesis in lake sediments. Org Geochem 20: 867-900.
Sinninghe Damsté JS, Kenig F, Koopmans MP, Koster J, Schouten S,
Hayes JM, de Leeuw JW (1995). Evidence for gammacerane
as an indicator of water column stratification. Geochim
Cosmochim Ac 59: 1895-1900.
Moldowan JM, Dahl J, Huizinga, BJ, Fago, FJ, Hickey LJ, Peakman
TM, Taylor DW (1994). The molecular fossil record of oleanane
and its relation to angiosperms. Science 265: 768-771.
Siyako M, Bürkan KA, Okay AI (1989). Tertiary geology and
hydrocarbon potential of the Biga and Gelibolu Peninsulas.
TAPG Bulletin 1: 183-199 (in Turkish with English abstract).
375
BOZCU / Turkish J Earth Sci
Tissot BP, Welte DH (1978) Petroleum Formation and Occurrence.
1st ed. Berlin, Germany: Springer-Verlag.
Tissot BP, Welte DH (1984) Petroleum Formation and Occurrence.
2nd ed. New York, NY, USA: Springer-Verlag.
Volkman JK (1986). A review of sterol markers for marine and
terrigenous organic matter. Org Geochem 9: 83-99.
Volkman JK, Maxwell JR (1986). Acyclic isoprenoids as biological
markers. In: Johns RB, editor. Biological Markers in the
Sedimentary Record. Amsterdam, the Netherlands: Elsevier,
pp. 1-42.
Waples DW (1985). Geochemistry in Petroleum Exploration. Berlin,
Germany: Springer-Verlag.
376
Waples DW, Machihara T (1991) Biomarkers for Geologists-A
Practical Guide to the Application of Steranes and Triterpanes
in Petroleum Geology. Tulsa, OK, USA: AAPG Methods in
Exploration Series.
Yılmaz Y, Genç ŞC, Karacık Z, Altunkaynak Ş (2001). Two
contrasting magmatic associations of NW Anatolia and their
tectonic significance. J Geodyn 31: 243-271.
Yılmaz Y, Karacık Z (2001). Geology of the northern side of the Gulf
of Edremit and its tectonic significance for the development of
the Aegean grabens. Geodin Ac 14: 31-43.