Statistical evaluation of classification diagrams for altered igneous rocks
Bạn đang xem bản rút gọn của tài liệu. Xem và tải ngay bản đầy đủ của tài liệu tại đây (339.53 KB, 27 trang )
Turkish Journal of Earth Sciences (Turkish J. Earth Sci.), Vol. 19, 2010, pp. 239–265. Copyright ©TÜBİTAK
doi:10.3906/yer-0902-9
First published online 17 August 2009
Statistical Evaluation of Classification Diagrams
for Altered Igneous Rocks
SURENDRA P. VERMA1,*, RODOLFO RODRÍGUEZ-RÍOS2,1,†
& ROSALINDA GONZÁLEZ-RAMÍREZ3
1
Departamento de Sistemas Energéticos, Centro de Investigación en Energía,
Universidad Nacional Autónoma de México, Temixco, Mor. 62580, Mexico
(E-mail: )
2
(on sabbatical leave from) Facultad de Ingeniería e Instituto de Geología, Universidad Autónoma de
San Luis Potosí, Av. Dr. Manuel Nava No. 8, Zona Universitaria, San Luis Potosí, S.L.P. 78240, Mexico
3
Posgrado en Ingeniería – Energía, Centro de Investigación en Energía,
Universidad Nacional Autónoma de México, Temixco, Mor. 62580, Mexico
†
Deceased; July 27, 2009
Received 22 January 2009; revised typescript received 15 July 2009; accepted 27 July 2009
Abstract: The International Union of Geological Sciences (IUGS) has proposed recommendations for the classification
of relatively fresh volcanic rocks, but with no specific instructions for altered volcanic rocks, other than discouraging
the use of the total alkalis versus silica diagram. The Nb/Y-Zr/TiO2 diagram has been in use for the classification of
altered rocks now for over 30 years. Recently (during 2007) another diagram (Co-Th) has been proposed to replace this
old diagram, particularly for altered arc rocks. Using an extensive database of all kinds of relatively fresh rocks from
four tectonic settings (island arc, continental rift, ocean island, and mid-ocean ridge), as well as from three settings
excluding island arc, we carried out an objective evaluation of the old Nb/Y-Zr/TiO2 diagram for rock classification.
Similarly, for the evaluation of the new Co-Th diagram, an extensive database of similar rocks from island arcs, the
Andean active continental margin, continental rifts, ocean islands, and the Mexican Volcanic Belt, was used. Statistical
parameters of correct classification or success rate and minimum misclassification defined in this work, respectively,
were used to evaluate these diagrams. Our results of the quantification of these parameters showed that none of these
diagrams seems to work precisely for the classification of fresh rocks. It is therefore difficult to imagine that they would
work well for the classification of altered rocks. Thus, there is an urgent need to apply correct statistical methodology
for handling compositional data in proposing new classification diagrams that could provide classification and
nomenclature to altered volcanic rocks fully consistent with the IUGS nomenclature for fresh rocks.
Key Words: TAS classification, volcanic rocks, plutonic rocks, chemical classification, correct statistical analysis of
compositional data
Altere Magmatik Kayalar İçin Kullanılan Sınıflandırma Diyagramlarının
İstatistiksel Değerlendirmesi
Özet: Altere olmayan taze volkanik kayaların sınıflandırması için Uluslararası Jeoloji Bilimleri Birliği’nin (The
International Union of Geological Sciences, IUGS) önerdiği kayaların toplam alkali ve silis bileşimlerinin kullanımı
dışında, altere volkanik kayaların sınıflandırılmasında kullanılacak bir yönerge henüz bulunmamaktadır. Altere olmuş
volkanik kayaların sınıflandırılmasında son 30 yılı aşkındır Nb/Y-Zr/TiO2 diyagramı kullanılmaktadır. Son olarak
2007’de, bu diyagrama alternatif olarak altere volkanik kayaların Co ve Th içeriklerini kullanan başka bir diyagram
önerilmiştir. Bu çalışmada ada yayları, kıtasal riftler, okyanus adaları ve okyanus ortası sırtlar olmak üzere 4 farklı
tektonik ortamdan ve ayrıca ada yayları hariç olmak üzere 3 tektonik ortama ait tüm kaya çeşitlerinden elde edilen geniş
bir veri tabanı kullanılarak Nb/Y-Zr/TiO2 diyagramı değerlendirilmiştir. Yeni önerilen Co-Th diyagramını
değerlendirmek için, aynı yöntemle ada yaylarından, And-tipi aktif kıta kenarından, kıtasal riftlerden, okyanus
239
CLASSIFICATION DIAGRAMS
adalarından ve Meksika Volkanik Kuşağı’ından benzer kayalara ait veri tabanı kullanılmıştır. Doğru sınıflama veya
doğruluk oranı ve yanlış sınıflandırmalara yönelik istatistiksel parametreler tanımlanmış ve diyagramların
değerlendirmesinde kullanılmıştır. Bu parametrelerin sayısal sonuçları, bu diyagramlardan hiç birinin taze kayaların
sınıflandırılmasında kullanışlı olmadığını göstermiştir. Bu nedenle, altere kayalar için kullanışlı olmalarını beklemek
oldukça zordur. Böylece altere kayaların isimlendirmesi ve sınıflandırmasında, taze kayaların IUGS isimlendirmesiyle
uyumlu olacak şekilde kullanılabilecek yeni sınıflama diyagramlarının tasarımında kullanılacak doğru istatistiksel
yöntemlerin uygulanması gerekmektedir.
Anahtar Sözcükler: TAS sınıflandırması, volkanik kayalar, plütonik kayalar, kimyasal sınıflandırma, bileşimsel
verilerin doğru istatistiksel analizi
Introduction
Classification and nomenclature in any science are
fundamental issues, because the accuracy of the
language used for communication in that particular
science depends on them. For the classification of
relatively fresh igneous rocks, the International
Union of Geological Sciences (IUGS) has made
specific recommendations for assigning rock names
that depend on their mineralogical and chemical
characteristics (Le Bas et al. 1986; Le Bas 2000; Le
Maitre et al. 2002). The well-known TAS (total
alkalis versus silica; Le Bas et al. 1986) diagram seems
to be the most popular and widely used for the
classification of volcanic rocks. Verma et al. (2002)
presented a computer program (SINCLAS) to be
used for the IUGS volcanic rock classification
scheme, which facilitated the application of the TAS
diagram as well as providing a standard way of
calculating the CIPW norm (Verma et al. 2003). In
fact, the classification of volcanic rocks and their
nomenclature depend on both concepts – the TAS
diagram and the CIPW norm (Le Maitre et al. 2002;
Verma et al. 2002). However, the IUGS failed to
provide any specific recommendations for the
classification of altered rocks, other than
discouraging the use of their procedure for relatively
fresh rocks for this purpose (Le Bas et al. 1986).
In the published literature, some diagrams
(alternative to the TAS diagram) have long been
proposed, using the so-called immobile elements
(Floyd & Winchester 1975, 1978; Winchester &
Floyd 1976, 1977), which have been cited in
thousands of published papers. In fact, these
diagrams, particularly the Nb/Y–Zr/TiO2 diagram of
Winchester & Floyd (1977), have been in wide use
even today. Just to name a few references during
2007−2008, we can cite: Gökten & Floyd (2007);
240
Shekhawat et al. (2007); Ahmad et al. (2008); Bağcı et
al. (2008); Gladkochub et al. (2008); Gürsü (2008);
Kadir et al. (2008); Keskin et al. (2008); Kalmar &
Kovacs-Palffy (2008); Kaygusuz et al. (2008); Mondal
et al. (2008); Nardi et al. (2008); Pandarinath et al.
(2008); Wang et al. (2008); Yiğitbaş et al. (2008); and
Zheng et al. (2008). On the other hand, others, such
as Sheth & Melluso (2008), have used the SINCLAS
program for the TAS classification.
More recently, the subject of the classification of
altered rocks has been revived through the
publication of a paper by Hastie et al. (2007) who
stated that the existing diagrams did not work well
for arc rocks and proposed, more specifically, the use
of Co-Th diagram for the classification of altered
rocks from volcanic arcs.
The question arises if these older (Floyd &
Winchester 1975, 1978; Winchester & Floyd 1976,
1977) and the most recent (Hastie et al. 2007)
diagrams ‘correctly’ classify altered rocks. We cannot
precisely answer this question by studying altered
rocks because we do not know how much their
chemical composition was modified by alteration
processes in the field. We could, of course, resort to
experimental laboratory-controlled work to answer
it, which would also be costly, time consuming, and
difficult due to the multivariate nature of this
problem. Therefore, we adopted the philosophy of
objectively testing the functioning of these diagrams
using data for fresh volcanic rocks from different
areas and tectonic settings. If the classification
diagrams were shown to work well for fresh rocks,
i.e., if they showed that high percentages of fresh
rocks are named correctly and consistently with the
IUGS classification scheme (combination of the TAS
diagram and CIPW norm), we could expect that they
might work well for altered rocks as well, provided
S.P. VERMA ET AL.
that the concentrations of the chemical elements
used in these diagrams were not significantly
modified during the alteration. Thus, the
percentages of correct classification in such diagrams
would probably represent approximately the
maximum percentages of correct classification for
altered rocks.
With this philosophy in mind, the following
methodology was applied for the present evaluation:
(a) compile databases for fresh volcanic rocks from
different tectonic settings; (b) separate samples of a
given rock type from the compiled databases; (c) plot
samples of a particular rock type in the diagram to be
evaluated and determine the new rock names; (d)
count samples of each new rock name as classified in
the evaluated diagram; (e) calculate statistical
information about the percentages of each new rock
type in terms of the original samples of that
particular rock type being evaluated; (f) repeat this
procedure for all rock types from the IUGS
classification scheme; and (g) report the results in
figures and tables and point out their implications.
Specifically, two diagrams –the old Nb/Y–
Zr/TiO2 diagram of Winchester & Floyd (1977) and
the new Co-Th diagram of Hastie et al. (2007) – were
evaluated in detail. The results clearly show that
neither of them works satisfactorily, highlighting
thus the urgent need of proposing new, more
efficient diagrams, for which the statistically correct
methodology for handling compositional data must
be used.
Databases
The data were compiled from all Miocene to Recent
rock types from different areas of known,
uncontroversial tectonic settings from all over the
world. Initially, databases from island arcs,
continental rifts, ocean islands, and mid-ocean
ridges, as well as from the Mexican Volcanic Belt
(MVB) and the Andean continental arc, were
established and used by Verma & Aguilar-Y-Vargas
(1988); Verma (1997, 2000a,b, 2002, 2004, 2006,
2009a, 2010; Verma (2000); Vasconcelos-F. et al.
(1998, 2001), Agrawal et al. (2004, 2008); Verma et
al. (2006); and Agrawal & Verma (2007). An updated
version of these databases was prepared and used for
the present work. Specifically, Verma et al. (2006)
presented the information on the number of
samples, their tectonic setting and location
coordinates, and literature references. Later, Agrawal
et al. (2008) stated that Electronic Annexure EA-1,
with such information on additional samples
compiled by them, is available upon request from the
authors. Additional details are given in a companion
paper by Verma (2010). Therefore, to avoid
repetition these details are omitted from the present
paper.
All data, except those from the MVB and the
Andes, were used to evaluate the old Nb/Y–Zr/TiO2
diagram by Winchester & Floyd (1977).
Furthermore, a second evaluation of this old
diagram was also carried out using rocks from only
three tectonic settings of continental rift, ocean
island and mid-ocean ridge.
For the evaluation of the new Co–Th diagram by
Hastie et al. (2007), data from island arcs, continental
rifts, and ocean islands as well as the MVB and the
continental arc of the Andes were used separately.
MORB data were not used here because, as expected,
our compilation for this setting was mostly of basic
rocks, and we wanted to cover all rock types from a
given tectonic setting. The Andes data were an
updated version of the compilation by Verma et al.
(2006).
The rock names of all compiled rocks were
ascertained using the SINCLAS computer program
(Verma et al. 2002, 2003), which also provided
standard igneous norms according to the IUGS
recommendations (Le Bas et al. 1986; Le Bas 2000;
Le Maitre et al. 2002). Note that SINCLAS also
provides adjusted data (identified here as the
subscript adj) on an anhydrous 100% basis with a
prior adjustment of Fe-oxidation ratio. The rest of
the methodology was the same as outlined above in
the Introduction section.
Results
The results are arranged in two following
subsections.
Old Classification Diagrams
Floyd & Winchester (1975, 1978) and Winchester &
Floyd (1976, 1977) presented several diagrams for
241
CLASSIFICATION DIAGRAMS
the classification of altered rocks. These were of the
following three types; (1) element-element: (i) ZrP2O5; and (ii) Zr-TiO2; (2) element-element ratio:
(iii) Ce-Zr/TiO2; (iv) Ga-Zr/TiO2; (v) Zr/TiO2-SiO2;
(vi) Nb/Y-SiO2; (vii) Y/Nb-TiO2; and (viii) Zr/P2O5TiO2; and (3) element ratio-element ratio: (ix) Nb/YZr/TiO2; (x) Nb/Y-Ga/Sc; and (xi) Zr/P2O5-Nb/Y.
Several diagrams – (i) Zr-P2O5; (ii) Zr-TiO2; (vii)
Y/Nb-TiO2; (viii) Zr/P2O5-TiO2; (ix) Nb/Y-Zr/TiO2;
and Zr/P2O5-Nb/Y– were proposed (Floyd &
Winchester 1975; Winchester & Floyd 1976) to
distinguish only two types of basaltic rocks –
tholeiitic and alkali. The term tholeiite has not been
recommended by the IUGS (Le Bas et al. 1986; Le
Bas 2000; Le Maitre et al. 2002). Because for this
evaluation we wanted to strictly follow the IUGS
recommendations for the rock classification and
nomenclature, it was not possible to separate
tholeiites from alkali basalt in our database using the
IUGS scheme. Therefore, these diagrams cannot be
evaluated using the IUGS nomenclature as the
reference frame for our work.
The diagrams (v) Zr/TiO2-SiO2 and (vi) Nb/YSiO2 (Winchester & Floyd 1977; Floyd & Winchester
1978), both involving SiO2 and having been
proposed to classify all volcanic rock types, are also
not worth evaluating for several reasons. Firstly, they
involve one of the same axes, viz., SiO2, of the TAS
diagram. The names inferred from Zr/TiO2-SiO2 and
Nb/Y-SiO2 are likely to be similar to the TAS
diagram, because in both the subdivision basaltandesite-dacite-rhyolite depends on the SiO2
content. However, the subdivision proposed by
Winchester & Floyd (1977) does not fully match with
that of the IUGS (Le Bas et al. 1986), for example, in
the former, basaltic andesite is absent and rhyodacite
is present. These differences will be simply reflected
in the evaluation. Secondly, SiO2 may also be
somewhat variable under alteration processes, for
example, under geothermal conditions (e.g.,
Fournier & Potter II 1982; Verma & Santoyo 1997;
M.P. Verma 2000; Torres-Alvarado 2002;
Pandarinath et al. 2006; Torres-Alvarado et al. 2007).
Silica is known to dissolve from rocks –especially
from basic rocks– during interaction with water at
greater temperatures than those of the surface
ambient conditions. This is why the well known
242
silica geothermometers actually work for inferring
subsurface temperatures in geothermal systems (e.g.,
Fournier & Potter II 1982; Verma & Santoyo 1997;
Díaz-González et al. 2008; Palabıyık & Serpen 2008;
Verma et al. 2008a). Finally, because the
classification depends on both axes, the other
parameter –Zr/TiO2 or Nb/Y– might affect the rock
names if they are not perfect proxies for total alkalis.
The behaviour of these two ratio variables can be
better evaluated in the Nb/Y-Zr/TiO2 diagram (see
below).
Winchester & Floyd (1977) also presented (iii)
Ce-Zr/TiO2 and (iv) Ga-Zr/TiO2 diagrams for rock
classification. However, they also noted that these
diagrams did not perform so well as the Nb/YZr/TiO2 diagram, because different basalt types and
basanite were not clearly distinguished and, for
subalkaline magmas, neither Ce nor Ga showed any
significant increase with differentiation, i.e., no
significant change with increasing SiO2.
Consequently, although these authors presented
these two diagrams, they did not recommend their
use for rock classification purposes.
The 10th diagram –(x) Nb/Y-Ga/Sc– proposed by
Winchester & Floyd (1977), was also not evaluated
because the authors noted that the data, on which
this diagram was based, were particularly scarce and
the classification boundaries were not definitive. No
new boundaries were later proposed by these
authors. Besides, the functioning of the Nb/Y
parameter will be evaluated in the Nb/Y-Zr/TiO2
diagram.
Thus, in spite of almost a dozen of these old
diagrams, only the Nb/Y-Zr/TiO2 diagram of
Winchester & Floyd (1977) –henceforth called, for
simplicity, the W&F diagram– was evaluated in this
work. The results are presented in Figures 1−7. The
numbers of the IUGS (TAS+CIPW norm) classified
samples for each rock type as well as those of the
W&F diagram classified samples were calculated.
Thus, for a given IUGS rock name, the total number
of samples was identified and assumed to represent
100%. The numbers of samples plotting in all fields
of the W&F diagram were divided by the initial
number of samples of that particular rock type used
for the evaluation and the ratios were expressed as
percentages of W&F classification. When the W&F
S.P. VERMA ET AL.
16
12
TPH
FOI
10
PHT
TA
TEP
8
BSN
2
PB
45
50
SiO2 (%m/m)
c
PHT
8
BSN
4
PB
BA
B
0
40
45
50
SiO2 (%m/m)
d
PH
55
COM/PAN
R
T
0.1
RD/D
Zr/TiO2
Zr/TiO2
RD/D
TA
A
0.01
TA
A
0.01
A/B
A/B
BSN/
NPH
BSN/
NPH
B,Alk
B,Alk
B,Sub-Alk
0.001
0.01
PH
R
T
0.1
60
Int
Basic
Ultrabasic
1
COM/PAN
BTA
TB
6
60
TA
TEP
2
55
TPH
FOI
10
Int
Basic
Ultrabasic
12
BA
B
0
40
1
BTA
TB
6
4
b
14
Na2O+K2O (%m/m)
14
Na2O+K2O (%m/m)
16
a
B,Sub-Alk
0.001
1
0.1
Nb/Y
10
0.01
1
0.1
10
Nb/Y
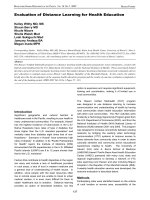
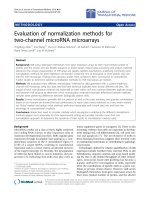
Figure 1. Statistical evaluation of the Nb/Y-Zr/TiO2 diagram (Winchester & Floyd 1977) –called the W&F diagram in this
work– in reference to the TAS (total alkalis versus silica) diagram (Le Bas et al. 1986; Verma et al. 2002) of the
IUGS classification scheme, using basaltic rocks from our database. Note also that the IUGS recommendation to
use adjusted data in the TAS diagram was strictly followed (Verma et al. 2002). The field names in the TAS
diagram, viz., (a) and (c), are: PB– picrobasalt; B– basalt; BA– basaltic andesite; BSN– basanite; TEP– tephrite;
TB– trachybasalt; BTA– basaltic trachyandesite; TA– trachyandesite; FOI– foidite; PHT– phonotephrite; and
TPH– tephriphonolite. Only part of the TAS diagram is shown. Other TAS rock names not included in this
diagram, but present in some later Figures are: PH– phonolite; A– andesite; D– dacite; TD– trachydacite; T–
trachyte; R– rhyolite. Similarly, for the W&F diagram, viz., (b) and (d), the field names are: B,Alk– alkali-basalt;
B,Sub-Alk–Sub-alkaline basalt; BSN/NPH– basanite/nephelinite; B/A– basalt/andesite; A– andesite; TA–
trachyandesite; T– trachyte; PH– phonolite; COM/PAN– comendite/pantellerite; RD/D– rhyodacite/dacite; and
R– rhyolite. The same symbols are used in the W&F diagram as in the corresponding TAS diagram, i.e., the
symbols are the same in the (a) and (c) pairs of diagrams and (b) and (d) pairs. (a) Alkali basalt (650) samples
according to the TAS diagram; (b) subalkaline basalt (1200) samples according to the TAS diagram; (c) the same
alkali basalt (650) samples of the TAS diagram plotted in the W&F diagram; and (d) the same subalkaline basalt
(1200) samples of the TAS diagram plotted in the W&F diagram.
243
CLASSIFICATION DIAGRAMS
14
10
PHT
FOI
8
TEP
BSN
6
TB
4
2
0
b
12
Na2O+K2O (%m/m)
12
Na2O+K2O (%m/m)
14
a
PB
35
40
45
TD
TA
8
BTA
6
4
0
55
50
10
2
BA
B
T
BA
55
50
SiO2 (%m/m)
1
Basic
Int
1
c
60
COM/PAN
PH
Int
Acid
d
COM/PAN
PH
R
R
T
0.1
T
0.1
RD/D
Zr/TiO2
RD/D
Zr/TiO2
70
65
SiO2 (%m/m)
Basic
Ultrabasic
D
A
TA
A
TA
A
0.01
0.01
A/B
B,Sub-Alk
0.001
0.01
0.1
Nb/Y
B,Alk
1
A/B
BSN/
NPH
BSN/
NPH
B,Sub-Alk
10
0.001
0.01
0.1
Nb/Y
B,Alk
1
10
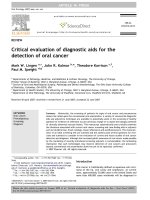
Figure 2. Statistical evaluation of the W&F diagram in reference to the TAS diagram using basanite and andesite rocks
from our database. See Figure 1 for more explanation. (a) Basanite (541) samples according to the TAS
diagram; (b) andesite (941) samples according to the TAS diagram; (c) the same basanite (541) samples of the
TAS diagram plotted in the W&F diagram; and (d) the same andesite (941) samples of the TAS diagram plotted
in the W&F diagram.
field had the same name as the initial IUGS rock
name, it was said to represent correct classification or
correct success rate (identified as italic boldface in
Tables 1 & 2), whereas when the W&F field name
differed from the IUGS, it was said to quantify
misclassification (expressed as simple numbers –
without highlighting– in Tables 1 & 2). All statistical
information, including the number of samples and
the calculated percentages, are included in Tables 1
244
and 2, respectively, for all data from four tectonic
settings and those from three tectonic settings except
island arc. For the IUGS rock names not present in
the W&F diagram (second part of Tables 1 and 2),
the highest percentage of the resulting rock W&F
types was highlighted in italics.
We start the discussion with those rock types that
exist in both the TAS and W&F classification. Then,
those rock names absent from the W&F
S.P. VERMA ET AL.
Na2O+K2O (%m/m)
14
12
10
1
a
TA
PHT
8
R
TD
6
T
RD/D
TA
A
0.01
A/B
4
BA
A
55
50
Basic
16
B,Sub-Alk
D
65
60
70
0.001
0.01
0.1
Nb/Y
10
1
Acid
Int
1
c
14
T
COM/PAN
d
PH
R
12
0.1
TD
8
RD/D
Zr/TiO2
10
R
6
T
TA
A
0.01
A/B
4
A
2
D
B,Sub,Alk
0
BSN/
NPH
B,Alk
0.001
65
60
Int
16
70
12
75
SiO2 (%m/m)
80
0.01
1
PH
T
PHT
Zr/TiO2
TD
TA
8
BTA
f
A
BA
Basic
COM/PAN
PH
RD/D
55
60
SiO2 (%m/m)
Int
TA
A/B
D
65
T
A
0.01
50
10
1
0.1
4
2
Nb/Y
R
TPH
6
0.1
Acid
e
14
0
BSN/
NPH
B,Alk
SiO2 (%m/m)
10
PH
0.1
BTA
0
Na2O+K2O (%m/m)
COM/PAN
T
TPH
2
Na2O+K2O (%m/m)
b
PH
Zr/TiO2
16
B,Sub,Alk
70
0.001
0.01
0.1
Nb/Y
B,Alk
1
BSN/
NPH
10
Acid
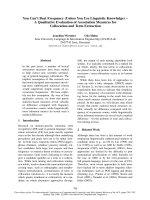
Figure 3. Statistical evaluation of the W&F diagram in reference to the TAS diagram using trachyandesite, trachyte
and phonolite rocks from our database. See Figure 1 for more explanation. (a) Trachyandesite (222) samples
according to the TAS diagram; (b) the same trachyandesite (222) samples of the TAS diagram plotted in the
W&F diagram; (c) trachyte (81) samples according to the TAS diagram; (d) the same trachyte (81) samples
of the TAS diagram plotted in the W&F diagram; (e) phonolite (49) samples according to the TAS diagram;
and (f) the same phonolite (49) samples of the TAS diagram plotted in the W&F diagram.
245
CLASSIFICATION DIAGRAMS
14
Na2O+K2O (%m/m)
16
a
12
10
TD
8
R
6
4
A
2
0
TD
8
6
4
75
SiO2 (%m/m)
D
A
0
80
70
65
60
Acid
Int
1
R
10
2
70
65
T
12
D
60
b
14
T
Na2O+K2O (%m/m)
16
1
COM/PAN
PH
80
Acid
Int
c
75
SiO2 (%m/m)
COM/PAN
d
PH
R
R
T
0.1
0.1
Zr/TiO2
Zr/TiO2
RD/D
TA
A
0.01
T
RD/D
TA
A
0.01
A/B
A/B
BSN/
NPH
B,Sub-Alk
0.001
0.01
0.1
B,Sub-Alk
B,Alk
Nb/Y
1
BSN/
NPH
10
0.001
0.01
0.1
B,Alk
Nb/Y
1
10
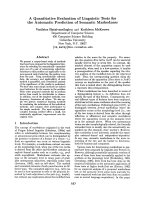
Figure 4. Statistical evaluation of the W&F diagram in reference to the TAS diagram using dacite and rhyolite rocks from
our database. See Figure 1 for more explanation. (a) Dacite (524) samples according to the TAS diagram; (b)
rhyolite (350) samples according to the TAS diagram; (c) the same dacite (524) samples of the TAS diagram
plotted in the W&F diagram; and (d) the same rhyolite (350) samples of the TAS diagram plotted in the W&F
diagram.
classification will be mentioned. The results of three
tectonic settings –without arc rocks– will be
discussed at the end of this subsection. In order to
help the reader better understand our evaluation
procedure, the results for alkali basalt and
subalkaline basalt samples (Table 1) are presented in
greater detail than the remaining rock types.
Our database used 650 samples of alkali basalt
and 1200 of subalkaline basalt as classified from the
246
IUGS nomenclature (the combination of TAS
diagram and CIPW norm; Le Bas et al. 1986; Le Bas
2000; Le Maitre et al. 2002; Verma et al. 2002) – alkali
basalt being a nepheline normative rock and
subalkaline basalt a hypersthene normative rock,
both of them with adjusted silica (SiO2)adj between
45% and 52% and adjusted total alkalis
(Na2O+K2O)adj up to 5%. The corresponding TAS
diagrams showing these alkali basalt and subalkaline
basalt samples are given in Figure 1a, b, respectively.
S.P. VERMA ET AL.
14
12
PHT
8
TEP
6
COM/PAN
BTA
TB
BSN
0.1
RD/D
TA
A
0.01
FOI
T
A/B
2
0
35
40
BA
B
PB
50
45
55
0.01
1
c
12
Nb/Y
10
1
d
COM/PAN
PH
R
10
TEP
8
6
Zr/TiO2
PHT
BTA
BSN
TB
0
0.1
RD/D
T
TA
A
0.01
4
A/B
FOI
2
35
40
14
BA
B
PB
50
45
SiO2 (%m/m)
Basic
Ultrabasic
10
0.01
BSN
f
RD/D
40
50
45
Basic
T
TA
A/B
B,Alk
B,Sub-AlK
55
SiO2 (%m/m)
Ultrabasic
PH
A
BA
B
0
35
COM/PAN
0.1
0.01
4
PB
10
1
R
TB
2
Nb/Y
Int
BTA
6
0.1
PHT
8
BSN/
NPH
0.001
1
FOI
B,Alk
B,Sub-AlK
55
e
12
Na2O+K2O (%m/m)
0.1
BSN/
NPH
Int
Basic
Zr/TiO2
Na2O+K2O (%m/m)
14
B,Alk
B,Sub-AlK
0.001
SiO2 (%m/m)
Ultrabasic
PH
R
10
4
b
Picrita (Foidita)
Picrita (Picrobasalto)
Picrita (Basalto)
Zr/TiO2
Na2O+K2O (%m/m)
1
a
BSN/
NPH
0.001
0.01
0.1
Nb/Y
1
10
Int
Figure 5. Statistical evaluation of the W&F diagram with reference to the TAS diagram using picrite (high-Mg rock,
classified prior to the TAS diagram, although these rocks are plotted in TAS diagram for reference
purposes only), foidite and picrobasalt rocks from our database. See Figure 1 for more explanation. (a)
Picrite (total 151 samples; 45 samples similar to picrobasalt and 106 similar to alkali basalt) samples
according to the TAS diagram; (b) the same picrite (151) samples of the TAS diagram plotted in the W&F
diagram; (c) foidite (118) samples according to the TAS diagram; (d) the same foidite (118) samples of the
TAS diagram plotted on the W&F diagram; (e) picrobasalt (30) samples according to the TAS diagram;
and (f) the same picrobasalt (30) samples of the TAS diagram plotted on the W&F diagram.
247
CLASSIFICATION DIAGRAMS
16
b
COM/PANT
TPH
FOI
10
0.1
PHT
8
TEP
6
BTA
TB
TA
A
0.01
A/B
BA
B
2
45
55
50
60
0.001
0.01
Int
Basic
1
R
PHT
TEP
BTA
TB
TA
A
A/B
BA
B
B,Sub-Alk
PB
0
40
45
55
50
60
0.001
0.01
0.1
SiO2 (%m/m)
12
PHT
10
8
TEP
6
BTA
TB
T
RD/D
TA
A
0.01
A/B
BA
B
B,Sub-Alk
0
45
50
55
SiO2 (%m/m)
Ultrabasic
PH
0.1
PB
40
COM/PANT
f
4
2
Basic
10
1
R
TPH
FOI
Zr/TiO2
Na2O+K2O (%m/m)
1
e
14
Nb/Y
B,Alk
BSN/
NPH
Int
Basic
Ultrabasic
16
T
RD/D
0.01
4
2
PH
0.1
10
6
COM/PANT
TPH
FOI
8
d
Zr/TiO2
Na2O+K2O (%m/m)
12
10
Nb/Y
c
14
BSN/
NPH
1
0.1
SiO2 (%m/m)
Ultrabasic
B,Alk
B,Sub-Alk
PB
0
40
T
RD/D
4
16
PH
R
12
Zr/TiO2
Na2O+K2O (%m/m)
1
a
14
60
0.001
0.01
B,Alk
1
0.1
BSN/
NPH
10
Nb/Y
Int
Figure 6. Statistical evaluation of the W&F diagram with reference to the TAS diagram, using tephrite,
trachybasalt and phonotephrite rocks from our database. See Figure 1 for more explanation. (a)
Tephrite (155) samples according to the TAS diagram; (b) the same tephrite (155) samples of the TAS
diagram plotted on the W&F diagram; (c) trachybasalt (314) samples according to the TAS diagram;
(d) the same trachybasalt (314) samples of the TAS diagram plotted on the W&F diagram; (e)
phonotephrite (73) samples according to the TAS diagram; and (f) the same phonotephrite (73)
samples of the TAS diagram plotted on the W&F diagram.
248
S.P. VERMA ET AL.
1
16
FOI
TPH
10
6
BTA
TB
BSN
PB
0
40
45
0.01
55
50
Ultrabasic
Basic
60
0.001
0.01
B,Sub-Alk
B,Alk
0.1
1
10
COM/PAN
d
PH
R
12
FOI
0.1
TPH
10
PHT
8
BTA
TEP
6
TB
BSN
4
2
B
PB
0 40
45
BA
B,Sub-Alk
55
60
Basic
T
TA
A
BA
50
Ultrabasic
RD/D
0.01
SiO2 (%m/m)
0.001
0.01
0.1
Nb/Y
B,Alk
BSN/
NPH
10
1
Int
1
e
COM/PAN
f
T
PH
R
12
0.1
10
Zr/TiO2
TD
8
R
6
0.01
4
A
2
0
Nb/Y
BSN/
NPH
Int
c
14
Na2O+K2O (%m/m)
A/B
1
16
14
TA
BA
SiO2 (%m/m)
T
A
4
B
RD/D
Zr/TiO2
TEP
2
Na2O+K2O (%m/m)
0.1
PHT
8
16
PH
R
12
Zr/TiO2
Na2O+K2O (%m/m)
14
COM/PAN
b
a
D
SiO2 (%m/m)
Int
Acid
T
TA
A
BA
B,Sub-Alk
70
65
60
RD/D
75
80
0.001
0.01
0.1
Nb/Y
B,Alk
1
BSN/
NPH
10
Figure 7. Statistical evaluation of the W&F diagram with reference to the TAS diagram, using basaltic andesite,
basaltic trachyandesite and trachydacite rocks from our database. See Figure 1 for more explanation.
(a) Basaltic andesite (1239) samples according to the TAS diagram; (b) the same basaltic andesite
(1239) samples of the TAS diagram plotted on the W&F diagram; (c) basaltic trachyandesite (392)
samples according to the TAS diagram; (d) the same basaltic trachyandesite (392) samples of the TAS
diagram plotted on the W&F diagram; (e) trachydacite (69) samples according to the TAS diagram;
and (f) the same trachydacite (69) samples of the TAS diagram plotted on the W&F diagram.
249
250
314 (100)
73 (100)
1239 (100)
392 (100)
69 (100)
Trachybasalt
Phonotephrite
Basaltic andesite
Basaltic trachyandesite
Trachydacite
7e, 7f
7c, 7d
7a, 7b
6e, 6f
6c, 6d
6a , 6b
5e , 5f
5c , 5d
5a , 5b
5a , 5b
4b, 4d
4a, 4c
3c , 3f
3b, 3e
3a , 3d
2b, 2d
2a , 2c
1b, 1d
1a , 1c
Figure #
154 (39.3)
98 (7.9)
53 (72.6)
214 (68.2)
66 (42.6)
20 (67)
45 (38.1)
34 (32.1)
27 (60)
7 (1.4)
2 (2.5)
16 (7.2)
40 (4.3)
322 (59.5)
313 (26.1)
480 (73.8)
Alkalibasalt
62 (15.8)
262 (21.1)
9 (12.3)
49 (15.6)
20 (12.9)
10 (33)
2 (1.7)
29 (27.3)
2 (4)
18 (3.4)
7 (3.2)
34 (3.6)
11 (2.0)
384 (32.0)
81 (12.5)
Sub-alkaline
basalt
20 (5.1)
2 (0.2)
6 (8.2)
12 (3.8)
50 (32.3)
37 (31.4)
16 (36)
1 (1.2)
3 (1.3)
161 (29.8)
9 (0.7)
20 (3.1)
Basanite/
Nephelinite
27 (6.9)
614 (49.6)
5 (6.9)
31 (9.9)
1 (0.8)
43 (40.6)
21 (4.0)
2 (0.9)
87 (9.3)
470 (39.2)
59 (9.1)
Andesite/
basalt
2 (2.9)
94 (23.9)
259 (20.9)
7 (2.2)
33 (28.0)
9 (2.6)
314 (59.9)
6 (7.4)
85 (38.3)
706 (75.0)
23 (1.9)
9 (1.4)
Andesite
8 (11.6)
26 (6.6)
3 (0.2)
1 (0.3)
18 (11.6)
57 (16.3)
31 (5.9)
15 (18.5)
65 (29.3)
35 (3.7)
1 (0.1)
Trachyandesite
36 (52.2)
1 (0.3)
11 (22)
24 (29.6)
47 (8.7)
Trachyte
7 (10.1)
1 (0.3)
22 (6.3)
37 (76)
4 (1.8)
2 (2.9)
1 (0.3)
109 (31.1)
1 (2)
3 (3.7)
Phonolite Comendite/
Pantellerite
14 (20.3)
7 (1.8)
1 (0.1)
1 (0.6)
94 (26.8)
133 (25.4)
30 (37.1)
40 (18.0)
39 (4.1)
1 (0.1)
Rhyodacite/
Dacite
Number of classified samples (% of classified samples) according to Nb/Y-Zr/TiO2 diagram (Winchester & Floyd 1977) W&F classification
Numbers in italic bold face are for the correct classification; numbers in italic show the rock type, in which most samples of rock types not included in W&F diagram were classified.
30 (100)
118 (100)
Foidite
155 (100)
106 (100)
Picrite (alkali basalt)
Tephrite
45 (100)
Picrite (picrobasalt)
Picrobasalt
350 (100)
Rhyolite
81 (100)
Trachyandesite
Trachyte
49 (100)
222 (100)
Andesite
524 (100)
941 (100)
Basanite
Dacite
541 (100)
Subalkali basalt
Phonolite
650 (100)
1200 (100)
Alkali basalt
Total
number
of samples (%)
IUGS
classification
58 (16.6)
Rhyolite
Table 1. Evaluation of the Nb/Y-Zr/TiO2 diagram (Winchester & Floyd 1977; called here W&F diagram) as compared to the IUGS volcanic rock classification (TAS and
CIPW norm; Le Bas et al. 1986; La Bas 2000; Le Maitre et al. 2002; Verma et al. 2002).
CLASSIFICATION DIAGRAMS
500 (100)
351 (100)
65 (100)
Basaltic trachyandesite
Trachydacite
66 (100)
Phonotephrite
Basaltic andesite
247 (100)
Trachybasalt
45 (100)
Picrite (picrobasalt)
155 (100)
243 (100)
Rhyolite
Tephrite
272 (100)
Dacite
29 (100)
48 (100)
Phonolite
Picrobasalt
65 (100)
Trachyandesite
Trachyte
80 (100)
178 (100)
Andesite
118 (100)
546 (100)
Basanite
Foidite
536 (100)
Subalkali basalt
Picrite (alkali basalt)
556 (100)
597 (100)
Alkali basalt
Total
number
of samples (%)
IUGS
classification
7e, 7f
7c, 7d
7a, 7b
6e, 6f
6c, 6d
6a, 6b
5e, 5f
5c, 5d
5a, 5b
5a, 5b
4b, 4d
4a, 4c
3e, 3f
3c, 3d
3a, 3b
2b, 2d
2a, 2c
1b, 1d
1a, 1c
Figure #
149 (42.4)
85 (17)
48 (72.7)
176 (71.2)
66 (42.6)
19 (65.5)
45 (38.1)
17 (21.2)
27 (60)
7 (2.5)
2 (3)
10 (5.6)
36 (6.6)
317 (59.1)
291 (48.7)
470 (84.5)
Alkalibasalt
57 (16.2)
192 (38.4)
8 (12.1)
30 (12.1)
20 (12.9)
10 (34.5)
2 (1.7)
24 (30)
2 (4.4)
1 (0.4)
4 (2.2)
16 (2.9)
11 (2)
234 (39.2)
43 (7.7)
Sub-alkaline
basalt
18 (5.1)
1 (0.2)
5 (7.5)
12 (4.8)
50 (32.3)
37 (31.4)
16 (35.5)
1 (1.5)
3 (1.7)
161 (30)
9 (1.5)
20 (3.6)
Basanite/
Nephelinite
23 (6.5)
97 (19.4)
5 (7.5)
21 (8.5)
1 (0.8)
39 (48.7)
1 (0.4)
2 (1.1)
22 (4)
60 (10.1)
18 (3.2)
Andesite/
basalt
1 (1.5)
70 (19.9)
122 (24.4)
7 (2.8)
33(28)
175 (64.3)
3 (4.6)
50 (28.1)
424 (77.6)
2 (0.3)
5 (0.9)
Andesite
8 (12.3)
26 (7.4)
3 (0.6)
1 (0.4)
18 (11.6)
21 (8.6)
13 (4.7)
15 (23.1)
65 (36.5)
24 (4.4)
47 (8.8)
Trachyandesite
36 (55.4)
22 (9)
36 (75)
24 (36.9)
Trachyte
7 (10.7)
1 (0.3)
1 (0.4)
11 (22.9)
4 (2.2)
2 (3)
1 (0.3)
108 (44.4)
1 (2)
3 (4.6)
Phonolite Comendite/
Pantellerite
11 (16.9)
6 (1.7)
1 (0.6)
46 (18.9)
75 (27.6)
17 (26.1)
40 (22.4)
24 (4.4)
1 (0.2)
Rhyodacite/
Dacite
Number of classified samples (% of classified samples) according to Nb/Y-Zr/TiO2 diagram (Winchester & Floyd 1977) W&F classification
45 (18.5)
Rhyolite
Table 2. Evaluation of Nb/Y-Zr/TiO2 diagram (Winchester & Floyd 1977; called here W&F diagram) as compared to the IUGS volcanic rock classification (TAS and CIPW
norm; Le Bas et al. 1986; La Bas 2000; Le Maitre et al. 2002; Verma et al. 2002), using rocks from all the tectonic settings except arc rocks ( For more explanation, see
Table 1).
S.P. VERMA ET AL.
251
CLASSIFICATION DIAGRAMS
If these fresh rocks were to be classified correctly in
the W&F diagram (Figure 1c, d; Nb/Y-Zr/TiO2
diagram of Winchester & Floyd 1977), most of them
(a high percentage) should be classified as alkali
basalt and sub-alkaline basalt, respectively.
For alkali basalt, we observed (Table 1) that out of
650 (designated as 100%) samples from our
databases, the correct classification according to the
W&F diagram amounted to 480 (about 73.8%)
samples. The misclassification of 170 (about 26.2%)
samples (Table 1; Figure 1c) was as follows: 81 (about
12.5%) samples as sub-alkaline basalt; 59 (about
9.1%) as andesite/basalt; 20 (about 3.1%) as
basanite/nephelinite; 9 (about 1.4%) as andesite; and
1 (about 0.1%) as trachyandesite. For subalkaline
basalt, on the other hand, we observed that out of
1200 (100%) samples, only 384 (about 32.0%) were
sub-alkaline basalt and most of them, i.e., the
remaining 816 (about 68.0%) were misclassified
(Figure 1d; Table 1). The misclassification for
subalkaline basalt (Table 1) ranged as follows: 470
(about 39.2%) samples as of ambiguous type
andesite/basalt; 313 (about 26.1%) as alkali-basalt; 23
(about 1.9%) as andesite; 9 (about 0.7%) as
basanite/nephelinite; and 1 (about 0.1%) as
rhyodacite/dacite. We also note that none of the
alkali basalt samples was misclassified as trachyte,
phonolite, comendite/pantellerite, rhyodacite/dacite,
or rhyolite. Similarly, none of the subalkaline basalt
was misclassified as trachyandesite, trachyte,
phonolite, comendite/pantellerite, or rhyolite.
The results of basanite and andesite samples are
plotted in Figure 2a−d. A total of 541 samples were
separated as basanite from our database (Figure 2a;
Table 1). The IUGS makes a distinction or subclassification of basanite as basanite, melanephelinite
and nephelinite, depending on the relative
proportions of normative olivine, albite, and
nepheline minerals (see Verma et al. 2002 for
details). In the W&F diagram both basanite and
nephelinite occupy exactly the same field (Figure 2c).
Therefore, we did not make any further distinction
of IUGS classification of basanite. Most of these 541
(100%) samples of basanite were misclassified by the
W&F scheme, with 322 (59.5%) of them being
misclassified as alkali-basalt (Figure 2c; Table 1).
Only 161 (29.8%) samples were correctly classified as
252
basanite/nephelinite. The remaining basanite
samples were misclassified as trachyte (47 samples)
and sub-alkaline basalt (11 samples). Our database
included 941 andesite samples according to the IUGS
classification scheme (Figure 2b), which were plotted
in Figure 2d of the W&F diagram. Of these, 706
(75.0%) samples were correctly identified as andesite
(Table 1) followed by 87 (9.3%) as ambiguous
andesite/basalt. The remaining misclassification
consisted of 40 (4.3%) samples as alkali-basalt, 39
(4.1%) as rhyodacite/dacite, 35 (3.7%) as
trachyandesite, and 34 (3.6%) as sub-alkaline basalt.
Evaluation of the W&F diagram for
trachyandesite, trachyte and phonolite is presented
in Figure 3a−f and summarised in Table 1. Our test
of 222 trachyandesite samples from our database
(Figure 3a) revealed that this type of rock was very
poorly classified in the W&F diagram (Figure 3b),
with only 65 (29.3%) samples corrected classified as
such (Table 1). Most samples (85 representing
38.3%) were misclassified as andesite (Table 1). This
misclassification was followed by 40 (18.0%) samples
as ambiguous types (rhyodacite/dacite) and 16
(7.2%) samples as alkali-basalt (Table 1), with the
remaining (16) samples as other rock types.
Evaluation of the W&F diagram using 81 trachyte
samples (Figure 3c) revealed that only 24 (about
29.6%) samples were correctly classified as trachyte,
with the remaining mostly misclassified as
rhyodacite/dacite and trachyandesite (30 samples–
37.1% and 15 samples–18.5%, respectively; Figure
3d; Table 1). Only 49 samples were classified as
phonolite in our database (Figure 3e). According to
W&F, the correct classification for them amounted
to 37 (about 76%) as phonolite, with most (11)
remaining samples (22%) being misclassified as
trachyte (Figure 3f; Table 1).
Finally, our database had a fairly large number of
samples of dacite and rhyolite (524 and 350,
respectively) as determined by the IUGS
classification (Table 1; Figure 4a, b). Their correct
classification by the W&F diagram was very poor
(Figure 4c, d), with only 133 (25.4%) samples as
rhyodacite/dacite and 58 (16.6%) as rhyolite,
respectively. The majority of samples, therefore, were
misclassified (Table 1). Dacite samples were
misclassified mostly as andesite (314 samples; 59.9%)
S.P. VERMA ET AL.
and rhyolite samples as comendite/pantellerite (109
samples; 31.1%) and rhyodacite/dacite (94 samples;
26.8%).
The remaining rock names of the IUGS
classification were not included in the W&F
classification. These are briefly treated,
approximately from high-Mg varieties and ultrabasic
to acid types. The lower part of Table 1 also provides
statistical information on the W&F classification of
these samples. The rock names comendite and
pantellerite used by Winchester & Floyd (1977) were
not incorporated by the IUGS scheme (Le Bas et al.
1986; Le Bas 2000; Le Maitre et al. 2002) and,
therefore, could not be evaluated.
For high-Mg picrite magmas, our database
provided 157 samples. Note that picrites are not
classified by the TAS diagram (Le Bas 2000).
However, to continue to explore the relationship of
the TAS diagram with the W&F diagram, we made
an artificial distinction of picrites according to the
TAS field in which they would plot (Figure 5a). Thus,
these 157 samples of picrites were sub-divided as: 6
samples only as picrite (foidite); 45 as picrite
(picrobasalt); and 106 as picrite (alkali basalt). The
W&F classification of these six picrite (foidite)
samples was not considered statistically significant.
The 45 picrite samples of picrobasalt type were
classified (Table 1; Figure 5b) as alkali-basalt (27
samples), basanite/nephelinite (16 samples) and subalkaline basalt (2 samples). The 106 picrite samples
of alkali basalt type, on the other hand, were
classified as andesite/basalt (43 samples), alkalibasalt (34 samples) and sub-alkaline basalt (29
samples). Our databases included 118 samples
(Figure 5c) of foidite, an ultrabasic rock. When these
samples were plotted in the W&F diagram (Figure
5d), we observed that 45 samples (about 38.1%) were
classified as alkali-basalt, 37 (31.4%) as
basanite/nephelinite, 33 (28.0%) as andesite, 2 (1.7%)
as sub-alkaline basalt, and 1 (0.8%) as
andesite/basalt. Only 30 samples of picrobasalt were
compiled in our database (Figure 5e), which were
classified as alkali-basalt and sub-alkaline basalt in
the W&F diagram (20 and 10 respectively; Figure
5f).
For tephrite (155 samples), trachybasalt (314
samples), and phonotephrite (73 samples), the
results summarised in Figure 6a−f and Table 1
showed that these rock types were mostly classified
by the W&F diagram as alkali-basalt (66, 214, and 53
samples, respectively). Additionally, for these three
rock types a significant number of samples (20, 49,
and 9, respectively) were recognised as subalkaline
basalt (Table 1). For tephrite samples,
basanite/nephelinite also represented an important
W&F classification (50 samples; 32.3%). A
significant number of tephrite samples (18; 11.6%)
were classified as trachyandesite in the W&F scheme.
Finally, we present the remaining three important
rock types (basaltic andesite, basaltic trachyandesite,
and trachydacite) according to the IUGS
classification (Table 1; Figure 7a, c, e), but not
included as such in the W&F diagram (Figure 7b, d,
f). For basaltic andesite a very large number of
samples (1239) were present in our database (Figure
7a). These were classified (Figure 7b) mainly as
andesite/basalt (614 samples; 49.6%), sub-alkaline
basalt (262 samples; 21.1%), and andesite (259
samples; 20.9%). Similarly, Figure 7c, d and Table 1
show that 392 samples of basaltic trachyandesite
were classified mainly as alkali-basalt (154 samples;
39.3%), andesite (94 samples; 23.9%), and subalkaline basalt (62 samples; 15.8%). Our final rock
type trachydacite was represented by 69 samples
(Figure 7e), which were classified mainly as trachyte
and rhyodacite/dacite (36 samples–52.2% and 14
samples–20.3%, respectively; Figure 7f; Table 1).
In summary, the correct classification by the
W&F diagram (Winchester & Floyd 1977) ranged
from very low values of about 16.6% to reasonably
high values of 76%. Alkali basalt, andesite and
phonolite were best classified as such (about
73.8−76%). The classification for subalkaline basalt,
basanite, trachyandesite, dacite, and rhyolite (with
16.6−32.0%) was simply not acceptable. The
remaining nine rock types included in the IUGS
classification (Figures 5−7) also did not provide any
one coherent rock name in the W&F scheme; the
highest percentages ranged from 38.1% to 72.6%.
Therefore, the wide use of this Nb/Y-Zr/TiO2
diagram currently in practice is not particularly
justified.
In order to obtain a totally unbiased evaluation of
the W&F diagram, which is not particularly
253
CLASSIFICATION DIAGRAMS
recommended for classifying arc rocks, we prepared
a selected database by excluding all arc rocks and
once again evaluated this diagram. The results are
summarised in Table 2. To limit the space of this
paper, no new diagrams are presented, as all these
samples are already included in Figures 1−7). As
expected, the total number of samples of a given rock
type generally decreased in Table 2 as compared to
Table 1, and this decrease was more pronounced for
sub-alkaline varieties than for alkaline types. In fact,
exactly the same number of samples of picrite and
foidite remained in Table 2 as in Table 1.
For alkali basalt samples, the correct classification
by the W&F diagram increased from 73.8% to 84.5%
(compare Tables 1 & 2), but for subalkaline basalt it
still remained unacceptably low (39.2%; Table 2).
Basanite, trachyandesite, trachyte, and phonolite
were also not satisfactorily classified by the W&F
diagram (correct classification of only about 30%,
36.5%, 36.9%, and 22.9%, respectively). Although
andesite rock samples were fairly well classified as
such (77.6%), neither dacite nor rhyolite samples had
acceptable correct classifications (27.6% classified as
ambiguous rhyodacite/dacite and 18.5% as rhyolite,
respectively; Table 2). For rock types not included in
the W&F classification (the second part of Table 2),
the classification results remained practically the
same as in Table 1.
From this work, therefore, an urgent need of an
improved classification scheme for altered rocks is
clearly established.
New Classification Diagram
Recently Hastie et al. (2007) recognised from an
altogether different approach (analysis of the
chemical effects of alteration) that there is need for ‘a
reliable way to classify rocks from the geological
record’. They stated that none of the frequently used
SiO2-K2O (Peccerillo & Taylor 1976) and the IUGS
recommended TAS (Le Bas et al. 1986) diagrams are
appropriate for this purpose. They also argued that
although Winchester & Floyd (1977) developed
immobile element proxies for the TAS diagram, the
need still existed for proxies of the SiO2-K2O
diagram. Hastie et al. (2007) proposed the use of two
proxy elements –Co for SiO2 and Th for K2O– in a
254
new Co-Th bivariate diagram. Their contention that
the W&F diagram is appropriate to replace the TAS
diagram has already been shown to be deficient in
the present work (see above).
We now attempt to evaluate the new Co-Th
diagram for classification purposes (Hastie et al.
2007). The same database as the one used for the
evaluation of the W&F diagram was employed, with
the addition of the Andes and the Mexican Volcanic
Belt. We decided not to use the SiO2-K2O plot for
processing our database because we wanted to
strictly follow the IUGS recommendations for rock
names (Le Bas et al. 1986; Le Bas 2000), in which the
SiO2-K2O scheme (e.g., Peccerillo & Taylor 1976) was
not included. Further, an evaluation of Co-Th
diagram in terms of SiO2-K2O scheme was already
provided by the original authors (Hastie et al. 2007)
who concluded that success rates ranged only up to
about 80% and, therefore, were not particularly high.
In this context, the subdivision of rock types in
the Co-Th diagram is rather poor (Hastie et al.
2007). Actually only three independent regions for
rock names were proposed in this diagram: basalt; an
overlap region of basaltic andesite with andesite
(referred to in this work as ‘basaltic
andesite/andesite’); and an overlap region of dacite
with rhyolite that also includes latite and trachyte
(‘dacite/rhyolite/latite/trachyte’). Each of these three
regions is further subdivided into tholeiitic, calcalkaline,
and
high-K2O/shoshonitic.
The
correspondence of this three-fold subdivision of
alkali-enrichment with the IUGS classification is
difficult to establish. In the later scheme, only twofold subdivision –subalkaline and alkali– may be
implicitly imagined for basalt. Certainly, there are
many rock names depending on the contents of total
alkalis at any given silica level. For example, at the
same silica level the IUGS rock names can vary from
basaltic andesite, basaltic trachyandesite, tephrite to
phonolite, or from andesite, trachyandesite to
phonolite (Le Bas et al. 1986; Verma et al. 2002). For
basaltic magmas, we could have arbitrarily used the
adjective subalkaline for both tholeiitic and calcalkaline divisions and alkali for highK2O/shoshonite. However, in our evaluation of the
Co-Th diagram we decided not to enter into this
oversimplification or assumptions regarding the
S.P. VERMA ET AL.
IUGS nomenclature. Instead, separate identities of
the three-fold subdivision of the Co-Th diagram
were maintained.
Nevertheless, some clarification must be made for
the correct classification (also called success rate)
and consequently for the misclassification. For
example, when a single basic rock type, such as basalt
(IUGS nomenclature), was used for evaluation and if
the rock name resulting from the Co-Th diagram for
a basalt sample was not basalt, this particular sample
represented an obvious misclassification. Thus, for a
group of samples of a given rock type it was easier to
determine the ‘obvious misclassification’ or also
called here the ‘minimum misclassification’. The
latter term will be used and highlighted in our
following presentation. We will not explicitly refer to
correct classification or success rate, because it will
be more difficult to determine for the Co-Th
diagram of Hastie et al. (2007) than for the old W&F
diagram. In the former, the rock names are limited to
only three separate fields.
Hastie et al. (2007) mentioned that their diagram
is especially useful for the classification of arc rocks.
Therefore, we maintained the identity of the tectonic
setting or volcanic provinces used in this evaluation.
These were: island arc, continental arc of the Andes,
MVB, continental rift, and for some rock types
additionally, ocean island. The results of our
evaluation are presented in Figures 8−10 and
summarised in Table 3. The ‘minimum
misclassification’ is shown in boldface for rock
names common to both classifications (IUGS and
Co-Th diagram), or in italics for rock names not
included in the IUGS classification (Table 3). Note
especially that this highlighting is the reverse to that
used for the W&F classification (Tables 1 & 2), in
which the correct classification was shown in italic
boldface.
For subalkaline basalt from island arcs (237
samples with Co and Th data compiled in our
database; Figure 8a), the minimum misclassification
amounted to 44 samples (18.6%) as basaltic
andesite/andesite (Figure 8b; Table 3). A total of 193
remaining samples were, therefore, identified as the
three varieties of basalt (see the columns of Thol.,
CA, and SHO in Table 3). The eight shoshonite
samples could also be considered as obvious
misclassification, but we decided not to discuss such
finer details. For subalkaline basalt (47 samples)
from the Andes, 4 samples (about 8%) were
obviously misclassified as basaltic andesite or
andesite. For subalkaline basalt samples from the
MVB and continental rift settings, no obvious
misclassification was observed. This does not mean,
however, that the complement was the correct
classification or success rate, we simply cannot
clearly define it, as discussed earlier.
The minimum misclassification of alkali basalt
samples (Figure 8c) was much less, with only a few
samples misclassified as basaltic andesite/andesite
(Figure 8d; Table 3).
For the total of 206 samples of basaltic andesite
from island arc setting (Figure 9a), a larger number
of them (99 samples amounting to about 48.1%)
represented the minimum misclassification: 93
samples (45.2%) as basalt. and 6 samples (2.9%) as
dacite/rhyolite/ latite/trachyte (Figure 9b; Table 3).
An even greater extent of minimum misclassification
was observed for these rock types from the Andes
(Figure 9b), because 87 samples out of 138 (63.1%)
were misclassified as basalt and only the remaining
51 samples (36.9%) plotted correctly as basaltic
andesite/andesite (Table 3). As for the Andes, the
minimum misclassification for basaltic andesite
from the MVB was also significant –about 50.4%
(Table 3). For continental rifts, misclassification was
extremely high (about 93%), with 37 out of 40
samples misclassified as basalt (Figure 9b).
Andesite (Figure 9c) can only be classified
ambiguously as basaltic andesite/andesite (Figure 9d;
Table 3). The minimum misclassification of andesite
samples from island arcs, the Andes, and MVB as
basalt was, respectively, about 12.8%, 23.7%, and
14.6% dacite/rhyolite/latite/trachyte (Figure 9d;
Table 3).
Dacite, trachyte, trachydacite and rhyolite (Figure
9e) were considered together because they could
only be classified as a group by the Co-Th diagram
(Figure 9f). Such rock samples from island arc and
the Andes showed 25.3% and 29.5% minimum
misclassification, respectively (Table 3). Similarly,
the MVB and continental rift setting had values of
30.1% and 24.0%, respectively.
255
CLASSIFICATION DIAGRAMS
16
16
Island Arc
Andes
MVB
Cont. Rift
12
TPH
FOI
10
PHT
TA
TEP
8
BSN
4
2
PB
0
40
BTA
TB
6
50
SiO2 (%m/m)
TA
BTA
TB
6
BSN
4
PB
45
b
BA
B
50
SiO2 (%m/m)
55
60
Int
Basic
Ultrabasic
100
100
H-K and SHO
H-K and SHO
10
1
Th ( g/g)
Th ( g/g)
PHT
TEP
8
0
40
60
TPH
FOI
10
Int
Basic
Ultrabasic
55
12
2
a
BA
B
45
14
Na2O+K2O (%m/m)
Na2O+K2O (%m/m)
14
CA
0.1
10
1
CA
0.1
60
BA/A
B
IAT
0.01
70
50
40
30
D/R*
20
10
Co ( g/g)
0
0.01
70
60
BA/A
B
IAT
c
50
40
30
D/R*
20
10
d
0
Co ( g/g)
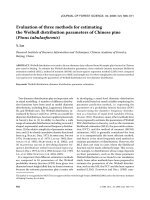
Figure 8. Statistical evaluation of the Co-Th diagram of Hastie et al. (2007) with reference to the TAS (total alkalis versus
silica) diagram (Le Bas et al. 1986; Verma et al. 2002) of the IUGS classification scheme, using basaltic rocks from
our database. Note that the separate identity of tectonic settings was maintained in this and later diagrams. See
Figure 1 for more explanation on the TAS diagram. The rock type abbreviations in the Co-Th diagram are: B–
basalt; BA/A– basaltic andesite/andesite; D/R*– dacite/rhyolite/latite/trachyte; IAT– island arc tholeiite; CA– calcalkaline; and H-K and SHO– high-K and shoshonite (see also Table 3). The same symbols are used in both the CoTh diagram and the corresponding TAS diagram. Furthermore, they are explained as inset in (a). (a) Subalkaline
basalt (437 samples; 237 from island arcs, 47 from the Andes, 61 from the Mexican Volcanic Belt–MVB, and 92
from continental rifts) according to the TAS diagram; (b) alkali basalt (167 samples; 22 from island arcs, 12 from
the Andes, 48 from the MVB, and 85 from continental rifts) according to the TAS diagram; (c) the same
subalkaline basalt (437) samples of the TAS diagram plotted on the Co-Th diagram; and (d) the same alkali basalt
(167) samples of the TAS diagram plotted on the Co-Th diagram.
The remaining results synthesised in Table 3 are
for rock names (from the IUGS nomenclature) that
were excluded from the Co-Th diagram of Hastie et
al. (2007). These rocks (Figure 10a−f) are mostly
more alkalic than the earlier rocks already evaluated
and presented in the first part of Table 3. In this
second part of Table 3, combined rock types are
arranged in the following order: ultrabasic (two
groups; Figure 10a, b), basic (four groups; Figure 10c,
256
d), and intermediate to acid (five groups; Figure 10e,
f).
As expected, ultrabasic magmas are rather scarce
in island arcs (no arc samples in Figure 10a; Table 3)
and alkali-rich rocks, such as basaltic trachyandesite,
trachybasalt, trachyte and trachyandesite, are much
less abundant in island arc settings than in other
tectonic areas, including the MVB and continental
arc of the Andes (Figure 10c, e; Table 3). Three out of
S.P. VERMA ET AL.
16
100
Island Arc
Andes
MVB
Cont. Rift
12
FOI
TPH
10
H-K and SHO
10
Th ( g/g)
Na2O+K2O (%m/m)
14
PHT
TEP
8
6
TB
BSN
BTA
4
2
B
PB
45
BA
IAT
a
55
50
SiO2 (%m/m)
Ultrabasic
60
0.01
70
60
40
50
Int
Basic
20
b
10
0
H-K and SHO
10
10
Th ( g/g)
TD
TA
8
BTA
6
4
1
CA
0.1
2
BA
55
50
D
A
60
IAT
c
70
65
0.01
70
60
Int
BA/A
B
40
50
30
D/R*
20
d
10
0
Co ( g/g)
SiO2 (%m/m)
Basic
Acid
100
16
14
H-K and SHO
T
10
12
10
Th ( g/g)
Na2O+K2O (%m/m)
30
D/R*
100
T
12
TD
8
R
6
1
CA
0.1
4
A
2
0
BA/A
B
Co ( g/g)
14
Na2O+K2O (%m/m)
CA
0.1
0
40
0
1
D
65
60
Int
70
SiO2 (%m/m)
Acid
IAT
e
75
80
0.01
70
60
50
D/R*
BA/A
B
40
30
20
10
f
0
Co ( g/g)
Figure 9. Statistical evaluation of the Co-Th diagram of Hastie et al. (2007) with reference to the TAS (total alkalis
versus silica) diagram (Le Bas et al. 1986; Verma et al. 2002), using basaltic andesite, andesite, dacite,
trachyte, trachydacite and rhyolite rocks from our database. See Figures 1 and 8 and Table 3 for more
explanation. (a) Basaltic andesite (513 samples; 206 from island arcs, 138 from the Andes, 129 from the
MVB, and 40 from continental rifts) according to the TAS diagram; (b) the same basaltic andesite (513)
samples of the TAS diagram plotted on the Co-Th diagram; (c) andesite (456 samples; 109 from island arcs,
59 from the Andes, and 288 from the MVB) according to the TAS diagram; (d) the same andesite (456)
samples of the TAS diagram plotted on the Co–Th diagram; (e) diverse acid rock types (436 samples; 83
from island arcs, 112 from the Andes, 166 from the MVB, and 75 from continental rifts) according to the
TAS diagram; and (f) the same (436) samples of the TAS diagram plotted on the Co-Th diagram.
257
CLASSIFICATION DIAGRAMS
100
14
Island Arc
Andes
MVB
Cont. Rift
Ocean Island
FOI
10
PHT
8
TEP
10
BTA
BSN
6
H-K and SHO
Th ( g/g)
Na2O+K2O (%m/m)
12
TB
4
0
35
40
IAT
a
PB
50
45
CA
0.1
BA
B
2
1
55
0.01
70
60
40
50
12
FOI
10
TPH
Th ( g/g)
Na2O+K2O (%m/m)
0
H-K and SHO
PHT
10
8
TEP
6
2
BTA
TB
BSN
4
1
45
BA
50
SiO2 (%m/m)
16
IAT
c
55
60
0.01
70
60
40
50
D/R*
BA/A
B
30
20
d
10
0
Co ( g/g)
Int
Basic
Ultrabasic
100
PH
H-K and SHO
T
14
12
CA
0.1
B
PB
0
40
TPH
TA
Th ( g/g)
Na2O+K2O (%m/m)
b
10
100
14
8
20
Int
Basic
16
10
30
Co ( g/g)
SiO2 (%m/m)
Ultrabasic
D/R*
BA/A
B
TD
PHT
BTA
6
4
10
1
CA
0.1
2
A
BA
0
50
Basic
55
60
SiO2 (%m/m)
Int
D
65
Acid
IAT
e
70
0.01
70
60
50
D/R*
BA/A
B
40
30
20
10
f
0
Co ( g/g)
Figure 10. Statistical evaluation of the Co-Th diagram of Hastie et al. (2007) with reference to the TAS (total
alkalis versus silica) diagram (Le Bas et al. 1986; Verma et al. 2002), using diverse rocks (other than
those used in Figures 8 & 9) from our database. See Figures 1 and 8 and Table 3 for more explanation.
(a) Different combinations of rock types (see Table 3 for abbreviations; 86 from continental rifts and
180 from ocean islands) according to the TAS diagram; (b) the same samples of the TAS diagram (a)
plotted on the Co-Th diagram; (c) different combinations of rock types (see Table 3 for abbreviations;
19 samples from island arcs, 51 from the Andes, 45 from the MVB, and 134 from continental rifts)
according to the TAS diagram; (d) the same samples of the TAS diagram (c) plotted on the Co-Th
diagram; (e) different combinations of rock types (see Table 3 for abbreviations; 18 from island arcs,
70 from the Andes, 94 from the MVB, 67 from continental rifts, and 29 from ocean islands) samples
according to the TAS diagram; and (f) the same samples of the TAS diagram (e) plotted on the Co-Th
diagram.
258
The Andes
MVB
The Andes
MVB
Continental rift
Ocean Island
BTA2+T+TA
BTA2+T+TA
BTA2+T+TA
BTA +PH+PHT+TPH+TA
BTA2+T+TA
29 (100)
67 (100)
94 (100)
70 (100)
18 (100)
134 (100)
45 (100)
51 (100)
19
180 (100)
86 (100)
75 (100)
166 (100)
112 (100)
83 (100)
288 (100)
59 (100)
109 (100)
40 (100)
129 (100)
138 (100)
206 (100)
85 (100)
48 (100)
12
22 (100)
92 (100)
61 (100)
47 (100)
237 (100)
No. of
Samples (%)
10e, 10f
10e, 10f
10e, 10f
10e, 10f
10e, 10f
10c, 10d
10c, 10d
10c, 10d
10c, 10d
10a, 10b
10a, 10b
9e, 9f
9e, 9f
9e, 9f
9e, 9f
9c, 9d
9c, 9d
9c, 9d
9a, 9b
9a, 9b
9a, 9b
9a, 9b
8b, 8d
8b, 8d
8b, 8d
8b, 8d
8a, 8c
8a, 8c
8a, 8c
8a, 8c
Figure
#
3 (2.8)
9 (23)
19 (9.2)
20 (42)
2 (9)
8 (8.7)
64 (27.0)
Thol.
4 (6.0)
14 (14.9)
2 (2.9)
3
20 (14.9)
19 (42.2)
22 (43.1)
10
22 (25.6)
3 (3.6)
9 (3.1)
2 (1.8)
28 (70)
57 (44.2)
83 (60.2)
70 (34.0)
38 (44.7)
4
17 (77)
63 (68.5)
56 (91.8)
39 (84)
121 (51.0)
CA
B
15 (52)
30 (44.8)
9 (9.6)
6 (8.6)
6
106 (79.1)
24 (53.3)
25 (49.0)
6
177 (98.3)
64 (74.4)
2 (2.6)
3 (1.8)
1 (0.9)
12 (4.2)
1 (1.7)
8 (6.2)
4 (2.9)
4 (2.0)
46 (54.1)
28 (58)
6
3 (14)
21 (22.8)
5 (8.2)
4 (8)
8 (3.4)
SHO
4 (3.7)
2 (5)
1 (0.8)
1 (0.7)
25 (12.1)
19 (8.0)
Thol.
3 (4.5)
38 (40.4)
22 (31.4)
3
2 (1.5)
2 (4.4)
3 (5.9)
3
2 (2.6)
41 (24.7)
5 (4.5)
18 (21.7)
230 (79.9)
26 (44.1)
88 (80.7)
1 (2)
58 (45.0)
49 (35.5)
82 (39.8)
1 (1.2)
2
4 (8)
25 (10.6)
CA
BA/A
11 (38)
17 (25.4)
24 (25.5)
18 (25.7)
5
6 (4.5)
1 (2.0)
3 (1.7)
14 (18.8)
6 (3.6)
27 (24.1)
16 (5.5)
19 (32.2)
3 (2.8)
5 (3.8)
1 (0.7)
SHO
2 (1.2)
2 (1.8)
4 (4.8)
2 (1.8)
Thol.
4 (6.0)
7 (7.4)
19 (27.1)
1
18 (24.0)
75 (45.2)
20 (17.8)
47 (56.6)
21 (7.3)
12 (20.3)
7 (6.4)
6 (2.9)
CA
D/R*
3 (10)
9 (13.4)
2 (2.1)
3 (4.3)
39 (52.0)
39 (23.5)
57 (50.9)
11 (13.3)
1 (1.7)
SHO
The rock abbreviations are (see Verma et al. 2002): B,subalk– subalkali basalt; B,alk– alkali basalt; BTA1– basaltic trachyandesite (basic); PIC– picrite; TB– trachybasalt; BSN– basanite; PHT– phonotephrite; FOI– foidite; TEP–
tephrite; PB– picrobasalt; BTA2– basaltic trachyandesite (intermediate); T– trachyte; TA– trachyandesite; PH– phonolite; TPH– tephtiphonolite; BA– basaltic andesite; A– andesite; D– dacite; TD– trachydacite; R– rhyolite.
For the Co– Th diagram (Hastie et al. 2007), B– basalt; BA/A– basaltic andesita/andesita; D/R*– diorite/rhyolite/latite/trachyte; Thol.– tholeiite; CA– calc-alkaline; SHO– high-K and shoshonite. The percentages for total
number of samples < 50 were arbitrarily quoted as integers. Numbers and percentages in boldface are for “obvious misclassification”, also called “minimum misclassification” and those without boldface are correct rock name
(not necessarily for the correct classification or success rate). The numbers and percentages in italic are for probable “minimum mis-classification”. Note this highlighting is reverse to that used in Tables 1 and 2.
2
Continental rift
Island arc
BSN+BTA1+PHT+PIC+TB
1
BSN+BTA +PHT+TB
MVB
A
BSN+BTA1+TB+PIC
The Andes
A
Island arc
Island arc
A
BTA1+PIC+TB
Continental rift
BA
Ocean Island
MVB
BA
Continental rift
The Andes
BA
BSN+FOI+PB+PIC+TEP
Island arc
BA
BSN+FOI+PIC+TEP
Continental rift
B,alk
Continental rift
MVB
B,alk
D+T+TD+R
The Andes
B,alk
MVB
Island arc
B,alk
D+T+R
Continental rift
B,subalk
Island arc
MVB
B,subalk
The Andes
The Andes
B,subalk
D+T+TD+R
Island arc
B,subalk
D+T+TD+R
Tectonic
Setting
IUGS classification
Table 3. Evaluation of the Co-Th diagram (Hastie et al. 2007) for the classification of fresh volcanic rocks from different tectonic settings, as compared to the IUGS volcanic
rock classification (TAS and CIPW norm; Le Bas et al. 1986; La Bas 2000; Le Maitre et al. 2002; Verma et al. 2002).
S.P. VERMA ET AL.
259
CLASSIFICATION DIAGRAMS
19 samples of such basic magmas from island arc
setting
were
misclassified
as
basaltic
andesite/andesite (Figure 10d), and 9 out of 18
intermediate magmas did so as basalt (Figure 10f).
Only continental rift and ocean island settings
provided a statistically significant number of samples
of ultrabasic magmas having both Co and Th data
(Figure 10a). Mostly plotted as shoshonitic basalt
(Figure 10b; Table 3), but a considerable number (22
out of 86 samples; 25.6%) from continental rifts were
also classified as calc-alkaline basalt. The minimum
misclassification was only three samples (1.7%),
misclassified as basaltic andesite/andesite from an
ocean island setting (Table 3). The minimum
misclassification for basic magmas is represented by
the few samples that are classified as basaltic
andesite/andesite in the Co-Th diagram (Figure 10d;
Table 3). They represent only about 4.4% to 7.9%.
Similarly, for intermediate to acid magmas, the
misclassified samples are those that plot as basalt
(Figure 10f; Table 3). However, these are much more
numerous than those for the earlier two categories.
The minimum misclassification amounted to about
11.5%, 24.5%, 50.8%, and 52%, respectively, for the
Andes, MVB, continental rifts, and ocean islands
(Figure 10f; Table 3).
In summary, the minimum misclassification for
those rock samples that have names common to the
IUGS scheme and Co-Th diagram of Hastie et al.
(2007) ranged as follows: (i) two cases of low values
of about 1.2% and 8%; (ii) five cases of intermediate
values of about 12.8−24.0%; (iii) seven cases of
unacceptably high values of about 25.3−93% (see the
upper part of Table 3). For those rocks with names in
the IUGS scheme and not in the Co-Th diagram of
Hastie et al. (2007), minimum misclassifications
were generally small (1.7−11.5%), but with some
greater values in the range of 24.5−52%.
Discussion: the Need of Still Newer Classification
Diagram
On the basis of unacceptably low success rates for
correct classification by the old W&F diagram and
unacceptably high minimum misclassification
registered for the new Hastie et al. (2007) diagram,
we can safely conclude that both diagrams are flawed
for the classification of altered rocks.
260
It is not clear to us how to employ the Co-Th
diagram (Hastie et al. 2007), not much used so far by
other researchers, for classification. The diagram is
supposedly intended to discriminate altered arc
volcanic rocks. In older terrains, where classification
of altered rocks is badly needed, it seems to us that
the user must first ascertain that the rocks actually
belonged to an arc before using this diagram. If so,
how is it to going to be done; by plate tectonic
reconstructions or by discrimination diagrams? Plate
reconstructions are largely model-based. Should we
use discrimination diagrams? But, most existing
discrimination diagrams do not work properly, as
shown by one of us in a companion paper (Verma
2010). So, should we use only the new discriminant
function discrimination diagrams (Agrawal et al.
2008) based on natural log-ratio transformation of
relatively immobile elements?
The other question that arises is: is there any use
in discriminating only three classes of rock names,
two of which are largely indeterminate (‘basaltic
andesite/andesite’ and ‘dacite / rhyolite / latite /
trachyte’), with two or more rock names in each of
them? For fresh rocks there are a dozen of these
individual names proposed by the IUGS (Le Bas et
al. 1986; Le Bas 2000). Hence, the main use of this
new Co-Th diagram is probably its capacity to assign
tholeiitic, calc-alkaline and shoshonitic adjectives to
basalt,
basaltic
andesite/andesite,
and
dacite/rhyolite/latite/trachyte.
From this discussion, it becomes clear to us that
much work is needed in order to reach the goal of
altered rock classification system that would better
match the IUGS scheme. Floyd & Winchester (1975,
1978) and Winchester & Floyd (1976, 1977)
attempted this even before the IUGS acceptance of
the TAS diagram (Le Bas et al. 1986). However, the
recent attempt (Hastie et al. 2007) does not provide
us with a much needed working framework for
classification of altered volcanic rocks from all
tectonic settings either. Unfortunately, we are
probably far from having ‘a reliable way to classify
rocks from the geological record’. Thus, new
proposals for altered rock classification to solve the
classification and nomenclature problems in earth
sciences are badly needed.
S.P. VERMA ET AL.
Statistical Requirements for New Proposals
A major problem with bivariate (such as the Co-Th
diagram of Hastie et al. 2007), ternary diagrams
(such as those evaluated by Verma 2010) and even
the element ratio/ratio plot (such as the Nb/YZr/TiO2 diagram of Winchester & Floyd 1977), is
that they probably represent too few chemical
variables to correctly handle the multivariate
problem of altered rock classification. The closure
and constant sum problem is another factor that
inhibits correct statistical treatment (Chayes 1960,
1965, 1978; Aitchison 1984, 1986, 1989). The
representativeness of the initial datasets used for
proposing these various diagrams may be another
factor that affects their application. In such diagrams
the dividing boundaries are also subjective, generally
drawn by eye. An objective way to replace them by
probability-based boundaries has already been
proposed (Agrawal 1999) and practiced in
discrimination diagrams (Agrawal et al. 2004, 2008;
Verma et al. 2006; Agrawal & Verma 2007).
In future we propose to follow the example of
Verma et al. (2006) and Agrawal et al. (2008), who
solved most of these problems by proposing new
natural logarithm-ratio based discriminant function
diagrams for tectonomagmatic discrimination using
major- and trace-elements, respectively (Verma
2010). In addition to the above problems, statistical
analysis also requires that the data be normally
distributed without any discernible statistical
contamination. Fortunately, this final problem can
also be solved by the methodology proposed by
Barnett & Lewis (1994) and considerably improved
recently by Verma & Quiroz-Ruiz (2006a, 2006b,
2008), Verma et al. (2008b), and Verma (2009b, c).
Such a statistical procedure of discordancy tests has
been already extensively employed by numerous
researchers (e.g., Castrellon-Uribe et al. 2008; DíazGonzález et al. 2008; Jafarzadeh & Hosseini-Barzi
2008; Nagarajan et al. 2008; Obeidat et al. 2008;
Palabiyik & Serpen 2008; Vargas-Rodríguez et al.
2008; Vattuone et al. 2008; Armstrong-Altrin 2009;
Marroquín-Guerra et al. 2009; Pandarinath 2009a, b;
Gómez-Arias et al. 2009; González-Márquez &
Hansen 2009; González-Ramírez et al. 2009;
Madhavaraju & Lee 2009; Ostrooumov et al. 2009;
Rodríguez-Ríos & Torres-Aguilera 2009; Verma et al.
2009a, b). Therefore, it will not be difficult to
incorporate this procedure in the production of new
classification diagrams for altered volcanic rocks.
Such combined methodology of extensive database,
discordant outlier tests, and linear discriminant
analysis could therefore be easily extended for the
proposal of much needed new diagrams for plutonic
rocks as well. This work is currently in progress.
Conclusions
From the statistical evaluations using fresh rocks
presented in this work, we conclude that none of the
existing classification diagrams works well for altered
volcanic rocks. Therefore, an urgent need exists to
explore this field of earth sciences and fulfil the
much needed altered rock classification system.
Significant progress has been achieved using
statistical methods to identify discordant outliers,
and linear discriminant analysis based on natural
logarithm-ratio transformations, whose application
would facilitate the proposal of new classification
diagrams consistent with the IUGS nomenclature.
Acknowledgements
R. González-Ramírez expresses her gratitude to the
Secretaría de Educación Pública for permission to
carry out doctoral studies in Universidad Nacional
Autónoma de México. R. Rodríguez-Ríos is grateful
to the Universidad Autónoma de San Luis Potosí for
granting him sabbatical leave to work at the Centro
de Investigación en Energía (Universidad Nacional
Autónoma de México). We are grateful to Samuele
Agostini, an anonymous referee, and the editor Erdin
Bozkurt, who all, while highly appreciating our
work, provided suggestions that helped improve our
presentation. We express our great sorrow to inform
to the community that our colleague Rodolfo
Rodríguez Ríos – coauthor of this paper – died on
July 27, 2009. John A. Winchester edited English of
the final text and Yalçın Ersoy translated the abstract
to Turkish.
261
CLASSIFICATION DIAGRAMS
References
AGRAWAL, S. 1999. Geochemical discrimination diagrams: a simple
way of replacing eye-fitted boundaries with probability based
classifier surfaces. Journal of the Geological Society of India 54,
335−346.
AGRAWAL, S. & VERMA, S.P. 2007. Comment on ‘Tectonic
classification of basalts with classification trees’ by Pieter
Vermeesch (2006). Geochimica et Cosmochimica Acta 71,
3388−3390.
AGRAWAL, S., GUEVARA, M. & VERMA, S.P. 2004. Discriminant
analysis applied to establish major-element field boundaries
for tectonic varieties of basic rocks. International Geology
Review 46, 575−594.
AGRAWAL, S., GUEVARA, M. & VERMA, S.P. 2008. Tectonic
discrimination of basic and ultrabasic rocks through logtransformed ratios of immobile trace elements. International
Geology Review 50, 1057−1079.
AHMAD, T., TANAKA, T., SACHAN, H.K., ASAHARA, Y., ISLAM, R. &
KHANNA, P.P. 2008. Geochemical and isotopic constraints on
the age and origin of the Nidar Ophiolitic Complex, Ladakh,
India: implications for the Neo-Tethyan subduction along the
Indus suture zone. Tectonophysics 451, 206−224.
AITCHISON, J. 1984. Reducing the dimensionality of compositional
data set. Mathematical Geology 16, 617−635.
AITCHISON, J. 1986. The Statistical Analysis of Compositional Data.
Chapman and Hall, London New York.
AITCHISON, J. 1989. Measures of location of compositional data sets.
Mathematical Geology 21, 787−790.
ARMSTRONG-ALTRIN, J.S. 2009. Provenance of felsic beach sands from
Cazones, Acapulco and Bahia Kino beaches, Mexico. Revista
Mexicana de Ciencias Geológicas 26, 764−782.
BAĞCI, U., PARLAK, O. & HÖCK, V. 2008. Geochemistry and tectonic
environment of diverse magma generations forming the
crustal units of the Kızıldağ (Hatay) ophiolite, southern
Turkey. Turkish Journal of Earth Sciences 17, 43−71.
BARNETT, V. & LEWIS, T. 1994. Outliers in Statistical Data. John Wiley
& Sons, Chichester.
CASTRELLON-URIBE, J., CUEVAS-ARTEAGA, C. & TRUJILLO-ESTRADA, A.
2008. Corrosion monitoring of stainless steel 304L in lithium
bromide aqueous solution using transmittance optical
detection technique. Optics and Lasers in Engineering 46,
469−476.
CHAYES, F. 1960. On correlation between variables of constant sum.
Journal of Geophysical Research 65, 4185−4193.
CHAYES, F. 1965. Classification in a ternary-diagram by means of
discriminant functions. American Mineralogist 50, 1618−1633.
CHAYES, F. 1978. Ratio Correlation. A Manual for Students of
Petrology and Geochemistry. The University of Chicago Press,
Chicago and London.
262
DÍAZ-GONZÁLEZ, L., SANTOYO, E. & REYES-REYES J. 2008. Tres nuevos
geotermómetros mejorados de Na/K usando herramientas
computacionales y geoquimiométricas: aplicación a la
predicción de temperaturas de sistemas geotérmicos. Revista
Mexicana de Ciencias Geológicas 25, 465−482.
FLOYD, P.A. & WINCHESTER, J.A. 1975. Magma type and tectonic
setting discrimination using immobile elements. Earth and
Planetary Science Letters 27, 211−218.
FLOYD, P.A. & WINCHESTER , J.A. 1978. Identification and
discrimination of altered and meta-morphosed volcanic rocks
using immobile elements. Chemical Geology 21, 291−306.
FOURNIER, R.O. & POTTER II, R.W. 1982. A revised and expanded
silica (quartz) geothermometer. Geothermal Resources Council
Bulletin 11, 3−12.
GLADKOCHUB, D.P., MAZUKABZOV, A.M., DONSKAYA, T.V., DE WAELE,
B., STANEVICH, M. & PISAREVSKY, S.A. 2008. The age and origin
of volcanics in the Riphean section of the Siberian craton
(western Baikal area). Russian Geology and Geophysics 49,
749−758.
GÖKTEN, E. & FLOYD, P.A. 2007. Stratigraphy and geochemistry of
pillow basalts within the ophiolitic melange of the İzmirAnkara-Erzincan suture zone: implications for the geotectonic
character of the northern branch of Neotethys. International
Journal of Earth Sciences 96, 725−741.
GÓMEZ-ARIAS, E., ANDAVERDE, J., SANTOYO, E. & URQUIZA, G. 2009.
Determinación de la viscosidad y su incertidumbre en fluidos
de perforación usados en la construcción de pozos
geotérmicos: aplicación en el campo de Los Humeros, Puebla,
México. Revista Mexicana de Ciencias Geológicas 26, 516−529.
GONZÁLEZ-MÁRQUEZ, L.C. & HANSEN, A.M. 2009. Adsorción y
mineralización de atrazina y relación con parámetros de suelos
del DR 063 Guasave, Sinaloa. Revista Mexicana de Ciencias
Geológicas 26, 587−599.
GONZÁLEZ-RAMÍREZ, R., DÍAZ-GONZÁLEZ, L. & VERMA, S.P. 2009.
Eficiencia relativa de las 33 pruebas de discordancia para
valores desviados basada en datos geoquímicos de materiales
de referencia. Revista Mexicana de Ciencias Geológicas 26,
501−515.
GÜRSÜ, S. 2008. Petrogenetic and tectonic significance of rift-related
pre-Early Cambrian mafic dikes, Central Taurides, Turkey.
International Geology Review 50, 895−913.
HASTIE, A.R., KERR, A.C., PEARCE, J.A. & MITCHELL, S.F. 2007.
Classification of altered volcanic island rocks using immobile
trace elements: development of the Th-Co discrimination
diagram. Journal of Petrology 48, 2341−2357.
JAFARZADEH, M. & HOSSEINI-BARZI, M. 2008. Petrography and
geochemistry of Ahwaz Sandstone Member of Asmari
Formation, Zagros, Iran: implications on provenance and
tectonic setting. Revista Mexicana de Ciencias Geológicas 25,
247−260.
S.P. VERMA ET AL.
KADİR, S., ÖNEN-HALL, A.P., AYDIN, S.N., YAKICIER, C., AKARSU, N. &
TUNCER, M. 2008. Environmental effect and genetic influence:
a regional cancer predisposition survey in the Zonguldak
region of Northwest Turkey. Environmental Geology 54,
391−409.
KESKİN, M., GENÇ, Ş.C. & TÜYSÜZ, O. 2008. Petrology and
geochemistry of post-collisional Middle Eocene volcanic units
in North-Central Turkey: evidence for magma generation by
slab breakoff following the closure of the Northern Neotethys
Ocean. Lithos 104, 267−305.
KALMAR, J. & KOVACS-PALFFY, P. 2008. Geochemical study of
leptinites from Stejera (Romania). Carpathian Journal of Earth
and Environmental Sciences 3, 49−64.
OBEIDAT, M.M., AHMAD, F.Y., HAMOURI, N.A.A., MASSADEH, A.M. &
ATHAMNEH, F.S. 2008. Assessment of nitrate contamination of
karst springs, Bani Kanana, Northern Jordan. Revista
Mexicana de Ciencias Geológicas 25, 426−437.
OSTROOUMOV, M., TARAN, Y., ARELLANO-JIMÉNEZ, M., PONCE, A. &
REYES-GASGA, J. 2009. Colimaite, K3VS4 – a new potassiumvanadium sulfide mineral from the Colima volcano, State of
Colima (Mexico). Revista Mexicana de Ciencias Geológicas 26,
600−608.
PALABIYIK, Y. & SERPEN, U. 2008. Geochemical assessment of Simav
geothermal field, Turkey. Revista Mexicana de Ciencias
Geológicas 25, 408−425.
KAYGUSUZ, A., SIEBEL, W., ŞEN, C. & SATIR, M. 2008. Petrochemistry
and petrology of I-type granitoids in an arc setting: the
composite Torul pluton, Eastern Pontides, NE Turkey.
International Journal of Earth Sciences 97, 739−764.
PANDARINATH, K. 2009a. Clay minerals in SW Indian continental
shelf sediments cores as indicators of provenance and
paleomonsoonal conditions: a statistical approach.
International Geology Review 51, 145−165.
LE BAS, M.J. 2000. IUGS reclassification of the high-Mg and picritic
volcanic rocks. Journal of Petrology 41, 1467−1470.
PANDARINATH, K. 2009b. Evaluation of geochemical sedimentary
reference materials of the Geological Society of Japan (GSJ) by
an objective outlier rejection statistical method. Revista
Mexicana de Ciencias Geológicas 26, 638−646.
LE BAS, M.J., LE MAITRE, R.W., STRECKEISEN, A. & ZANETTIN, B. 1986.
A chemical classification of volcanic rocks based on the total
alkali-silica diagram. Journal of Petrology 27, 745−750.
LE MAITRE, R.W., STRECKEISEN, A., ZANETTIN, B., LE BAS, M.J., BONIN,
B., BATEMAN, P., BELLIENI, G., DUDEK, A., SCHMID, R., SORENSEN,
H. & WOOLLEY, A.R. 2002. Igneous Rocks. A Classification and
Glossary of Terms: Recommendations of the International Union
of Geological Sciences Subcommission of the Systematics of
Igneous Rocks. Cambridge University Press, Cambridge.
MADHAVARAJU, J. & LEE, Y.I. 2009. Geochemistry of the
Dalmiapuram Formation of the Uttatur Group (Early
Cretaceous), Cauvery basin, southeastern India: Implications
on Provenance and Paleo-redox conditions. Revista Mexicana
de Ciencias Geológicas 26, 380−394.
MARROQUÍN-GUERRA, S.G., VELASCO-TAPIA, F. & DÍAZ-GONZÁLEZ, L.
2009. Evaluación estadística de Materiales de Referencia
Geoquímica del Centre de Recherches Pétrographiques et
Géochimiques (Francia) aplicando un esquema de detección y
eliminación de valores desviados y su posible aplicación en el
control de calidad de datos geoquímicas. Revista Mexicana de
Ciencias Geológicas 26, 530−542.
MONDAL, M.E.A., CHANDRA, R. & AHMAD, T. 2008. Precambrian
mafic magmatism in Bundelkhand craton. Journal of the
Geological Society of India 72, 113−122.
NAGARAJAN, R., SIAL, A.N., ARMSTRONG-ALTRIN, J.S., MADHAVARAJU, J.
& NAGENDRA, R. 2008. Carbon and oxygen isotope
geochemistry of Neoproterozoic limestones of the Shahabad
Formation, Bhima basin, Karnataka, southern India. Revista
Mexicana de Ciencias Geológicas 25, 225−235.
NARDI, L.V.S., PLA-CID, J., BITENCOURT, M.D. & STABEL, L.Z. 2008.
Geochemistry and petrogenesis of post-collisional
ultrapotassic syenites and granites from southernmost Brazil:
the Piquiri Syenite Massif. Anais da Academia Brasileira de
Ciencias 80, 353−371.
PANDARINATH, K., PUSHPARANI, D.E., TORRES-ALVARADO, I. & VERMA,
S.P. 2006. X-ray diffraction analysis of hydrothermal minerals
from the Los Azufres geothermal system, Mexico.
International Geology Review 48, 174−190.
PANDARINATH, K., DUSKI, P., TORRES-ALVARADO, I.S. & VERMA, S.P.
2008. Element mobility during the hydrothermal alteration of
rhyolitic rocks of the Los Azufres geothermal field, Mexico.
Geothermics 37, 53−72.
PECCERILLO, A. & TAYLOR, S.R. 1976. Geochemistry of Eocene calcalkaline volcanic rocks from the Kastamonu area, Northern
Turkey. Contributions to Mineralogy and Petrology 58, 63−81.
RODRÍGUEZ-RÍOS, R. & TORRES-AGUILERA, J.M. 2009. Evolución
petrológica y geoquímica de un vulcanismo bimodal
oligocénico en el Campo Volcánico de San Luis Potosí
(México). Revista Mexicana de Ciencias Geológicas 26,
658−673.
SHEKHAWAT, L.S., PANDIT, M.K. & JOSHI, D.W. 2007. Geology and
geochemistry of palaeoproterozoic low-grade metabasic
volcanic rocks from Salumber area, Aravalli Supergroup, NW
India. Journal of Earth System Science 116, 511−524.
SHETH, H.C. & MELLUSO, L. 2008. The Mount Pavagadh volcanic
suite, Deccan Traps: Geochemical stratigraphy and magmatic
evolution. Journal of Asian Earth Sciences 32, 5−21.
TORRES-ALVARADO, I.S. 2002. Chemical equilibrium in hydrothermal
systems: the case of Los Azufres geothermal field, Mexico.
International Geology Review 44, 639−652.
TORRES-ALVARADO, I.S., PANDARINATH, K., VERMA, S.P. & DULSKI, P.
2007. Mineralogical and geochemical effects due to
hydrothermal alteration in the Los Azufres geothermal field,
Mexico. Revista Mexicana de Ciencias Geológicas 24, 15−24.
263