Geophysical variations during the total solar eclipse in 2006 in Turkey
Bạn đang xem bản rút gọn của tài liệu. Xem và tải ngay bản đầy đủ của tài liệu tại đây (1.51 MB, 6 trang )
Turkish Journal of Earth Sciences (Turkish J. Earth Sci.), Vol. 20, 2011, pp. 337–342. Copyright ©TÜBİTAK
doi:10.3906/yer-0906-14
First published online 14 December 2009
Geophysical Variations During the Total Solar
Eclipse in 2006 in Turkey
ABDULLAH ATEŞ1, AYDIN BÜYÜKSARAÇ2 & ÖZCAN BEKTAŞ3
1
Ankara University, Faculty of Engineering, Department of Geophysical Engineering, Beşevler,
TR−06100 Ankara, Turkey (E-mail: )
2
Çanakkale Onsekiz Mart University, Faculty of Engineering and Architecture,
Department of Geophysical Engineering, Terzioğlu Campus, TR−17020 Çanakkale, Turkey
3
Cumhuriyet University, Faculty of Engineering, Department of Geophysical Engineering, TR−58140 Sivas, Turkey
Received 23 June 2009; revised typescript receipt 08 December 2009; accepted 14 December 2009
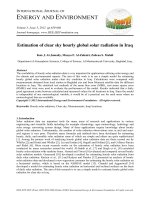
Abstract: It has been observed that some geophysical parameters could be changed during a solar eclipse. We have
therefore measured gravity and magnetic fields during solar eclipses. We also measured the gravity field during the
th
th
previous eclipse on the 11 of August, 1999. Gravity measurements on the 29 of March, 2006 are compared with
th
previous gravity measurements at the same location during the eclipse on the 11 of August, 1999. Both showed the
same behaviour during the eclipses. Gravity measurements showed fluctuations during both eclipses. A decrease in the
intensity of the magnetic field was observed. Low-pass filtered magnetic data show peculiarity during the eclipse which
can be correlated with the fluctuations in the gravity fields.
Key Words: total solar eclipse, gravity measurements, magnetic measurements, power spectrum, low pass filtering
Türkiye’de 2006 Yılı Tam Güneş Tutulması Sırasında
Gözlenen Jeofizik Değişimler
Özet: Güneş tutulması sırasında değişen jeofizik parametrelerin bazıları gözlenmiştir. Gerçekte güneş tutulmaları
sırasında gravite ve manyetik alanları ölçtük. Ayrıca 11 Ağustos 1999 tarihinde bir önceki güneş tutulması sırasında
gravite alanını ölçmüştük. 29 Mart 2006 tarihinde yapılan gravite ölçümleri, aynı noktada 11 Ağustos 1999 tarihindeki
önceki gravite ölçümleriyle karşılaştırılmıştır. Her iki ölçü de tutulma sırasında aynı davranışı sergilemiştir. Gravite
ölçüleri, her iki tutulma sırasında dalgalanmalar göstermiştir. Manyetik alan şiddetindeyse bir azalma gözlenmiştir.
Alçak geçişli filtre uygulanmış manyetik veri, tutulma sırasında gravite alanlarında meydana gelen dalgalanmalarla
ilişkilendirilebilen bir özellik göstermiştir.
Anahtar Sözcükler: güneş tutulması, gravite ölçümleri, manyetik ölçümler, güç spektrumu, alçak geçişli süzgeçleme
Introduction
th
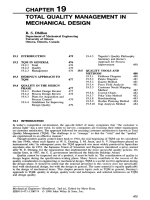
A total solar eclipse occurred on the 29 of March,
2006 within a narrow corridor in the northern
hemisphere starting near the equator in the Atlantic
ocean, crossing central and northern Africa, going
across the Mediterranean sea to Turkey and
terminating at sunset in Mongolia (Figure 1a, b). The
previous total solar eclipse occurred in central
Europe, the Middle East, and India on the 11th of
August, 1999. Malin et al. (1999) observed changes
in the declination angle of the geomagnetic field at
the different observatories in Europe during the
previous eclipse. However, Korte et al. (2001)
reported that there was no eclipse-related magnetic
variation observed from various parts of Europe.
However, they found a magnetically quiet period
with magnetic activity index Kp= 1 around the solar
eclipse time (±6 hours). Ionospheric measurements
showed a decrease of electron density during the
eclipse. Hvozdara and Prigancova (2002) studied the
337
GEOPHYSICAL VARIATIONS IN TOTAL SOLAR ECLIPSE
O
90
O
60
O
30
O
0
O
-30
O
-60
-180
O
-120
O
-60
O
0
O
60
O
120
O
180
İSTANBUL
AEGEAN SEA
Reşadiye
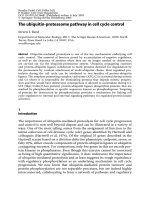
Figure 1. (a) The path of the total solar eclipse on the earth, (b) the corridor in Turkey of the total solar eclipse on the 29th
of March, 2006.
338
O
A. ATEŞ ET AL.
ionospheric and geomagnetic observations during
the eclipse to determine eclipse-induced effects.
According to their study, a mathematical model
based on the Ashour-Chapman model showed a
decrease of the ionospheric total electron content in
the region of the totality belt. They explained that the
geomagnetic disturbances were quantitatively
dependent on the position of both the quasicircular
spot of the ionospheric conductivity decrease and
the given geomagnetic observatory location.
Bencze et al. (2007) correlated geomagnetic
pulsations and interplanetary medium effects during
the solar eclipse on 11th of August, 1999 and found in
the interplanetary medium no indication any
extraordinary event in pulsation activity. They found
that the reason for electron density decreasing as a
both horizontally and vertically widespread
ionospheric effect was explained by a change of the
polarisation angle of about ten degrees in the local
field line resonance band. The solar eclipse effect was
identified as a dramatic clockwise rotation of the
polarisation ellipse of Pc3, Pc4 and Pc5 pulsations.
Wang et al. (2000) obtained anomalous gravity
data in their gravimetric experiments during the
1997 total solar eclipse in China. This could be
evidence for the eclipsing Moon shielding the Sun’s
gravity. They also suggested that the anomalies
might indicate some new property of gravitation.
Gravity measurements were carried out during the
9th of March, 1997 total solar eclipse in Mohe region
in Northeast China by using a high-precision
LaCoste-Romberg gravimeter. The gravity variations
were digitally recorded during the total solar eclipse
so as to investigate possibly anomalous solar and
lunar gravitational pulls on the Earth. There were
two ‘gravity anomaly valleys’ with near symmetrical
decreases of about 6–7 µgal at the first and last
contacts. This anomaly phenomenon was observed
and reported for the first time in the literature (Xin
& Qian 2002). Unnikrishnan et al. (2002) showed
that gravity anomaly observed by Wang et al. (2000)
during the total solar eclipse is not gravitational
shielding and argued that it does not indicate any
new property of gravitation. They suggested two
models that can reproduce the main data features in
Wang et al. (2000). They analyzed Wang et al.
(2000)’s data collected for about a week and obtained
a significant new lower bound of h < 2 × 10–17
cm2/g, two orders better than the existing limits from
any terrestrial experiment, on the Majorana (1920)
gravitational shielding parameter ‘h’. Yang & Wang
(2002) estimated a new gravitational shielding
parameter constraint as h ≤ 6 × 10–18 cm2 g–1 on
Majorana by using the same method.
Flandern & Yang (2003) measured gravitational
effect using a very accurate Foucault-type pendulum
during the 1997 eclipse and found an acceleration of
gravity decrease on the Earth during the solar
eclipse.
During the eclipse the ionisation decreases and
conditions in the shadow zone are similar to those
during the night. After the eclipse it returns to its
former value (Streštík 2001).
Geophysical Observations
During the eclipse two different geophysical
parameters were observed at two different station
locations. Magnetic measurements were carried out
at the recreation field of Ankara University
(39°56'15'' N; 32°49'46'' E, elevation: 853 m). Gravity
measurements were also carried out in F Block, room
313, close the recreation field mentioned above.
Gravity measurements were also done during the
total eclipse on the 11th of August, 1999 (Table 1).
Gravity Measurements
Gravity measurements were carried out by using a
Worden-Master gravimeter. Three measurements
were made at every sampling and these were
averaged to a single value. Gravity variations were
normal until a couple of hours before the total
eclipse. Thereafter fluctuations were observed
th
during total eclipses on the 11 of August, 1999 and
th
29 of March, 2006. The gravity readings were
converted to mGal by multiplying them with the dial
constant of the gravimeter (Figure 2a, b).
Magnetic Measurements
Magnetic measurements were carried out by a
SCINTREX (SM-4) magnetometer with a Caesium
vapour sensor. 5 measurements per second were
339
GEOPHYSICAL VARIATIONS IN TOTAL SOLAR ECLIPSE
Table 1. Gravity measurements data from the total solar
eclipses on 11th of August, 1999 and 29th of March,
2006.
automatically taken and the readings were recorded
to the instrument memory. One average value of 5
magnetic measurements per second was calculated
using a routine arithmetic averaging method. A
decrease of the intensity of the magnetic field was
observed during the eclipse. This situation can be
better observed by fitting a 6 degree polynomial line
to the magnetic anomaly in Figure 3. The reason for
change in the declination angle (D) was explained by
Malin et al. (2000). In order to remove the noise and
the high-frequencies from the magnetic
measurements, the data set shown in Figure 3 was
low-pass filtered using a cut-off frequency of 0.0016
96.2
16:48
15:36
14:24
96.1
13:12
TSE 14:02
Time (minute)
105.95
(b)
11 August 1999
105.90
105.85
105.80
105.75
105.70
105.65
105.60
18:00
16:48
15:36
14:24
105.55
TSE 14:24
13:12
96.24
96.23
96.19
96.17
96.16
96.16
96.16
96.16
96.16
96.18
96.16
96.19
96.19
96.21
96.21
96.22
96.3
96.31
96.39
96.34
96.37
12:00
09:45:00
10:02:00
10:41:00
10:51:00
11:39:00
12:28:00
12:40:00
13:10:00
13:27:00
13:33:00
13:47:00
13:50:00
14:09:00
14:14:00
14:17:00
14:30:00
15:13:00
16:15:00
16:34:00
16:43:00
16:50:00
12:00
105.680
105.661
105.642
105.593
105.574
105.574
105.574
105.574
105.574
105.603
105.584
105.593
105.622
105.622
105.642
105.632
105.700
105.680
105.700
105.690
105.748
105.758
105.777
105.787
105.825
105.845
105.854
105.874
105.903
105.903
105.91
10:48
09:20:00
09:50:00
10:10:00
10:50:00
11:15:00
11:35:00
11:52:00
12:19:00
12:38:00
12:57:00
13:06:00
13:13:00
13:28:00
13:45:00
13:58:00
14:21:00
14:24:58
14:25:00
14:43:00
15:00:00
15:19:00
15:30:00
15:51:00
16:10:00
16:25:00
16:45:00
17:06:00
17:16:00
17:26:00
17:35:00
17:46:00
96.3
10:48
Gravity
(mGal)
09:36
Time
(LT-Ankara)
09:36
Gravity
(mGal)
Bouguer Anomaly (mgal)
Time
(LT-Ankara)
340
29 March 2006
96.4
2006
Bouguer Anomaly (mgal)
1999
(a)
96.5
Time (minute)
Figure 2. (a) Gravity measurements during the 29th of March,
2006 eclipse (the solar image was 96.7% covered by the
Moon), (b) Gravity measurements on the 11th of
August, 1999 (the solar image was 96.7% covered by
the Moon). The shaded zone shows the fluctuations
during the eclipse. Time zone is local (Ankara). TSE:
Total Solar Eclipse
-1
km , obtained from the power spectrum method.
The power spectrum graphic is shown in Figure 4.
The low-pass filtered magnetic data is presented in
Figure 5. In this graphic, the general characteristics
of the magnetic data during the eclipse changed in
amplitude and shape. This abnormal region is
annotated by a perpendicular shade. Time of the
eclipse is shown by a line.
Conclusions
We also took gravity and magnetic measurements
with the available instruments at different locations.
These measurements are as follows:
A. ATEŞ ET AL.
46820
Time (second)
Figure 3. Magnetic measurements in Ankara, Turkey. The red
line shows a six degree polynomial fit to the magnetic
measurements. The shaded zone shows the
fluctuations during the eclipse. Time zone is local
(Ankara). TSE– Total Solar Eclipse
Ln Power (F)
25
Kc= 0.00166 km-1
15
10
5
0
-5
0.00
Time (sec.)
Figure 5. Low-pass filtered magnetic data. Time zone is local
(Ankara). The abnormal region is annotated by the
shaded zone. TSE– Total Solar Eclipse.
fluctuated the gravity that we observed during
eclipses.
30
20
14:51:56
TSE 14:02
14:37:32
12:56:44
46700
14:36:49
14:22:25
14:08:01
13:53:37
13:39:13
13:24:49
13:10:25
TSE 14:02
12:56:01
46700
46720
14:23:08
46720
46740
14:08:44
46740
46760
13:54:20
46760
46780
13:39:56
46780
13:25:32
Filtered Magnetic Field (nT)
Magnetic Field (nT)
46800
29 March 2006
46800
13:11:08
29 March 2006
46820
0.01
0.02
0.03
0.04
0.05
Wavenumber (Km-1)
Figure 4. Power spectrum graphic of magnetic data. The arrow
-1
shows the cut-off wavenumber of 0.00166 km . The
vertical axis is the logarithm of the power. The
horizontal axis is the wavenumber.
th
(i) Gravity measurements were taken during the 11
of August, 1999 and 29th of March, 2006 eclipses
in Ankara.
(ii)Magnetic measurements were taken only during
th
the 29 of March, 2006 eclipse in the recreation
field of the Ankara University.
The ionisation in the E-layer decreased to 65% of
its normal value (van Zandt et al. 1960). Due to
changing ionisation conditions during the day, the
intensity of Earth’s magnetic field showed
abnormality during the eclipse. Ionospheric
measurements showed a decrease of electron density
during the eclipse on 11th of August, 1999 (Korte et
al. 2001; Hvozdara & Prigancova 2002). The reason
for electron density decrease as both a horizontally
and vertically widespread ionospheric effect was
explained by a change of the polarisation angle by
about ten degrees in the local field line resonance
band by Bencze et al. (2007) during the total solar
eclipse in 1999.
The magnetic data are available digitally on a
hard disk. Send a blank CD or DVD to the authors if
you request the data.
Acknowledgements
Fluctuations observed during total eclipses on the
11 of August, 1999 and 29th of March, 2006 could be
explained as the shielding effect of the Moon. The
Sun’s and Earth’s gravity pull in opposite directions.
Hence, the different positions of the Moon caused
mass movement of the atmosphere. This effect
th
The authors thank the anonymous referee for her/his
suggestions on the manuscript. We also thank Editor
Erdin Bozkurt for his delicate handling of this paper.
A group of graduate students from Geophysical
Engineering Department of Ankara University
helped during the measurements.
341
GEOPHYSICAL VARIATIONS IN TOTAL SOLAR ECLIPSE
References
BENCZE, P., HEILIG, B., ZIEGER, B., SZENDROI, J., VERO, J., LUHR, H.,
YUMOTO, K., TANAKA, Y. & STREŠTÍK, J. 2007. Effect of the
August 11, 1999 Total Solar Eclipse on Geomagnetic
Pulsations. Acta Geodaetica et Geophysica Hungarica 42, 23–
58.
FLANDERN, T.V. & YANG, X. S. 2003. Allais gravity and pendulum
effects during solar eclipses explained. Physical Review D 67,
022002, DOI: 10.1103/PhysRevD.67.022002.
HVOZDARA, M. & PRIGANCOVA, A. 2002. Geomagnetic effects due to
an eclipse-induced low-conductivity ionospheric spot. Journal
of Geophysical Research 107 (A12), 1467, doi:10.1029/
2002JA009260.
KORTE, M., LÜHR, H., FÖRSTER, M. & HAAK, V. 2001. Did the solar
eclipse of August 11, 1999, show a geomagnetic effect? Journal
of Geophysical Research 106 (A9), 18563–18575.
MAJORANA, Q. 1920. On gravitation: theoretical and experimental
results. Philosophical Magazine 39, 488–504.
MALIN, S.R.C., ÖZCAN, O., TANK, S.B., TUNCER, M.K. & YAZICICAKIN, O. 2000. Geomagnetic signature of the 1999 August 11
total eclipse. Geophysical Journal International 140, F13–F16.
342
STREŠTÍK, J. 2001. The response of the 11 August 1999 Total Solar
Eclipse in the geomagnetic field. Earth Moon and Planets 85–
86, 561–566.
WANG, Q., YANG, X., WU, C., GUO, H., LIU, H. & HUA, C. 2000.
Precise measurement of gravity variations during a total solar
eclipse. Physical Review, D041101, DOI: 10.1103/PhysRevD.
62.041101.
UNNIKRISHNAN, C.S., MOHAPATRA, A.K. & GILLIES, G.T. 2002.
Anomalous gravity data during the 1997 total solar eclipse do
not support the hypothesis of gravitational shielding. Physical
Review D 63, 062002, DOI: 10.1103/PhysRevD.63.062002.
VAN ZANDT, T.E., NORTON, R.B. & STONEHACKER, G.H. 1960.
Photochemical rates in the Equatorial F2-region from 1958
Eclipse. Journal of Geophysical Research 65, 2003–2009.
XİN, X.S. & QİASAN, S. W. 2002. Gravity anomaly during the Mohe
total solar eclipse and new constraint on gravitational
shielding parameter, Astrophysics and Space Science 282, 245–
253.
YANG, X.S. & WANG, Q.S. 2002. Gravity anomaly during the Mohe
total solar eclipse and new constraint on gravitational
shielding parameter. Astrophysics and Space Science 282, 245–
253.