Assessing impacts of climate change to landuse sector in Vinh Long province
Bạn đang xem bản rút gọn của tài liệu. Xem và tải ngay bản đầy đủ của tài liệu tại đây (1.35 MB, 12 trang )
TẠP CHÍ PHÁT TRIỂN KHOA HỌC & CÔNG NGHỆ:
CHUYÊN SAN KHOA HỌC TỰ NHIÊN, TẬP 1, SỐ 6, 2017
Assessing impacts of climate change to
landuse sector in Vinh Long province
Le Ngoc Tuan
University of Science, VNU-HCM
Nguyen Van Bang
Institute of Meteorology, Hydrology, Oceanology and Environment
Email:
(Received on 29th December 2016, accepted on 17th January 2017)
ASBTRACT
sector in VinhLong province, especially
agricultural land. In all 8 considered districts, in
the context of CC, landuse sectors in VungLiem,
TraOn, and MangThit districts were of the
consideration. Besides, this research indicated
strengths, weaknesses, opportunities, and threats
of land use sector in the relationship to CC in the
local which are important basis for planning
suitable adaption measures.
This work aimed at assessing impacts of
climate change (CC) on landuse sector in Vinh
Long province to 2020. Flood, saltwater intrusion
(SI), drought, landslide, storm, temperature,
rainfall were taken into consideration and
assessed by data collection, matrix, expert, SWOT,
and GIS methods, etc. Results showed that flood
and SI were the main factors impacting landuse
Key words: land use, climate change, saltwater intrusion, flood
INTRODUCTION
Climate change (CC) is one of the top
concerns of nations and tenrritories all over the
world. In this context, Vietnam is one of the 5
countries the most affected [1], especially the delta
and coastal areas such as the MeKong Delta with
the risks of about 39 % acreage flooded in case of
1m sea level rise [2]. Therefore, impacts of CC
(both positive and negative) need assessing to
provide the necessary information to perform
plans, projects, monitors, etc. contributing to the
improvement of the adaptability of the system.
CC with manifestations such as temperature
increase, precipitation changes, sea level rise, the
extreme weather phenomena, etc. heavily impact
people and socio-economic sectors where land use
is one of sensitive subjects to CC [3, 4], especially
to flood and saltwater intrusion (SI). Many
different methods have been used to study the
relationship between CC and landuse sector, such
as: methods based on historical climate data to
assess impacts on landuse sector [5]; linked
diagram among CC, disaster management, and
landuse planning to propose suitable adaption
measures [6]; CLUE model (Conversion of Land
Use and Effect) to assess impacts of CC on landuse
planning [7-9], Stochastic Climate model to assess
impacts of temperature, wind speed, and
precipitation on landuse planning [10]; GIS and
remote sensing to assess impacts of rainfall,
temperature in particular and CC in general on
landuse [11, 12]; place-based model (integrating
social, environment, and natural systems) to assess
vulnerability [13, 14], etc. Beatley [15] indicated
that sustainability, decreasing risks, and the
adaptation of community are important factors to
balance the relationship between CC and landuse
planning.
Vinh Long province is located in the MeKong
Delta where could be the most flooded in the
context of sea level rise [2]. The terrain is
relatively low as compared to sea level,
consequently, the north of the QL1 (Highway 1) is
Trang 225
SCIENCE & TECHNOLOGY DEVELOPMENT JOURNAL:
NATURAL SCIENCE, VOL 1, ISSUE 6, 2017
usually inundated by flood; area between the QL1
and Mang Thit river is often inundated by both
flood and tide; the south of Mang Thit district is
mostly flooded by tide. Flooding time is about 2 to
4 months. Besides, SI is also the concern when
maximum salinities in main rivers of Vinh Long
province have increased over the years (20072016) and increasingly enter the inland (1 ‰
salinity boundary). In 2016, higher salinities were
recorded in Hau river, Vung Liem, Mang Thit, and
Tra On districts (2 ‰ salinity boundary);
moreover, salinity boundary of 8 ‰ was appeared
in Vung Liem district. In addition, natural
disasters such as riverbank landslide, storm,
drought, etc. have also happened quite frequently,
thus seriously impacted lives and production of the
local, especially in the context of CC [16].
Therefore, this research aimed at assessing
impacts of CC on landuse sector in Vinh Long
province to 2020, indicating landuse types needing
taking into account according to main impacts of
CC, providing basis for planning adaptive
measures, contributing to the sustainable
development goals of the local.
METHODS
Impacts of CC were assessed by related
factors such as flood, SI, drought, storm,
precipitation, and temperature on landuse sector of
Vinh Long province (including Vinh Long city,
VungLiem, MangThit, TraOn, TamBinh,
BinhTan, BinhMinh, and LongHo districts).
Agricultural and non-agricultural land groups
were taken into consideration due to a very small
acreage of unused land group (about 0.09 %) [17].
Data collection and processing method
Data and documents related to landuse, the
local CC factors, damages, CC coping plans of the
landuse sector, etc. were collected, then processed
by Excel software. Besides, research aimed at
assessing impacts of CC so simulation results of
CC scenarios (by SIMCLIM software, according
to AR4 record of IPCC [18]), risks of SI and flood
due to sea level rise in the context of CC were
inherited. Our previous research showed that in
2020, according to the average emission scenario
(B2), temperature and precipitation in Vinh Long
province would be 27.64 oC and 1,491.80 mm,
respectively. For water level, it would increase
about 9cm as compared to that in the reference
period (1980–1999).
Geographic Information System (GIS) method
The work used Mapinfo 11.5 and ArGIS
software to establish maps and calculate impact
scope of flood, SI, temperature, and rainfall, etc.
on landuse in Vinh Long province to 2020.
CC risk assessment matrix
This method was used to assess risks due to
CC factors to landuse sector serving determination
of concerned areas with respective causes (i.e. the
concerned areas and affecting subjects).
Depending on occurrence possibility and related
damages, risk level due to each CC factor in each
local was assessed and classified according to the
following scale as presented in Table 1.
Table 1. Risk level scale due to CC
0 < RR ≤ 1
Very low
1 < RR ≤ 2
Low
2 < RR ≤ 3
Average
Expert method
This method was used to determine weights of
CC factors in the relationship to landuse sector
Trang 226
3 < RR ≤ 4
High
4 < RR ≤ 5
Very high
based on 20 experts’ opinions: (i) Ranking
importances of CC factors to landuse sector (The
more important the factor is, the higher the ranking
TẠP CHÍ PHÁT TRIỂN KHOA HỌC & CÔNG NGHỆ:
CHUYÊN SAN KHOA HỌC TỰ NHIÊN, TẬP 1, SỐ 6, 2017
score will be); (ii) Determining ranking score of
each factor (mi): mi = Total score of factor i /
Number of questionaires; (iii) Calculating
intermediate weightof each factor (wi'):
+ Accepting that minimum mi
has wi' = 1.0
+ Calculating wi' of other factors
by formula:
+ Calculating final weight of
each factor (wi):
wi '
wi
mi (min)
mi
w i'
n
w i'
1
SWOT method (S-Strengths; W-Weaknesses; OOpportunities; T-Threats)
SWOT was used to determine causes and to
propose adaption measures to CC of landuse sector
in Vinh Long province: (i) Determine S and W of
landuse sector in Vinh Long province; (ii) Determine
O and T of external factors impacting landuse sector
in relation to CC; (iii) Analyse and combine logic
pairs (S-O, S-T, W-O, W-T), then determine
defective chains and propose compatible adaptive
measures.
RESULTS AND DISCUSSION
Current status and landuse planning in Vinh
Long province to 2020
Agriculture is a main economic activity,
accounting for over 78 % of the natural area [17],
contributing more than 33 % of the total economic
value of sectors in Vinh Long province [19]. Rice
planting activities (LUC) dominates agricultural area
mainly distributed in Tam Binh, Vung Liem, and Tra
On districts; followed by perennial land (CLN),
about 19,200 ha, mostly in Tra On, Long Ho, and
Vung Liem districts. For non-agricultural land
group, (i) countryside and urban living lands are
mainly distributed in Tam Binh and Tra On districts;
(ii) dedicated land for other purposes (offices,
security, defense, business, public, etc.) are mostly in
Long Ho, Mang Thit districts and Vinh Long city,
etc. Unused land, about 110ha, accounting for 0.09
% of the natural area of Vinh Long province. By
2020, in Vinh Long province, there will be 74.08 %
of natural area used for agricultural activities and the
rest (25.92%) for non-agricultural ones [17].
Impact assessment of CC to land use sector in
Vinh Long Province
Agricultural land group
Inundation by tide: Inundation is the factor that
most strongly influenced agricultural land types in
Vinh Long Province.
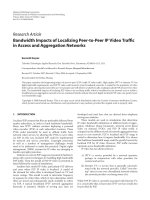
Regarding rice, calculations showed about
20.000 ha of rice area (LUC) to be affected by flood,
accounting for nearly 28 % of total rice land area in
the province. Districts were heavily affected as Vung
Liem (6,680.15 ha, 45.16 %), Long Ho (2,909.09 ha,
42.91 %), and Tam Binh (2,886.87 ha, 17.23 %). By
2020, flooded area could discrease (about 19,850 ha)
but flooded rate could increase (accounting for
30.8% of the rice land area in the province) (Table 2,
Fig.1A). This can be explained by the change in rice
landuse planning in 2020.
Besides, perennial land group (CLN) was also
impacted by flood. Calculation showed about 4,543
ha of perennial plant area to be flooded (accounting
for 23.64 %), distributed in Long Ho, Binh Minh, and
Tra On districts (Fig.1B). By 2020, flooded perennial
plant area could be about 3,544 ha. Similar to rice,
because of adjusting landuse planning, flooded
perennial plant area could dicrease while flooded rate
tends to increase (Table 2).
The province has 1,750 ha of annual crop land
(HNK) but 323 ha was flooded (accounting for
18.44%). Binh Minh district had the largest flooded
area. Calculations for 2020 showed flooded annual
crop area to be about 378.7 ha, increasing about 56
ha as compared to that in the current status. Binh
Minh district needs taking into concern due to about
93 % of annual crop area likely affected by flood
(Table 2).
Regarding aquacultural activities (NTS), the
province has 1,109 ha for this purpose but 43 % of
which was in risk of flood, especially in Long Ho and
Trang 227
SCIENCE & TECHNOLOGY DEVELOPMENT JOURNAL:
NATURAL SCIENCE, VOL 1, ISSUE 6, 2017
Tam Binh districts. By 2020, following the increase
On, Long Ho, Vung Liem, and Mang Thit districts
in aquaculture area in the province (2,052 ha), the
(Table 2).
area sensitive to flood could expand, including Tra
Table 2. Agricultural area (ha) having the risk of flood
Code
Times
Current
LUC
2020 –
B2
Current
CLN
2020 –
B2
Current
NTS
2020 –
B2
Current
HNK
2020 –
B2
Current
Total
2020 –
B2
ha
%
ha
%
ha
%
ha
%
ha
%
ha
%
ha
%
ha
%
ha
%
ha
%
Binh
Minh
1,465.6
37.1
1,084.1
36.3
879.6
55.6
579.3
58.6
19.3
59.8
56.5
82.3
156.5
65.1
203.2
93.0
2,521.0
43.5
1,923.2
45.1
(A)
Binh
Tan
2,050.4
21.3
1,733.4
20.7
115.4
11.4
76.5
11.0
6.5
4.6
23.5
5.1
34.6
9.5
2,195.8
19.6
1,844.5
18.9
Long
Ho
2,909.1
42.9
2,607.3
44.9
957.6
26.8
970.0
33.1
168.2
51.4
198.4
71.4
34.0
36.0
46.6
36.7
4,068.9
37.8
3,822.4
41.8
Mang
Thit
1,713.1
24.6
1,839.1
29.8
404.2
19.8
457.2
28.4
63.7
49.0
139.1
72.0
20.0
30.8
85.9
80.1
2,200.9
23.9
2,521.2
31.2
Tam
Binh
2,886.9
17.2
2,650.6
16.7
288.0
13.4
245.7
13.8
102.3
56.4
35.2
34.9
30.0
11.1
8.3
18.5
3,307.2
17.1
2,939.8
16.5
Vinh
Long city
107.8
23.2
26.6
9.1
577.5
46.7
4.8
12.8
22.7
67.9
6.9
22.8
714.9
40.5
31.4
9.5
Tra On
2,141.2
17.7
2,327.1
20.3
674.4
15.2
532.2
15.4
39.1
41.3
417.7
76.1
23.1
8.4
2,877.8
17.0
3,277.0
21.1
Vung
Liem
6,680.2
45.2
7,581.9
56.0
646.4
20.2
678.0
25.8
56.2
32.9
174.2
30.9
28.9
9.0
7,411.6
40.1
8,434.2
50.4
(B)
Fig. 1. Maps of current status of inundation in Vinh Long province: (A) rice land; (B) perennial plant land
-
SI and drought
Trang 228
Total
19,954.3
28.0
19,850.1
30.8
4,543.0
23.6
3,543.7
25.1
477.9
43.1
1,021.2
49.8
322.8
18.4
378.7
40.4
25,298.0
27.1
24,793.7
30.4
TẠP CHÍ PHÁT TRIỂN KHOA HỌC & CÔNG NGHỆ:
CHUYÊN SAN KHOA HỌC TỰ NHIÊN, TẬP 1, SỐ 6, 2017
Table 3. Agricultural area (ha) having the risk of SI in Vinh Long province
Code
Times
Current
LUC
2020 – B2
Current
CLN
2020 – B2
Current
NTS
2020 – B2
Current
HNK
2020 – B2
Current
Total
2020 – B2
ha
%
ha
%
ha
%
ha
%
ha
%
ha
%
ha
%
ha
%
ha
%
ha
%
Mang Thit
1‰
4‰
582.64
0
Tra On
1‰
4‰
1,036.15
0
Vung Liem
1‰
4‰
13,016.78
767.28
Total
1‰
14,635.57
8.38
991.33
16.09
625.74
30.59
827.71
51.39
35.74
27.51
112.34
58.13
6.02
9.29
0
8.56
2,475.29
21.61
144.99
3.28
403.29
11.64
0.90
0.94
15.06
2.74
3.89
1.43
0
88.01
12,915.94
95.48
2,873.62
89.78
2,508.01
95.53
171.42
95.7
571.42
98.88
275.69
86.03
0
5.19
2,032.32
15.02
257.42
8.04
834.37
31.78
21.86
12.21
258.84
44.79
83.74
26.13
0
20.50
16,382.56
25.41
3,644.35
18.96
3,739.01
26.44
208.06
18.76
698.81
34.05
285.60
16.31
0
1.07
2,032.32
3.15
257.42
1.34
834.37
5.90
21.86
1.97
258.84
12.61
83.74
4.78
0
16,337.50
88.39
15,995.37
95.60
1,130.9
6.12
3,125.54
18.68
18,773.57
20.08
20,820.38
25.52
1,130.29
1.21
3,125.54
3.83
1,250.15
13.60
1,931.37
23.93
0
0
0
0
0
0
0
0
0
1,185.92
7.02
2,893.64
18.64
0
0
0
0
0
0
0
0
0
4‰
767.28
In all landuse types in Vinh Long province,
agriculcutal landuse is the most sensitive to SI,
especially in Vung Liem (0.5–4 ‰), Mang Thit
(0.5–1 ‰), and Tra On districts (0.5–1 ‰).
Calculated results showed about 18,700 ha (20.08
% of total agriculcutal area in the province) and
about 1,130 ha of agriculcutal area (1.21 %) to be
in 1 ‰ and 4 ‰ salty areas, respectively (Table
3).According to medium emission scenario
(B2 scenario), SI tends to expand in southern area of
Tra On district and northern area of Mang Thit
district, nearby Hau river and Co Chien river.
Vung Liem district could be mostly affected
because most agricultural area was in 1 ‰ salty
area (Table 3), in which, a part of Trung Nghia,
Trung Ngai, Trung Thanh Dong, and Quoi Thien
communes were affected by salinity of 4 ‰ (Fig.
2 and 3).
(A)
(B)
In all landuse types, rice and perennial plant
land areas were significantly affected by SI,
especially Vung Liem, Mang Thit, and Tra On
districts. Notably, by 2020, the area affected by SI
could expand larger than that in the current status.
Fig. 2. Rice land having risk of SI in Vinh Long province: (A) Current status, (B) 2020 – B2 Scenario
Trang 229
SCIENCE & TECHNOLOGY DEVELOPMENT JOURNAL:
NATURAL SCIENCE, VOL 1, ISSUE 6, 2017
Beside SI, drought is also the factor
exacerbating impacts of SI. Drought often occurs
in high areas not taking advantages of gravity
irrigation and semi-gravity irrigation, leading to
the propagation of salinity to inland, and then
affect the growth of rice as well as domestic water
supply. In 2016, drought harmed 1,884 ha of crop
in Vung Liem district, corresponding to 16 billion
VND [19].
(A)
(B)
Fig. 3. Perennial plant land having risk of SI: (A) Current status, (B) 2020 – B2 Scenario
-
Non-agricultural land groups
Other phenomena
Riverbank landslide often occurs in soft
ground areas nearby riverbank and mostly affects
irrigation works, houses, traffic, etc. For
agricultural
landuse
sector,
landslide
insignificantly affects. Temperature, rainfall, and
storm in Vinh Long province also resulted in
similar statements.
To sum up, flood and SI are 2 main factors
affecting agricultural land group of Vinh Long
province, especially the rice land. This work also
indicated agricultural landuse sector in Vung Liem
(due to flood, SI), Long Ho (due to flood), Tam
Binh (due to flood), and Tra On (due to SI)
districts need taking into the consideration. By
2020, in the context of CC increasingly serious,
agricultural landuse sector in Vinh Long province
also face to more risks.
-
Inundation by tide
Calculated results showed about 9,146.65 ha
of non-agricultural land area to be inundated (25%
of total non-agricultural land area). Long Ho,
Vung Liem, Tam Binh districts, and Vinh Long
city need taking into the consideration due to more
than 1,000 ha of non-agricultural land area
inundated in each local. By 2020, the risk of flood
could be 2 times as many as that in the current (up
to 17,411.67 ha) due to impacts of sea level rise as
well as the increase in total area of nonagricultural land (over 50,000 ha) according to
landuse planning. Long Ho, Vung Liem districts
and Vinh Long city could be still sensitive areas to
flood and CC (Table 4).
Table 4. Area (ha) of non-agricultural having the risk of flood in Vinh Long Province
Code
OTC
Binh Minh
Current
2020 – 2nd
Trang 230
ha
%
ha
774.1
41.0
1,296.3
Binh Tan
423.6
18.6
640.4
Long Ho
1,412.8
29.3
2,415.8
Mang
Thit
724.8
21.5
1,211.2
Tam Binh
1,045.6
16.4
1,381.7
Vinh
Long
785.9
53.4
1,405.8
Tra On
938.4
15.3
1,479.0
Vung
Liem
1,668.8
23.7
2,927.5
Total
7,774
23.3
12,757.7
TẠP CHÍ PHÁT TRIỂN KHOA HỌC & CÔNG NGHỆ:
CHUYÊN SAN KHOA HỌC TỰ NHIÊN, TẬP 1, SỐ 6, 2017
Current
CDG
2020 – 2nd
Current
NTD
2020 – 2nd
Current
Total
2020 – 2nd
%
ha
%
ha
%
ha
%
ha
%
ha
%
ha
50.5
143.0
64.3
522.5
43.1
7.0
34.2
7.8
39.2
924.2
43.3
1,826.6
20.8
118.0
65.7
545.1
45.9
1.7
9.6
1.3
7.4
543.4
21.9
1,186.7
41.6
389.1
61.4
1,001.6
57.6
23.6
32.3
30.6
41.1
1,825.4
33.0
3,448.1
29.2
131.0
27.8
470
45.2
17.8
19.7
25.1
31.2
873.6
22.2
1,706.3
18.8
99.7
47.7
359.3
32.5
9.3
20.0
17.6
29.6
1,154.6
17.4
1,758.6
61.2
282.8
92.2
867.4
68.2
27.5
64
22.9
53.5
1,096.2
60.2
2,296.1
20.6
16.5
14.6
333.2
32.0
14.2
11.5
20
17.1
969.0
15.2
1,832.2
35.4
41.1
32.4
365.4
42.3
50.4
29.1
64.1
36.4
1,760.2
24
3,357.1
31.4
1,221.2
54.0
4,464.5
47.2
151.4
25.8
189.4
32,2
9,146.6
25.2
17,411.7
%
48.1
27.7
45.3
32.4
20.7
63.6
22.0
36.0
34.3
(A)
(B)
Fig. 4. Land having risk of flood in Vinh Long province: (A) Current status, (B) 2020 – Scenario
According to Table 4, while graveyard land is
only 587 ha (1.6 %) and insignificantly changes to
2020, living land and dedicated land are 2 main
types of non-agricultural land with 33,419.97 ha
(92 %) and 2,261.2 ha (6 %), respectively,
therefore, the latter two types were taken into the
consideration in this work.
Living land: total flooded area was about
7,774 ha (23 % of province area). By 2020,
flooded rate tends to increase. With specific
characteristics of urban area, Vinh Long city and
Binh Minh town had the highest rate of flooded
area corresponding to 41 % and 53.4 %. These
figures could be 50.5 % and 61.2 %, respectively
in 2020 (Table 4 – Fig. 4).
Dedicated land: calculated results showed
more than 1,200 ha (54 %) of dedicated land could
be flooded currently; distributed in Vinh Long city
(282 ha, accounting for 92 %), the highest flooded
rate of dedicated land, followed by Binh Tan, Binh
Minh, and Long Ho districts corresponding 118 ha
(65.7 %), 143 ha (64.25 %), and 389 ha (61.4 %),
respectively (Table 4). By 2020, the flooded
dedicated land area in the whole province could
increase as 4 times many as that in the current
status, about 4,464 ha, noted in Long Ho, Vinh
Long city, and Binh Tan. It could be explained by
impacts of sea level rise in the context of CC as
well as the expansion of dedicated land area in the
future (9,461.77 ha, as 4 times more than as that in
the current status).
-
Riverbank landslide
Riverbank landslide often occurs in the
province, especially in Tra On, Vinh Long City,
Trang 231
SCIENCE & TECHNOLOGY DEVELOPMENT JOURNAL:
NATURAL SCIENCE, VOL 1, ISSUE 6, 2017
Vung Liem, and Long Ho districts. In 2014, there
were 6 landslide positions in the inland and along
main rivers in Mang Thit, Long Ho districts and
Vinh Long city, destroyed about 250m of
riverbank, dikes, and roads, etc. In 2015, there
were 39 landslide positions extraordinarily
occuring (excepting the landslide positions at
construction sites), resulting in damages to
property, houses, crops as well as the human’s
life [21]. In genreal, landslide affects
infrastructures in Vung Liem, Long Ho, Tra On,
and Mang Thit districts, especially in Vinh Long
city.
-
Other phenomena
Drought: in recent years, droughts have
widely occurred at the end of April. Vung Liem,
Binh Tan, Tam Binh, and a part of Binh Minh
districts (Dong Thanh commune) are needed to be
yaken into the consideration. However, drought as
well as SI insignificantly affect non-agricultural
landuse in the province while rainfall and storm
mostly affect infrastructures and people.
Similar to agricultural land group, flood is the
top concern of non-agricultural land group in Vinh
Long province. Besides, riverbank landslide also
causes certain impacts. Accordingly, nonagricultural landuse sector in Long Ho, Vung
Liem, Tam Binh districts and Vinh Long city need
concerning in the context of CC.
Determination of concerned CC factors and
hotspot areas
Based on the impact level and possibility of
appearance of CC factors, the CC risk assessment
matrix for landuse sector in Vinh Long province
was presented in Table 5.
Table 5. The CC risk assessment for landuse sector in Vinh Long province (*: weight)
District/
city
Binh
Minh
Binh Tan
Long Ho
Mang
Thit
Tam Binh
Vinh
Long city
Tra On
Vung
Liem
Total
Current
2020
Current
2020
Current
2020
Current
2020
Current
2020
Current
2020
Current
2020
Current
2020
Current
2020
SI
Flood
0.19*
0
0
0
0
0
1
3
4
0
1
0
0
3
4
4
5
10
15
0.23
2
3
1
2
4
4
2
3
4
4
2
3
3
4
4
5
22
28
Landslide
0.18
1
1
0
0
0
1
1
0
0
0
2
2
2
2
1
1
7
7
Drought
Table 5 indicated the flood and SI, main
factors increasing risk for landuse sector of Vinh
Long province, especially flood due to its wide
scope and high level of impacts. The areas are
needed to be taken into the consideration in the
Trang 232
0.12
1
1
0
0
0
0
0
0
1
1
0
0
0
0
3
3
5
5
Temperature
0.11
0
0
0
0
0
0
0
0
0
0
0
0
0
0
0
0
0
0
Rainfall
0.1
0
0
0
0
0
0
0
0
0
0
0
0
0
0
0
0
0
0
Storm
0.07
0
0
0
0
0
0
0
0
0
0
0
0
0
0
0
0
0
0
Total
Average
0.76
0.99
0.23
0.46
0.92
1.29
1.21
1.45
1.04
1.23
0.82
1.05
1.62
2.04
2.22
2.64
Max
2
3
1
2
4
4
3
4
4
4
2
3
3
4
4
5
relationship between landuse sector and CC
factors include Vung Liem, Tra On, and Mang
Thit districts (due to flood and SI), Vinh Long city
and Binh Minh town (due to flood) (Fig. 5).
TẠP CHÍ PHÁT TRIỂN KHOA HỌC & CÔNG NGHỆ:
CHUYÊN SAN KHOA HỌC TỰ NHIÊN, TẬP 1, SỐ 6, 2017
(A)
(B)
Fig. 5. Current status of risk index due to CC of landuse sector in Vinh Long Province: (A) Average; (B) Maximum
Opportunities and Threats of land use sector in Vinh Long province in the context of CC
Table 6 recapitulated of strenghts, weaknesses, opportunities, and threats of landuse sector in Vinh
Long province in the context of CC.
Table 6. Strenghts, weaknesses, opportunities, and threats of landuse sector in Vinh Long province in
the context of CC
Strenght (S)
Weakness (W)
- S1: Relative flat terrain; inning from Tien river and Hau
river; relative good soil quality (balances nutritional
ingredients) [16].
- W1: Hollow terrain and relative low (high risk of tidal
flooding).
- S2: Located in the center of Mekong delta; thriving
agriculture sector; ensurement of local food security.
- S3: Medium adaptive capability to CC of the community
and local authorities [20].
- S4: Being particularly interested planning and orientation
of exploiting and developing landuse sector to 2020, vision
to 2030 [16].
- S5: Investment of irrigation system and dikes to prevent
flood, riverbank landslide, etc [20].
Opportunities (O)
- O1: Advantages for agricultural sector due to an increase in
temperature and prolonged dry season (to dry agricultural
products, etc)
- O2: Opportunities to mobilize finance to cope with CC and
disasters from government, local authorities, and
international sources (AFD, New Zealand partnerships for
International Development Fund, etc), [22]
- W2: Limited experience of response to CC of community
in some locals [20].
- W3:Limited capability of accessing CC information of
community [20].
- W4: Lack of adequate attention of responding to climate
change in a number of state authorities [20].
- W5: Low effectiveness in implementation of CC coping
plan in some locals (i.e. discrete, not focus) [20].
- W6: Complex river system; Being affected by semi-diurnal
tide (risk of SI)
Threats (T)
- T1: Occurrence of flooding almost over the province;
tendency to increase to 2020.
- T2: SI in Vung Liem, Tra On, and Mang Thit districts;
tendency to increasingly propagate to the inland
- T3: Risks of droughts combining to tides
- O3: Ease of spreading CC information on different media
(Tv, internet, newspaper, etc.)
Accordingly, relationships among S, W, O,
and T were as follows:
(i) S1 + O2: Increasing investment (both
internal and external of the province) to improve
Trang 233
SCIENCE & TECHNOLOGY DEVELOPMENT JOURNAL:
NATURAL SCIENCE, VOL 1, ISSUE 6, 2017
agricultural land quality and ensure the food
security.
(ii) S2 + O1: Taking advantages of
temperature increase to diversify ways of
processing agricultural products and to save
energy.
(iii) S3 + O3: Improving the respond capacity
to CC of community and local authorities by
assistant programs, finance sources from
government and local authorities as well as
international organizations.
(iv) O3 – W3: Increasing the response
capability to CC by increasing communication
programs.
(v) O2 – W1, W6: Taking advantages of
funding and financial supports; studying and
constructing suitable tidal dyke system as well as,
minimize SI.
(vi) S3 - T1, T2, T3: Promoting the strengths
of coping capacity of community in the context of
increasingly serious CC.
(vii) S4 – T1, T2: Studying and suitable
allocating land resource to ensure the socioeconomic development as well as to minimize CC
damages.
(viii) S5 – T1: Taking into account effects of
flooding in designing and constructing irrigation
system in the local.
(ix) T2 – W1: Setting up pump stations,
irrgation dikes, etc. to minimize CC impacts on
low terrain and hollow areas in the local.
Trang 234
(x) T1, T2 – W5: Planning the CC response
programs, especially response to flooding and SI
for landuse sector.
To sum up, solutions contributing to improve
the respond capacity to CC of landuse sector in
Vinh Long province including: adaptive measures
(iii, v, vii, ix, x), mitigative measures (ii) and
assistant measures (i, iv, vi, viii), matching the
Support Programme to respond to climate change
in Vietnam [23].
CONCLUSION
The research aimed at assessing impacts of
CC on landuse sector in Vinh Long province to
2020. Regarding the agricultural land group (the
most affected group), flooding and SI were 2 main
factors impacting most seriously, especically in
Vung Liem (flooding, SI), Tra On (flooding), and
Mang Thit (flooding) districts. Droughts partly
impacted Vung Liem district while rainfall,
temperature, and storm insignificantly affected.
Regarding non-agricultural land group, flooding
and riverbank landslide need the attention,
especically in Vinh Long city (flooding,
landslide), Binh Minh town (flooding), and Tra On
district (landslide). SI, temperature, rainfall, and
storm, etc. had little impacts on this landuse type.
Besides, this work analyzed strengths,
weaknesses, opportunities, and threats of landuse
sector in Vinh Long province. Measurementthe
adaptive capacity to CC was then suggested,
contributing to increase the CC response
efficiency in the local.
TẠP CHÍ PHÁT TRIỂN KHOA HỌC & CÔNG NGHỆ:
CHUYÊN SAN KHOA HỌC TỰ NHIÊN, TẬP 1, SỐ 6, 2017
Đánh giá tác động của biến đổi khí hậu đến
lĩnh vực sử dụng đất tỉnh Vĩnh Long
Lê Ngọc Tuấn
Trường Đại học Khoa học Tự nhiên, ĐHQG-HCM
Nguyễn Văn Bằng
Viện Khí tượng Thủy văn Hải văn và Môi trường
TÓM TẮT
vực SDĐ tỉnh Vĩnh Long, đặc biệt là loại hình đất
nông nghiệp. Trong tất cả 8 huyện thị được xét,
trước những diễn biến bất lợi của BĐKH, các địa
phương có lĩnh vực SDĐ đáng quan tâm bao gồm
huyện Vũng Liêm, Trà Ôn và Mang Thít. Bên cạnh
đó, nghiên cứu cũng chỉ ra các thế mạnh, điểm
yếu, cơ hội và thách thức của lĩnh vực SDĐ trong
mối quan hệ với BĐKH tại địa phươnglàm cơ sở
quan trọng để hoạch định các giải pháp thích ứng
tương thích.
Từ khóa: sử dụng đất, biến đổi khí hậu, xâm nhập mặn, ngập lụt
Nghiên cứu nhằm mục tiêu đánh giá tác động
của biến đổi khí hậu (BĐKH) đến lĩnh vực sử dụng
đất (SDĐ) tỉnh Vĩnh Long đến năm 2020. Các yếu
tố được xem xét, đánh giá bao gồm ngập, xâm
nhập mặn (XNM), hạn hán, sạt lở, giông lốc, nhiệt
độ và lượng mưa thông qua các phương pháp tổng
hợp tài liệu, ma trận đánh giá, phương pháp
chuyên gia, phân tích SWOT, GIS…. Kết quả cho
thấy ngập và XNM tác động nhiều nhất đến lĩnh
REFERENCES
[1]. World Bank. 2007. World Development
Report.
[2]. Bộ Tài nguyên và Môi trường. 2012. Kịch
bản Biến đổi khí hậu và nước biển dâng cho
Việt Nam.
[3]. Mendelsohn, Robert, The Impact of Climate
Change on Land. Climate Change and Land
Policies, eds. Ingram, Gregory K. and YuHung Hong. Cambridge, MA: Lincoln
Institute of Land Policy, 62–83 (2011).
[4]. North East Climate Science Center –
NECSC, Climate impacts on land-use and
land-cover
change
(2016).
/>[5]. A. Campbell, Climate change adaptation in
the Metropolitan Washington Region: Draft
Transportation
Sector
Vulnerabilities.
Metropolitan Washington Council of
Governments (MWCOG, COG (2011).
[6]. Bajracharya at el., Climate change
adaptation through land use planning and
disaster management: Local government
perspectives from Queensland. 17th Pacific
Rim Real Estate Society Conference:
Climate change and property: Its impact now
and later. 16-19/1/2011, Gold Coast (2011).
[7]. M.H.V.Meijl, T.van Rheenen, A.Tabeau,
B.Eickhout, The impact of different policy
environments on agricultural land use in
Europe,Agr. Ecosyst. Environ, 114, 21–38
(2006).
[8]. P.H.Verburg, B.Eickhout, H.van Meijl, A
multi-scale, multi-model approach for
analyzing the future dynamics of European
land use, The Annals of Regional Science, 42,
57–77 (2008).
[9]. M. van Dijk, M. Rutten, W. van Rooij, H.
Hilderink, Land Use Dynamics, Climate
change, and food security in Vietnam: A
global-to-local modeling approach,World
Development, 59, 29–46 (2014).
Trang 235
SCIENCE & TECHNOLOGY DEVELOPMENT JOURNAL:
NATURAL SCIENCE, VOL 1, ISSUE 6, 2017
[10]. Parks at el. 2007. Climate change impacts
and adaptations for land use planner. Birch
Hill GeoSolutions.
[11]. T.D. Mitchell, P.D. Jones, An improved
method of constructing a database of
monthly climate observations and associated
high-resolution grids, Int. J. Climatol., 25:
693–712 (2005).
[12]. H.Hossain, C.Evans, V.Sposito, Sustainable
land resource assessment in regional and
urban systems’. Applied GIS Volume 2,
Number 3. Monash University Epress, 24.1–
24.21 (2006).
[13]. S.L Cutter, Vulnerability to environmental
hazards, Progress in Human Geography, 20,
529–539 (1996).
[14]. S.L. Cutter, L. Barnes, M. Berry, C. Burton,
E. Avans, E. Tate, J. Webb, A place-based
model for understanding community
resilience to natural disasters, Global
Environmental Change, 18, 4, 598–606
(2008).
[15]. T. Beatley, Planning for Coastal Resilience:
Best Practices for Calamitous Times.
London, Island Press (2009).
Trang 236
[16]. UBND tỉnh Vĩnh Long, Báo cáo hiện trạng
môi trường tỉnh Vĩnh Long giai đoạn 2010–
2015 (2015).
[17]. UBND tỉnh Vĩnh Long, Báo cáo thuyết minh
Quy hoạch sử dụng đất tỉnh Vĩnh Long đến
năm 2020 và kế hoạch sử dụng đất 5 năm kỳ
đầu 2011–2015.
[18]. IPCC, Climate Change 2007: Synthesis
Report (IPCC Forth Assessment Report AR4) (2007).
[19]. Cục Thống kê tỉnh Vĩnh Long, 2016. Niên
giám thống kê tỉnh Vĩnh Long 2015.
[20]. UBND tỉnh Vĩnh Long, 2016. Báo cáo tổng
hợp dự án “Cập nhật kế hoạch hành động ứng
phó BĐKH tỉnh Vĩnh Long”.
[21]. Ban chỉ huy PCTT&TKCN tỉnh Vĩnh Long,
2015. Báo cáo kết quả phòng chống thiên tai
và tìm kiếm cứu nạn tỉnh Vĩnh Long 2015.
[22]. Bộ Kế hoạch và Đầu tư, 2015. Ngân sách cho
ứng phó Biến đổi khí hậu tại Việt Nam: Đầu
tư thông minh vì tương lai bền vững.
[23]. Bộ Tài nguyên và Môi trường, 2014. Chương
trình hỗ trợ ứng phó với BĐKH (SP-RCC) ở
Việt Nam.