The role of active silica and alumina in geopolymerization
Bạn đang xem bản rút gọn của tài liệu. Xem và tải ngay bản đầy đủ của tài liệu tại đây (1.41 MB, 8 trang )
Physical Sciences | Engineering
The role of active silica and alumina
in geopolymerization
Van Quang Le1*, Quang Minh Do2, Minh Duc Hoang3, Hoc Thang Nguyen4
1
Vietnam Institute for Building Materials
Ho Chi Minh city University of Technology
3
Vietnam Institute for Building Science and Technology
4
Ho Chi Minh city University of Food Industry
2
Received 23 January 2018; accepted 18 April 2018
Abstract:
Introduction
In this study, the alkaline solutions (NaOH) with
concentrations from 1M to 18M, red mud (RM) and
silica fume (SF) were used as reactors in geopolymer
reactions. RM contains 7.40% SiO2 and 13.65% Al2O3
and SF has 94.50% SiO2, but only the active oxides
can participate in the geopolymer reactions. The
activity of the oxides was investigated by determining
the compressive strength of the samples under
different curing conditions. The characteristics of
the geopolymer samples were determined by using
X-ray diffraction (XRD), Fourier transform infrared
spectroscopy (FTIR), thermo-gravimetric analysis
(TGA)/differential thermal analysis (DTA) and nuclear
magnetic resonance analysis (NMR). The experimental
results indicate that active silica mainly exists in SF.
In the structure of geopolymers, the silicon can bond
directly with each other (Si-Si) or be linked through
‘bridging’ oxygen (Si-O-Si) to form independent
polymer chains, while aluminium atoms can only
replace the silicon atoms in Si-O-Si polymer chains to
form Si-O-Al instead.
Geopolymer is an inorganic polymer with structural units
of [SiO4]4- and [AlO4]5- tetrahedrons [1]. The principle of
the process is the formation of a polymer from the reaction
of an alkaline solution (NaOH, KOH, Na2SiO3 and K2SiO3
solutions) with alumino-silicate resources [2, 3]. The
structure of the geopolymer is a bonding of amorphous or
semi-crystalline metal oxides with an alkaline element [4].
Therefore, raw materials for synthesising the geopolymer
must contain major components of silicon dioxide,
aluminium oxide and other oxides in amorphous and
semi-crystalline forms. Crystal phases are inert, unreacted
and not participated in geopolymer fabrication [5, 6]. The
structures of the geopolymer are chains of -Si-O-Al-O- [7].
The mechanical properties of the geopolymer are influenced
by the microstructure of the geopolymer.
Keywords: active silica, alumina, geopolymer, red mud,
silica fume.
Classification number: 2.3
The microstructure of the geopolymer is amorphous or
semi-crystalline with three-dimensional structures based
on tetrahedrons sharing oxygen atoms of the [SiO4]4- and
[AlO4]5- molecular, which may exist in the poly-sialate form
(Si:Al=2), the poly sialate disiloxo (-Si-O-Al-O) Al-O-SiO-Si-O) (Si:Al=3) and other ratio sialate linkages (Si:Al>3).
The sialate is an abbreviation for silicon-oxo-alumina [4].
The process of geopolymerization has 2 stages. The
first stage is the synthesis of the geopolymer and the
second stage is the polymeration of original materials with
different alkaline activators. The alkali activation process of
aluminosilicate is a complex process and has not been clearly
explained yet [8, 9]. The major step of the geopolymer
synthesis can be explained in the following stages [10, 11]:
- Extraction of active SiO2 and Al2O3 in aluminosilicates
by using the alkali hydroxide.
- Formation of tetrahedrons monomers.
- Formation of inorganic geopolymer structures by
*Corresponding author: Email:
16
Vietnam Journal of Science,
Technology and Engineering
JUne 2018 • Vol.60 Number 2
Physical sciences | Engineering
monomers condensation reaction.
Geopolymerization will begin with the breakdown of
the bonding Si-O-Si and then, Al atom will replace silicon
atom in Si-O-Si bonding to form aluminosilicate gel with
extremely large molecules [12]. This geopolymer process
occurs in alkali solution. The inorganic polymer network
consists of 3-dimensional aluminosilicate. In particular, the
negative charge of Al in tetrahedron monomerons [AlO4]5will bond with the positive alkali ions such as Na+ and K+.
Geopolymers comprise the following molecular units (or
chemical groups) that are presently studied and implemented
in several industrial developments [13].
- Si-O-Si- siloxo, poly(siloxo).
- Si-O-Al-O- sialate, poly (sialate).
- Si-O-Al-O-Si-O- sialate siloxo, poly (sialate siloxo).
- Si-O-Al-O-Si-O-Si-O- sialate disiloxo, poly (sialate
disiloxo).
- (R)-Si-O-Si-O-(R) organo siloxo, poly silicone.
- Al-O-P-O- alumino phospho, poly (alumino phospho).
In this study, the geopolymer samples from RM were
prepared by mixing the NaOH solution of 1M to 18M
with RM in the NaOH/RM ratio of 0.4/1 (by weight). The
samples were maintained at 60, 90, 120, 150, 180 and 210oC
for 10 hours. Geopolymers’ samples from SF were prepared
by mixing the NaOH solution of 1M to 18M with SF in
the NaOH/SF ratio of 0.2/1. The samples were pressed and
maintained at room temperature.
The results of the microstructural analysis indicate that
Si-Si and Si-O-Si bonds were formed to form independent
polymer chains in the geopolymer samples. In the
polymerization process, the Al atom can replace the Si atom
in the polymer chain Si-O-Si to form Si-O-Al. For sufficient
mechanical strength, active SiO2 should be added to the
geopolymer samples from RM; the samples from SF don’t
need added active oxides.
Experimental process
Materials
- RM from Tan Rai’s Alumina Plant, Lam Dong Alumina
Company in Vietnam.
- Fe-O-Si-O-Al-O-Si-O- ferro sialate, poly (ferro
sialate).
- Silica fume (SF): Use 940U silica by Elkem Silicon
Materials.
Hence, any material containing amorphous oxides of
silicon and aluminum such as red mud, fly ash, slag, silica
fume can be used as a geopolymer material source [14].
- Anhydrous NaOH: Bien Hoa Chemical Plant, Dong
Nai Province in Vietnam.
RM is the solid waste in the manufacturing process of
aluminum oxide by Bayer’s technology. It contains excess
sodium hydroxide (NaOH) and heavy metals that may cause
many negative influences on human health and environment
pollution. Thus, RM must be treated and disposed of
in accordance with the regulations for hazardous waste
management. The main components of RM are Fe2O3,
SiO2, Al2O3 and excess NaOH, which can be used as the
material for the geopolymerization process. Furthermore,
SF is also a solid waste in the metallurgical process. Silica
fume has extremely fine particle size ranging from 0.1 μm
to a few μm with a mean diameter of 1.5 μm. Fumed silica
is mainly amorphous and hence, it is an auspicious material
for geopolymerization. However, the geopolymer reactivity,
physical and mechanical properties of the geopolymer
products are influenced by the content of active SiO2 and
Al2O3 in RM and SF. The content of active SiO2 and Al2O3
in RM and SF were evaluated by the amount of oxides
dissolving in NaOH solutions of 1M to 15M at 80oC for 24
hours. The results showed that RM contains 4.76% active
Al2O3 but does not contain active SiO2 and SF contains
90.32% active SiO2.
Experimental process
Determination of active SiO2 and Al2O3:
RM and SF were dried at 105 to 110oC to constant mass.
About 2.5 g of the test sample (RM or SF) was put into
a stainless-steel flask and then 25 ml of NaOH in varying
concentrations (1 to 15M) were added. This was gently
shaken several times, then cover with a lid and put in the
oven at 80±2oC. After 24 hours, the kettle was stabilised
at room temperature and the solution was filtered. The
contents of silica and alumina dissolved in the solution were
determined.
Experiment:
RM and SF were dried at 105 to 110oC to constant mass
and sieved through a sieve of 0.08 mm.
The samples from RM were prepared by mixing RM
with NaOH solution of 1M to 18M in the NaOH/RM ratio of
0.40/1 (by weight). The samples were formed in a stainless
steel mold, pressed at 72 KN (10 N/mm2) and had sizes
of 90x80x40 mm. Then, the samples were removed from
the mold immediately. The size of the samples conforms
to TCVN 6477:2016. The samples were heated at 60oC
JUne 2018 • Vol.60 Number 2
Vietnam Journal of Science,
Technology and Engineering
17
Physical Sciences | Engineering
to 210oC for 2h, 4h, 6h, 8h and 10h. They were cured at
room temperature for 28 days and then, were subjected to
compressive strength testing.
Table 2. Composition of the materials.
The samples from SF were prepared by mixing SF with
NaOH solution of 1M to 10M in the NaOH/SF ratio of 0.20
(by weight) (Table 1). Samples were prepared by semidry pressing at 72 KN (10 N/mm2) in a mold with sizes of
90x80x40 mm. Then, they were removed from the mold
immediately. The size of the samples conforms to TCVN
6477:2016. The samples were cured at room temperature for
28 days and then, were subjected to compressive strength
and softening-coefficient. Some samples were selected to
analyse the microstructure by using the methods of XRD,
DTA-TG and NMR.
Name
SiO2
Al2O3
Fe2O3
Na2O
L.O.I
RM (%)
7.40
13.65
56.05
3.63
12.50
SF (%)
94.5
0
0
0
2.74
Table 1. Mixture proportion of geopolymer synthesis from
SF and NaOH solution.
Sample
Ratio NaOH/SF
NaOH (M)
SF-Na1M
0.2
1
SF-Na2M
0.2
2
SF-Na3M
0.2
3
SF-Na4M
0.2
4
SF-Na5M
0.2
5
SF-Na6M
0.2
6
SF-Na7M
0.2
7
SF-Na8M
0.2
8
SF-Na9M
0.2
9
SF-Na10M
0.2
10
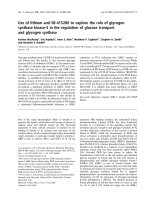
Fig.1.1.XRD
XRDspectrum
spectrum of
of the
the material.
material.
Fig.
Mineral Mineral
compositions
of RM areofGoethite
Hematite (Fe2O3)
compositions
RM are(FeOOH)
Goethite21%,
(FeOOH)
14% and Gibbsite (Al(OH)3) 5%. The amorphous phase is 60%. The amorphous
Hematite
(Feabout
O ) 14% and Gibbsite (Al(OH)3) 5%.
2 3 99% SiO2. The main crystal phase
phase of SF21%,
is extremely
high,
is cristobalite
amorphous
phase low.
is 60%. The amorphous phase of SF
(SiO2), and The
its content
is extremely
The results
of DTAhigh,
of RM
and99%
SF are
in Fig.crystal
2 and phase
Fig. 3. That was
is extremely
about
SiOshown
. The main
2
o
performed from
room
temperature
up
to
1,000°C
(heating
rate
5
C/min)
is cristobalite (SiO ), and its content is extremely low. (Fig. 3).
2
The results of DTA of RM and SF are shown in Fig. 2
and Fig. 3. That was performed from room temperature up
to 1,000°C (heating rate 5oC/min) (Fig. 3).
Results and discussion
Characteristics of the raw materials
The chemical compositions of RM and SF were
determined by the XRF method, and the results are shown
in Table 2. We can see that the silica content of SF is high,
about 94.50% SiO2. Additionally, the results in Table 2
shows that RM has a high L.O.I (loss on ignition) of about
12.50%, while SF has 2.74%.
The mineral composition of RM and SF were determined
by using XRD and XRD patterns, which are shown in Fig.
1. The average particle size of RM was 9.5 μm by using the
laser diffraction method.
18
Vietnam Journal of Science,
Technology and Engineering
6
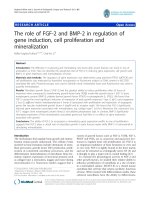
Fig. 2. The DTA curve of RM.
JUne 2018 • Vol.60 Number 2
Fig. 2. The DTA curve of RM.
Physical sciences | Engineering
Fig. 2. The DTA curve of RM.
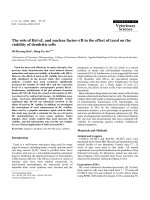
3. Thermal
analysis
fumedsilica.
silica.
Fig.Fig.
3. Thermal
analysis
of of
fumed
On the
DTA curve of RM, there is an endothermic peak at 284oC,
On the DTA curve of RM, there is an endothermic peak
corresponding too the decomposition of Al(OH)3 to Al2O3 and FeOOH to Fe2O3 [15].
C, corresponding
to after
the decomposition
and it 3continuously
The loss atof 284
ignition
of RM is 10.06%
heating up to 380ofoC,Al(OH)
o
o
O
and
FeOOH
to
Fe
O
[15].
The
loss
of
ignition
of heat effect
C
to
1,000
C.
There
is
no
significant
decreasedtotoAl3.14%
from
heating
380
2 3
2 3
on the DTA
of SF; after
the loss
on ignition
SFoC,is and
onlyit3.26%
during the heating.
RMcurve
is 10.06%
heating
up to of
380
continuously
decreased to 3.14% from heating 380oC to 1,000oC. There is
Fig. 4. NMR spectrum of 29Si of SF.
The symbols Qn(mAl) are used to describe the structural
The results in Table 3 indicate that RM did not contain
active SiO2. The highest content of active alumina extracted
from RM is 4.76% at the sodium hydroxide solution
concentration of 5M, and the highest active silica content
extracted from silica fume is 90.32% at the solution
concentrations of at least 5М.
The NMR spectrum of 29Si of SF is shown in Fig. 4. The symbols Qn(mAl) are
no significant
heat effect
on theinDTA
curve of SF;
the loss
used to describe
the structural
monomers
aluminosilicates,
where
n representsThe
the ratio of active SiO and Al O in the material
2
2 3
valence ofonthe
central of
silicon
m is3.26%
the Alduring
numberthe
around
the SiO4 monomer.
ignition
SF isand
only
heating.
29
The content of active SiO2 and Al2O3 in the raw materials
The MNR spectrum Si of SF exhibits a narrow peak of 50.3% at 108.707
29
The
NMR
spectrum
of
Si
of
SF
is
shown
in
Fig.
4.
are
indicated in Table 3.
ppm. This peak is related to the number of wavelengths that may be present. The bond
monomers in aluminosilicates, where n represents the
7 m is the Al number around
valence of the central silicon and
the SiO4 monomer.
The MNR spectrum 29Si of SF exhibits a narrow peak of
50.3% at 108.77 ppm. This peak is related to the number of
wavelengths that may be present. The bond Q4(0Al) has a
Effects of active SiO2 and Al2O3 on properties of the
geopolymer
large component in the material, which is characterised by
The samples from RM had not hardened. That is
silica-rich SF.
Table 3. The rates of active SiO2 and Al2O3 in the raw material.
NaOH concentration (M)
Samples
RM
SF
1
3
5
7
9
11
13
15
SiO2 (%)
0
0
0
0
0
0
0
0
Al2O3 (%)
4.13
4.74
4.76
4.76
4.76
4.76
4.76
4.76
SiO2 (%)
90.06
90.07
90.32
90.32
90.32
90.32
90.32
90.32
JUne 2018 • Vol.60 Number 2
Vietnam Journal of Science,
Technology and Engineering
19
water, many unreacted raw materials will be easily degraded to wash off, reducing the
compressive strength of the sample. When the concentration of NaOH solution
was
increased above 5M, the geopolymer reaction increased
, which led to the increase of
Physical Sciences | Engineering
softening-coefficient. However, when using the alkaline solution witha concentration
higher than 8M, the geopolymer samples were swollen,which leads to crack and
explained by the absence of active SiO2 in deformation.
RM. AlthoughThese
wassamples
rapidly did
increased
from
75÷80% (of
the .samples SFnot have
compressive
strength
Na1M to SF-Na3M) to 99.19÷99.87% (of the samples SFNa5M and SF-Na8M) (Fig. 6).
Softening-coefficient (%)
the content of SiO2 in RM is 7.4% (Table 2), but they are
not active SiO2 and hence, they cannot participate in the
geopolymer reaction. The content of active Al2O3 in the RM
is 4.76% (Table 3) but they cannot polymerize because Al3+
is a modifier ion, and thus, they cannot form independent
polymer chains.
he samples from RM had not hardened
. That is explained by the absence of
In the presence of active SiO2, a part of Al3+ having
2), but they
O 2 in RM. Although the content of SiO2 in RM4+ is 7.4% ( T able
4 oxygen coordination can replace Si in the [SiO4]4reaction. The
active SiO2 and hence, theycannot participate inthe geopolymer
create a geopolymer network.
of active Al 2tetrahedron
O3 in the toRM
is 4.76% ( T able 3) but they cannot polymerize
3+
Al is a modifier
ion, and
thus, they
cannot
independent
polymer
The lowest
compressive
strength
of theform
samples
(SF-
Compressive strength (MPa)
Na1M) is 13.43 MPa. The highest compressive strength of
the presencetheofsamples
active(SF-Na8M)
SiO2, a partis of
Al 3+
having
4 oxygen coordination
can
54.79
MPa.
The concentration
of
NaOH (M)
4]
tetrahedron
to
create
a
geopolymer
network
.
Si4+ in the [SiO
4
NaOH
increased from 1M to 3M to increase the compressive
strength of the samples from 13.43 MPa to 18.50 MPa.
6. Effect
he lowest compressive
strength
of the4M,
samples
(SF -Na1M)strength
is 13.43Fig.
MPa.
The of NaOH concentration on the softening -coefficient.
Notably, when
using NaOH
the compressive
Fig. 6. The
Effect of NaOH concentration on the softeningcompressiveofstrength
of
the
samples
(SF
-Na8M)
is
54.79
MPa.
the samples increased significantly - an increase ofThe
67.5%
samplecoefficient.
SF-Na4M was selected for structural analysis by XRD (Fig. 7),
ration of NaOH
increased from 1M to 3M to increase
thecompressive
compared to NaOH 3M (Fig. 5). This may explain
that
the 8) and NMR (Fig. 9).
DTA
-TG
(Fig.
of the samples from13.43 MPa to 18.50 MPa. Notably, when using NaOH
concentration NaOH from 1M to 3M was insufficient to
compressive strength of the samples increased significantly
- an increase
ofsoftening-coefficient of the samples SF-Na1M
The low
trigger the reaction. The higher the alkaline solution, the
ompared to NaOH 3M (Fig. 5). This may explain that the concentration
to SF-Na4M can be explained by the low amount of alkaline
polymerization reaction.
om 1M to 3Mbetter
wasthe
insufficient
to trigger the reaction.T he higher the
alkaline
solution,
which is not enough to dissolve silicon and
, the better the polymerization reaction.
aluminum for geopolymerization. Thus, when the sample
is saturated by water, many unreacted raw materials will
60
54.79
be easily degraded to wash off, reducing the compressive
46.11
50
strength of the sample. When the concentration of NaOH
36.93
40
33.22
solution was increased above 5M, the geopolymer
30.08
30
reaction increased, which led to the increase of softening18.5
20 13.43 16.53
coefficient. However, when using the alkaline solution with
a concentration higher than 8M, the geopolymer samples
10
(*)
(*)
were swollen, which leads to crack and deformation. These
0
samples did not have compressive strength.
1
2
3
4
5
6
7
8
9
10
NaOH (M)
(*) Sample was swollen
Fig. 5. Effect of NaOH concentration on geopolymer
The sample SF-Na4M was selected for structural
analysis by XRD (Fig. 7), DTA-TG (Fig. 8) and NMR (Fig.
9).
7. XRD spectra of SF and SF -Na4M .
. Effect of NaOH
concentration on geopolymer CompressiveFig.
Strength.
On the XRD spectra of the samples SF and SF-Na4M,
Compressive Strength.
there is no new mineral peak. On the XRD spectrum of
oftening-coefficient
is defined as the
ratio ofasthe
SF, thereofis aonly one peak
Softening-coefficient
is defined
thecompressive
ratio of the strength
10 corresponding to Cristobalite,
lowest
highest
saturated with
water to
that ofinthe
dry state.
Thewith
which
indicates that most of the silica content in SF was
compressive
strength
a material
saturated
waterand
to the
g coefficientthatofinthe
samples
SF
Na1M
and
SF
-Na8M
were
75.28%
and
and they participated in the geopolymer reaction.
the dry state. The lowest and the highest softening activated
respectively.coefficient
The softening-coefficient
was
rapidly
increased
from
75
÷80%
of the samples SF-Na1M and SF-Na8M were Additionally, this proves that the formed phases during
amples SF-Na1M
to
SF
-Na3M)respectively.
to 99.19 ÷99.87%
(of the samplesgeopolymerization
SF-Na5M
were amorphous.
75.28% and 99.87%,
The softening-coefficient
Na8M) (Fig. 6).
he low softening-coefficient of the samples SF-Na1M to SF -Na4M can be
d by the low amount of alkaline solution, which is not enough to dissolve
Vietnam Journal of Science,
2018 the
• Vol.60
Number
2
20 geopolymerization. Thus,
nd aluminum for
when
sample
is saturated
by
Technology and Engineering JUne
Physical sciences | Engineering
Fig. 7. XRD spectra of SF and SF-Na4M.
Fig. 9. NMR spectrum of 29Si of the sample SF-Na4M.
Fig. 8. The DTA curve of SF-Na4M.
Nuclear Magnetic Resonance Analysis (NMR) of 29Si
The DTA-TG curves of the samples SF-Na4M are
shown in Fig. 8.
The NMR spectrum (Fig. 4) clearly shows that the
Beyond only a peak of evaporation at 86oC, there is
no significant heat effect on the DTA curve of the sample
SF-Na4M (Fig. 8). On the TG curve, the loss on ignition is
13.76% (loss of 7.12% from room temperature to 195oC and
6.64% from 195oC to 1,000oC).
3-dimensional structure of SF was changed. The NMR
spectra of SF appeared at a peak of -108.77 ppm such as Q4
(0Al) linkage (Fig. 4). After the polymerization process, two
new vertices were found at -97.324 ppm and -88.486 ppm
corresponding to Q3 (0Al) and Q2 (0Al) (Fig. 9). Alkaline
dissolution starts with the attachment of the base OH- to
JUne 2018 • Vol.60 Number 2
Vietnam Journal of Science,
Technology and Engineering
21
Physical Sciences | Engineering
the silicon atom, which is, thus, able to extend its valence
sphere to the penta-covalent state and the new linkages are
formed. Furthermore, it was found that the geopolymer
reaction of the SF-Na4M sample did not occur completely.
The amorphous content of SiO2 is extremely high. This
explains that the geopolymer samples still exists in Q4(0Al).
SiO2 with structure Q4(0Al) was not completely soluble and
concentration of Q4(0Al) was lower than the original. In
addition, the NMR intensity proportional to the number of
29
Si nuclei should allow the quantification of the phase. The
characteristics of NMR pickups for the geopolymer samples
are shown in Table 4.
GP
GP
ppm
Amount of phase (%)
Q4(0Al)
-108.707
100
Q4(0Al)’
-107.242
50.20
Q3(0Al)
-97.324
37.25
Q2(0Al)
-88.486
12.55
Qn(mAl)
ppm
Width (ppm)
Intensity
(%)
Q4(0Al)
-108.707
23
50.3
Q4(0Al)’
-107.242
17
37.2
Conclusions
Q3(0Al)
-97.324
6
27.6
Q2(0Al)
-88.486
5
9.3
Active silica plays the most important role in the
geopolymerlyzation process because it makes the bonding
and structure of the geopolymer. Silicon has the ability to
bind directly to one another (Si-Si) or cross-link through
silanes (Si-O-Si). When bonded via oxygen, the polymer
chain can be expressed through coordinated multilane
bonds, creating a three-dimensional network. The ions of
the alkali oxides such as Na2O, K2O, CaO, MgO do not
create a chain and are located in the hole coordinates.
From the data in Table 4, we have:
∑ (Q4(0Al) ' + Q3(0Al) + Q2(0Al))
= ∑=
Q4(0Al) 100%
We also have the magnitude of the sum of the components
in the geopolymer sample:
I
SF
Qn(mAl)
The samples from RM were not solidified although
the active Al2O3 content was 4.76% compared to the total
of 13.65%. The geopolymer samples from SF have high
compressive strength, with the highest one being around
54.72 MPa of the sample SF-Na8M. This proves that active
SiO2 is indispensable and plays the most important role in
the geopolymerization process. Al2O3 only plays a role in
modifying the silicon polymer network.
Table 4. Characteristics of the 29Si NMR spectrum of the
SF-Na4M sample.
SF
Table 5. Proportion of Qm(nAl) in the SF-Na4M.
When selecting raw materials for geopolymer materials,
=I
+=II
++ II
I
+ Ibesides requiring materials containing the SiO2 and Al2O3
(Q4(0Al)' + Q3(0Al)
+ Q2(0Al)
(Q4(0Al)'
+ Q3(0Al) +Q4(0Al)'
Q2(0Al) Q3(0Al)
Q4(0Al)' Q2(0Al)
Q3(0Al)
Q2(0Al)
components, the activity of SiO2 must be present. In the
= 37.2 + 27.6= 37.2
+ 9.3+ = 27.6
74.1%
+ 9.3 = 74.1%
The percentage (%) of links in the geopolymer sample is
calculated as follows:
Amount of phase A on phase B
WA I A IoB
=
×
WB I B IoA
where: IoA, IoB are the intensity of standard diffraction beam.
The results of the linked units Qm(nAl) were shown in
Table 5.
22
Vietnam Journal of Science,
Technology and Engineering
geopolymerization process, active silica will form the bonds
of monomer to achieve a geopolymer. Aluminium atom acts
as a modifying ion. Al atom can only replace the Si atom in
the polymer chain Si-O-Si.
It is necessary to add active SiO2 when using RM of
Tan Rai, Lam Dong to synthesize geopolymer. The active
SiO2 can be obtained from industrial waste such as fly ash,
SF or glass water solution. The bonding and structure of
geopolymer materials will be determined by the ratio of
NaOH solution/SF and active silica. Silicon has the ability
to bind directly to one another (Si-Si) or cross-link through
JUne 2018 • Vol.60 Number 2
Physical sciences | Engineering
silanes (Si-O-Si). When bonded via oxygen, the polymer
chain can be expressed through coordinated multilane bonds,
creating a three-dimensional network. The ions of the alkali
oxides such as Na2O, K2O, CaO, MgO do not create a chain
and are located in the hole of structure network.
REFERENCES
[7] J. Davidovits (2011), Geopolymer chemistry and applications 3rd
edition, Institute Geopolymer - France.
[8] František škvára (2007), “Alkali activated materials or
geopolymers?”, Ceramics - Silikáty, 51, pp.173-177.
[9] Joseph Davidovits (1999), “Chemistry of geopolymeric system
terminology”, Géopolymère ‘99: Second International Conference, pp.939.
[1] J. Davidovits (1989), “Geopolymers and geopolymeric materials”,
Journal of Thermal Analysis and Calorimetry, 35(2), pp.429-441.
[10] Van Chanh Nguyen, Dang Trung Bui, Van Tuan Dang (2008),
“Recent research geopolymer concrete”, The 3rd ACF International
Conference, pp.235-241.
[2] J. Giancaspro, P.N. Balaguru, and R.E. Lyon (2006), “Use
of inorganic polymer to improve the fire response of balsa sandwich
structures”, Journal of Materials in Civil Engineering, 18, pp.390-397.
[11] Muhd Fadhil Nuruddi (2010), “Construction of infrastructures
for sustainable futures”, Seminar Nasional Aplikasi Teknologi Prasarana
Wilayah.
[3] K. Goretta, J. Fuller, and E. Crawley (2006), “Geopolymers”, Air
Force Office of Scientific Research Report, Document # OSR-H-05-05.
[12] R.E. Lyon, P.N. Balaguru, A. Foden, U. Sorathia, J. Davidovits,
and M. Davidovics (1997), “Fire resistant aluminosilicate composites”,
Fire and Materials, 21, pp.67-73.
[4] J. Davidovits (1994), “Geopolymers: man-made rocks
geosynthesis and the resulting development of very early high strength
cement”, Journal of Material Education, 16, pp.911-939.
[13] J. Davidovits (2015), Geopolymer Chemistry and Applications
4th Edition, Geopolymer Institute.
[5] J. Davidovits (2002), “30 years of successes and failures in
geopolymer applications, market trends and potential breakthroughs”,
Geopolymer Conference, Melbourne, Australia.
[14] H. Xu and J.S.J. Van Deventer (2000), “The geopolymerisation of
alumino-silicate minerals”, International Journal of Mineral Processing,
59, pp.247-266.
[6] J. Davidovits (1994), "Properties of geopolymer cements",
Proceedings 1st International Conference on Alkaline Cements and
Concretes, Scientific Research Institute on Binders and Materials (Kiev
State Technical University, Ukraine), 199, pp.131-149.
[15] V.M. Sglavo, S. Maurina, A. Conci, A. Salviati, G. Carturan,
G. Cocco (2000), “Bauxite “red mud” in the caramic industry. Part 2:
Production of clay - based ceramic”, Journal of the European Society, 20,
pp.245-252.
JUne 2018 • Vol.60 Number 2
Vietnam Journal of Science,
Technology and Engineering
23