Studies on process development and quality evaluation of sour dough bread
Bạn đang xem bản rút gọn của tài liệu. Xem và tải ngay bản đầy đủ của tài liệu tại đây (667.86 KB, 16 trang )
Int.J.Curr.Microbiol.App.Sci (2019) 8(2): 2224-2239
International Journal of Current Microbiology and Applied Sciences
ISSN: 2319-7706 Volume 8 Number 02 (2019)
Journal homepage:
Original Research Article
/>
Studies on Process Development and Quality Evaluation
of Sour Dough Bread
H.W. Deshpande, S.D. Katke* and Pathan M. Aziz Khan
Department of Food Microbiology and Safety, College of Food Technology,
VNMKV, Parbhani, India
*Corresponding author
ABSTRACT
Keywords
Sour dough,
Lactobacillus
plantarum,
Lactobacillus
brevis, Composite
flour, Sour Dough
bread
Article Info
Accepted:
18 January 2019
Available Online:
10 February 2019
The present investigation focuses on standardization the process for sour
dough bread and its quality evaluation. Dough was fortified with LAB
culture (Lactobacillus plantarum and Lactobacillus brevis) at 0.1% (T1),
0.15% (T2) and 0.2% (T3) level of incorporation. The product prepared was
evaluated for color, flavour, taste, texture, appearance and overall
acceptability using semi-trained panel members on 9 point hedonic rating.
It can be concluded that the LAB culture can be used successfully in
preparation of sour dough bread at the level of 0.15% without any
undesirable changes in physical, chemical and organoleptic attributes of
bread.
Introduction
Bread products and their production
techniques differ widely around the world.
The foremost quality characteristics of
leavened wheat breads are high volume, soft
and elastic crumb structure, good shelf life,
and microbiological safety (Cauvain, 2003;
Chavan and Jana, 2008). Sourdough has a
natural, additive-free image and lactic acid
bacteria have been used in food for thousands
of years and are "generally regarded as safe"
(Magnusson et al., 2003). Sourdough is
ancient way to improve flavor, texture and
microbiological shelf life of bread, and is
widely utilized in whole grain rye baking
(Lorenz and Brummer, 2003). Sourdoughs are
very complex biological ecosystems because
of the microbial composition and all
interactive effects among the bread-making
processes and ingredients (Gobbetti et al.,
1999). The majority of species regularly
isolated from sourdough or used as sourdough
starter belong, with only few exceptions, to 1
2224
Int.J.Curr.Microbiol.App.Sci (2019) 8(2): 2224-2239
of the 4 genera Lactobacillus, Pediococcus,
Leuconostoc and Weissella. The highest
number of different species (>23 species) is
found in the genus Lactobacillus. Most of the
yeast preparations for sourdoughs often
contain LAB, especially Lactobacilli rather
than Pediococcus, Lactococcus
and
Leuconostoc spp. (Jenson, 1998), which
contributes a little to the aroma development
through acidification of the dough during
limited processing period (Rothe and Ruttloff,
1983). Yeasts are often associated with LAB
in sourdough and the yeasts/LAB ratio is
generally 1:100 (Gobbetti et al., 1994;
Ottogalli et al., 1996). The utilization of
sourdough has fundamental effects on dough
rheology. Sourdough fermentation causes
decreased elasticity and viscosity, less elastic
and softer doughs, effects being more
pronounced with longer fermentation times
(Clarke et al., 2004). In comparison to bread
prepared with baker's yeast, the sourdough
breads are characterized by moist, dense
grains, and a rather chewy texture (Qarooni
1996). The application of sourdough to wheat
breads has a positive impact on bread volume,
which is a primary quality characteristic of
bread (Collar et al., 1994; Clarke et al., 2004).
The optimal use of sourdough can improve
the taste and flavor of the bread (Rehman et
al., 2006). The flavor of sourdough wheat
bread is richer and more aromatic than wheat
bread, a factor that can be attributed to the
long fermentation time of sourdough
(Brummer and Lorenz, 1991). The flavoring
compound diacetylget produced in significant
amounts by Lactobacillus plantarum and
Pediococcus pentosaceus. The application of
LAB in the form of sourdough has a positive
effect on bread staling. One such effect is an
improvement in loaf-specific volume, which
is associated with the reduction in the rate of
staling (Corsetti et al., 2001). Sourdoughassociated LAB produce many antimicrobial
substances, such as organic acids, CO2,
ethanol, hydrogen peroxide, diacetyl, fatty
acids, phenyllactic acid, reuterin, and
fungicins (Messens and De Vuyst, 2002).
Also, Lactobacillus plantarum shows very
broad antimicrobial activity, and the
antifungal compounds 4-hydroxyphenlyllactic
and especially phenyl lactic acids have been
identified as responsible for fungal inhibition
(Ryan et al.,2009). Sourdough-associated
LAB are also effective against rope spoilage
of bread induced by Bacillus spp., probably
due to production of organic acids and other
still unknown antibacterial substances
(Valerio et al., 2008). At present, the
sourdough is employed in the manufacture of
breads, cakes, and crackers (Chavan and
Chavan, 2011). The use of sourdough is
useful for making bread products with an
increased level of flavor compounds,
ultimately increasing the evenness in the
batches and customer satisfaction. Sourdough
technology can also be useful to reduce or
eliminate the level of preservatives often used
in baked products, as sourdough has shown
antibacterial and antimold activity. Thus,
sourdough could be useful in serving mankind
with wholesome, tasty, and convenient foods.
Materials and Methods
Composite flour (70% of whole wheat flour
and 30% refined wheat flour), Granulated
cane sugar, Iodized salt, baker's compressed
yeast, Shortenings were purchased from local
market.
Starter cultures
Pure cultures of Lactobacillus plantarum and
Lactobacillus brevis were purchased from
National Chemical Laboratory, (NCL) Pune.
Purity of the cultures
The staining of the obtained pure cultures of
Lactobacillus plantarum and Lactobacillus
brevis was carried out by using Gram positive
2225
Int.J.Curr.Microbiol.App.Sci (2019) 8(2): 2224-2239
staining technique for their identification
(Harley and Prescott, 2002).
Preparation of starter culture
The starter culture was prepared with the help
of the method described by Ghadge et al.,
(2008) with suitable modifications.
modifications in the method described in
A.A.C.C. (2000). The recipe used for
preparation of bread mentioned below in
Table 1 and pure LAB cultures used in recipe
in different concentration is mentioned in
Table 2.
Results and Discussion
Preparation of MRS Medium
Proximate analysis of flour
All the ingredients were suspended in distilled
water and heated to dissolve the medium
completely. The medium was sterilized in
autoclave at 15 lbs pressure for 15 minutes
(De Mann et al., 1960).
It is observed from the Table 3 that obtained
flour found to contain 12.50 per cent of
moisture. The lower moisture content of
composite flour justifies the suitability for
long term storage without deterioration (Peter
and James, 2000). The protein content was
recorded to be 11.85 per cent. The higher
protein content is important for strong elastic
dough which having high water absorptive
capacity, excellent gas holding properties and
will yield bread with good volume, grain and
texture (Kent and Evers, 1997). The observed
values for crude fat and ash content were 1.80
and 1.53 per cent respectively. The results
obtained in the present study for the analysis
of composite flour are also in close agreement
with Yun et al., (1996)
Ingredients
Proteose peptone
Yeast extract
Beef extract
Dextrose
Tween -80
Ammonium citrate
Sodium acetate
Magnesium sulphate
Manganese sulphate
Di-potassium
phosphate
g/ lit
10.0
5.0
10.0
20.0
1.0
2.0
5.0
0.1
0.05
2.0
Bread making quality parameters of flour
Sub-culturing of pure culture
The pure cultures i.e. Lactobacillus plantarum
and Lactobacillus brevis were sub-cultured on
slants prepared from MRS media in laminar
flow. This was incubated at 370C for 24 hours
in incubator. After 24 hours there was growth
on slant of cultures.
Preparation of sourdough bread
The production of sourdough bread was
carried out in the Pilot Bakery Plant by using
Lactobacillus brevis, Lactobacillus plantarum
and Saccharomyces cerevisiae with some
It is evident from the above Table 4 that
gluten content of flour was 11.14 per cent (On
dry weight basis) and 31.54 per cent (On wet
weight basis). The values clearly indicated
that flour used was strong in nature. The
alcoholic acidity of flour was 0.09% and the
obtained results for sedimentation value of
composite flour were 21.67 ml which
represent good quality of flour. The Falling
number of flour represents the viscous
behavior of flour due to present of α-amylase.
The obtained values of 278 sec for falling
number represent the freshness of flour. The
results are in comparable with William et al.,
(1988).
2226
Int.J.Curr.Microbiol.App.Sci (2019) 8(2): 2224-2239
Rheological characteristics of sourdough
It is observed from present investigation that
the water absorption of sample T1 containing
0.1 per cent of LAB starter culture was 61.21
per cent which increased with increased level
of starter culture and reached up to 62.03 per
cent in sample T3 having 0.2 per cent of LAB
starter culture. The water absorption of flour
is an important factor influencing the
handling properties and machinability of
dough and is related to the quality of the
finished baked product (Catterall, 1998). The
arrival time is point where the top of curve
reaches 500BU points and indicates the rate
of absorption (min/BU). Arrival time for flour
was recorded to vary in the range 1.94
(sample T1) to 1.91(sample T2) which were
lower than control (2.0 min) (Table 5). The
departure time is the point at which the top of
the curve goes below 500BU line, which
indicates the point at which the gluten is
breaking down and dough has become overmixed (Pomeranz, 1988). Sample C showed
maximum time to break down (9.11) which
decreased gradually with increasing level of
LAB starter culture addition and the lowest
departure time (8.49 min). The stability is
time between arrival time and departure time
and generally indicates the strength of flour
which is function of gluten development
(Collar et al., 1994). The results revealed that
stability of sourdough decreased with the
increase in the level of LAB starter. Highest
dough stability was recorded for the control
(5.01 min), which gradually decrease from T1
(4.58 min), T2 (4.12 min) and T3 (3.60 min).
The findings of present investigation are
similar with Hoseney (1994). Peak time reads
the highest point on the curve and indicates
the point they reached its maximum viscosity
before gluten strands begin to breakdown
(Pomeranz, 1988). Peak time values
decreased with increase the level of LAB
starter addition viz. 3.20, 3.17, 3.09 and 2.80
min for control, T1, T2 and T3 respectively.
These findings are in good conformity with
the results of (Wehrle et al., 1997). Softening
of dough (SD) varied from 70.39, 90.01, and
120.33 BU for the samples T1, T2 and
T3respectively. These findings revealed that
dough became softer with the increase in the
level of LAB starter. These values are in close
agreement with the findings of Schober et al.,
(2003).
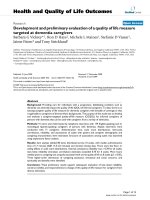
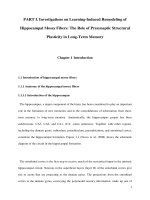
It is evident from the Table 6 that highest
value for mean distance at maximum force
extensibility was noted for sample T2 (i.e.
42.7mm) followed by T1 and control (i.e. 38.1
and 37.2mm respectively) whereas lowest
value was noted for sample T3 viz. 34.4mm.
Sample T2 is best in extensibility over all
other samples. The declined extensibility in
sample T3 can be attributed to presence of
high concentration of organic acids that
substantially decrease mixing time and
weaken the dough (Wehrle et al., 1997). The
extensibility graph showing the effect of
addition level of LAB starter culture is
illustrated in Figure 1.
Physical properties of Sour Dough Bread
with different levels LAB starter culture
It is evident from the Table 7 that loaf volume
showed significant variation as a result of
treatments. Loaf volume of control sample
was recorded to be 586ml. samples T1 and T2
showed maximum volume viz. 587 and 590
ml respectively, followed by T3 which
produced minimum volume i.e. 583 ml. Thus
it may be concluded that sample T2 (0.15 per
cent LAB starter) was able to produce
superior loaf volume. These results in the
present study are in line with the findings of
Corsetti et al., (2000). Similarly, the specific
volume of the bread samples was calculated
and the best treatment in this regard was
found to be in sample T2 (3.88cm3/g) whereas,
T3 sample was having the lowest specific
volume viz., 3.80 cm3/g. The results
2227
Int.J.Curr.Microbiol.App.Sci (2019) 8(2): 2224-2239
pertaining to the specific volume of bread
indicated that treatment resulted in breads
with less density and high volume and hence,
preferred by the consumers. The results
obtained in present investigation are in close
agreement with the findings of Salim-urRahman et al., (2007). Crust to crumb ratio
was found to be in the range of 0.255 to 0.263
with control sample having o.255 value for
crust to crumb ratio, the highest value was
obtained by sample T3 while sample T1
showed lowest value. The values obtained for
crust to crumb ratio indicated that there was
no much difference found in these values as
no effect of different incorporation level of
LAB starter culture on the crust to crumb
ratio. These findings are comparable with
those of Taranto (1983).
Effect of different incorporation level of
LAB starter culture on external sensorial
characteristics of sour dough bread
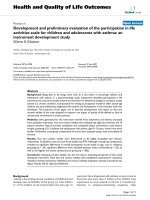
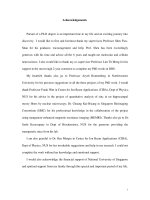
It is evident from the Table 8 that amongst
various external characteristics, volume of
bread, crust color, symmetry of form,
character of crust, crumb color and aroma
were significantly affected by the different
levels of LAB culture (Fig. 2). The volume of
bread was found to increase with increase in
concentration of LAB starter culture (from
control to T3) and maximum volume was
observed in sample T2 containing 0.15 per
cent of LAB starter culture. The volume then
decreased with further addition of starter
culture as seen in sample T3. Crust color is an
important sensory parameter concerning the
consumer’s acceptability of bread. Maximum
score for the colour of crust in treated sample
was obtained by sample T2 (i.e. 8.07). This
might be due to the production of lactic acid
which improved bread color (Tarar, 1999).
The ‘Symmetry of form’ is an important
bread
parameter
in
deciding
the
characteristics like uneven top, low ends and
shrunken sides of the bread. It is observed
form Table 8, symmetry of breads prepared
from different starter cultures increased non
significantly with the increase in addition of
LAB starter culture. The ‘evenness’ of bake
reflects that all sides including top and the
bottom are uniformly baked and it also
reflects the intensity of baking whether the
sides having lighter or darker shade. The
mean values for the evenness of bake of
breads given in Table 8 indicated that
evenness of bake among breads varied from
7.34 to 7.38 prepared from different level of
LAB starter cultures. The ‘character of crust’
represents the hardness of bread crust. Higher
curst hardness represents superior quality as it
can sustain minor impact or attrition during
transportation and handling. Addition of LAB
starter culture does not have significant
impact on the character crust of bread. The
results in the Table 8 indicate that the scores
assigned to aroma of breads ranged from 7.12
to 7.89 among the breads prepared from
different level of starter cultures. The breads
prepared from T3 got significantly higher
score (i.e. 7.89). However, the lowest scores
for the aroma were given to breads produced
from T1 and T2followed by control. The
results of present study are in conformity with
the findings of Martinez (1996). It is observed
that the ‘overall acceptability’ in terms of
external characteristics of bread improved
linearly with increase in concentration of
LAB starter culture and maximum score was
secured for sample T2 containing 0.15 per
cent of LAB starter. The Sour Dough
provides aromatic and pleasing flavor, and
improves overall acceptability and shelf life
of whole grain breads (Katina et al., 2005).
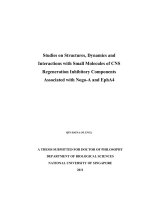
Effect of different levels of LAB starter
culture on internal characteristics of sour
dough bread
It was found that LAB starter culture results
in enhancement of grain formation. Maximum
grain score was obtained by the sample T2
2228
Int.J.Curr.Microbiol.App.Sci (2019) 8(2): 2224-2239
while control sample got the minimum score.
These findings are similar with those obtained
by Katina et al, (2006). LAB starter culture
addition found to improve the color of crumb
with sample T2 obtaining the highest score.
Maximum score for ‘taste’ was noted in the
sample T2 followed by T3 and T1 while the
control sample scored the lowest value. The
results for taste scores of Sour Dough bread
were much higher than that of control breads,
which suggested that the addition of Sour
Dough improved the bread’s taste. The scores
for taste in the present study are in agreement
with the findings of Siddique (1989). Textural
properties of all the samples were found to
increase with increase in concentration of
LAB starter culture. The Sour Dough addition
resulted in softer breads than control.
Maximum textural scores were secured by
sample T2 while the minimum values were
observed in control sample C. The desirable
texture obtained by sample T2 was soft and
pliable. The results of the present study are in
concordance with the findings of Crowley et
al., (2002) who found that the breads
containing Sour Dough starter culture
maintained superior textural properties. The
‘overall
acceptability’
for
internal
characteristics of bread found to increase with
increase in LAB starter culture concentration,
however maximum score for overall
acceptability was also observed in sample T2
having 0.51 per cent of LAB starter culture.
The results obtained in the present study are
in agreement with the findings of Shah et al.,
(1999) (Fig. 3 and Table 9).
Effect of different level of addition of LAB
starter culture on pH and titrable acidity of
sour dough bread
The mean values for the pH and titrable
acidity of Sour Dough breads are given in
Table 10, showing that yeast leavened control
bread showed the highest pH (5.4) and the
lowest acidity (2.75) values. The pH of Sour
Dough bread decreased with an increase in
level of LAB starter culture with T1,T2 and T3
pH value to be 4.5, 4.1 and 3.9 respectively. It
may be due to the acidification of dough by
LAB starter culture. The results for pH and
acidity are in accordance with findings of
Park et al., (2006).
Chemical composition of bread prepared
with different addition level of LAB starter
culture
The results for moisture content of breads
prepared from different level of LAB starter
cultures as given in Table 11 indicated that
moisture content increased significantly with
the increase in addition of LAB starter
culture. The results indicated that breads
prepared from control sample showed the
lowest moisture content (31.02 per cent).
Sample T3 possessed the highest moisture
content (36.53per cent) followed by T2
(35.80per cent) and T1 (35.13 per cent). The
results of the present study are also in
conformity with the findings of Corsetti et al.,
(2001). The breads were a good source of
protein (8.02+ 0.2), low in fat (0.81+ 0.1), ash
content (2.01+ 0.04) and higher in the crude
fiber (9.91+ 0.01). These findings conforms
the earlier study of Dubravka et al., (2011). It
is observed from the Table that resistant
starch of breads increased significantly with
increase in the addition level of LAB starter
culture. Control sample showed the lowest
content of RS (3.21 per cent). Sample
T3showed the highest content of RS (6.04 per
cent) followed by T2 (5.54 per cent) and T1
(4.76 per cent). This is in accordance with
Brighenti et al., (1998).
Effect of different addition level of LAB
starter culture on organic acid content of
bread
The Sour Doughs bread of sample T3 yielded
significantly the highest lactic acid content
2229
Int.J.Curr.Microbiol.App.Sci (2019) 8(2): 2224-2239
(0.493 g/100g) followed by the Sour Doughs
of sample T2 and T1 having lactic acid to be
0.350 and 0.224 g/100g respectively. The
production of lactic acid increased
significantly by increasing the addition level
of LAB starter cultures. The lactic acid
content found in the Sour Doughs is similar to
the study reported by Robert et al., (2005).
The acetic acid content of Sour Doughs of
sample T3 produced significantly the highest
acetic acid content (0.093 g/100g) followed
by T2 (0.072 g/100g) and T1 (0.041 g/100g).
The acetic acid was found to be least in the
control sample i.e. 0.01 g/100g. The results
indicated that the production of acetic acid
increased significantly with the increased
addition level of starter cultures. The results
of the present study are in agreement to the
findings of Katina (2004) (Table 12).
Flowsheet-1: Preparation of bread by addition of sourdough
Flour (1kg)
Addition of sterile water (600ml)
Addition of bread ingredients
Incorporation of different levels of
LAB starter cultures
(0.1, 0.15 and 0.2%)
Mixing with 10 g of compressed
baker’s yeast and 15 g salt
Fermentation (at 26-30 0C & 70-75%
RH for 180 min.)
Knock back
Dividing
Intermediate Proofing at 35 0C for 45
mins
Molding and panning
Pan Proofing
Baking (232 0C for 22-25 min.)
Cooling (2 hrs.)
Slicing
Wrapping
2230
Int.J.Curr.Microbiol.App.Sci (2019) 8(2): 2224-2239
Table.1 Bread recipe used in bread production
Sr.
No.
1
2
3
4
5
6
7
Ingredients
Weight (g)
Flour (70% whole wheat flour + 30% Maida)
Water
Sugar
Shortening
Salt
Yeast
GMS
100.0
60.0
2.0
2.0
1.5
1.0
0.3
Table.2 Different levels of addition of starter culture
Sample
Lactic acid starter culture*
T1
0.1%LAB starter culture
T2
0.15%LAB starter culture
T3
0.2% LAB starter culture
Table.3 Proximate analysis of flour
Chemical Constituent (%)
Moisture
Crude fat
Crude protein
Ash
Crude fiber
NFE
Mean value
12.50
1.80
11.85
1.53
2.04
70.28
Table.4 Bread making quality parameters of flour
Parameters
Alcohol acidity (%)
Gluten content: % (Wet
basis)
Gluten content: % (Dry
basis)
Peleshnke value (min)
Sedimentation value (ml)
Falling number (Sec)
2231
Result
0.09
31.54
11.14
108
21.67
278
Int.J.Curr.Microbiol.App.Sci (2019) 8(2): 2224-2239
Table.5 Rheological characteristics of sourdough prepared with different addition level of LAB
starter cultures
Sample
Control
T1
T2
T3
Mean
SE
CD at 5%
Water
Absorption
(%)
60.71
61.21
61.50
62.03
61.3625
0.092
0.275
Arrival
time (min)
Departure
time (min)
2.0
1.94
1.92
1.91
1.9425
0.006
0.020
9.11
8.90
8.74
8.49
8.81
0.043
0.130
Peak
Time
(min)
3.20
3.17
3.09
2.80
3.065
0.030
0.091
Dough
stability
(min)
5.01
4.58
4.12
3.60
4.3275
0.101
0.303
Softening
of dough
(BU)
50.03
70.39
90.01
120.92
82.8375
5.064
15.091
Table.6 Extensibility of sour dough prepared with different level of LAB starter culture
Sample
Mean Max. force ‘resistance to
extension’ (g)
Mean Distance at Max. Force
'Extensibility'(mm)
Control (C)
T1
T2
T3
Mean
SE
CD at 5%
84.6
69.9
67.6
76.2
74.575
1.276
3.804
37.2
38.1
42.7
35.4
38.35
0.521
1.554
Table.7 Effects of different treatments on volume, specific volume, crust to crumb ratio of sour
dough bread
Treatments
Control
T1
T2
T3
Mean
SE
CD at 5%
Loaf volume (ml)
Specific volume (cm3/gm)
586
587
590
583
586.5
0.484
1.443
3.83
3.85
3.88
3.80
3.84
0.005
0.016
2232
Crust to crumb
ratio
0.255
0.259
0.260
0.263
0.25925
0.0005
0.0016
Int.J.Curr.Microbiol.App.Sci (2019) 8(2): 2224-2239
Table.8 Effect of different incorporation level of LAB starter culture on external sensorial
characteristics of sour dough bread
Sample
Control
T1
T2
T3
Mean
SE
CD at
5%
Volume
7.52
7.83
7.95
7.80
7.775
0.030
0.090
Crust
colour
7.81
7.86
8.07
7.80
7.885
0.021
0.063
Symmetry
of form
7.34
7.35
7.37
7.36
7.355
0.002
0.006
Evenness
of bake
7.34
7.38
7.39
7.37
7.370
0.003
0.010
Character
of crust
7.75
7.76
7.78
7.65
7.735
0.009
0.029
Aroma
7.12
7.70
7.81
7.89
7.630
0.058
0.174
Overall
acceptability
7.53
7.58
7.67
7.59
7.592
0.0097
0.028
Table.9 Effect of different levels of LAB starter culture on internal characteristics
Sample
Control
T1
T2
T3
Mean
SE
CD at 5%
Grain of
bread
7.35
7.48
7.53
7.49
7.4625
0.013
0.039
Colour of
crumb
7.81
7.85
7.87
7.86
7.8475
0.004
0.013
Taste
Texture
7.15
7.53
7.90
7.72
7.575
0.053
0.160
7.57
7.63
7.69
7.64
7.6325
0.008
0.024
Overall
acceptability
7.43
7.65
8.00
7.66
7.685
0.039
0.117
Table.10 Effect of different level of addition of LAB starter culture on pH and titrable acidity of
sour dough bread
Treatments
Control
T1
T2
T3
Mean
SE
CD at 5%
pH
5.4
Titrable acidity
(ml NaOH)
2.75
4.5
4.1
3.9
4.475
0.111
0.332
4.71
5.20
6.31
4.7425
0.249
0.743
2233
Int.J.Curr.Microbiol.App.Sci (2019) 8(2): 2224-2239
Table.11 Chemical composition of bread prepared with different addition level of LAB starter
culture
Sample
Moisture
(%)
Protein
(%)
Fat
(%)
Control
T1
T2
T3
Mean
SE
CD at 5%
31.02
35.13
35.80
36.53
34.62
0.415
1.233
8.02
7.91
8.01
7.9
7.96
0.010
0.031
0.81
0.73
0.7
0.76
0.75
0.007
0.023
Total
Carbohydrates
(%)
45.02
39.51
37.90
36.7
39.7825
0.618
1.838
Resistant
Starch
(% RS)
3.21
4.76
5.54
6.04
4.8875
0.208
0.618
Ash
(%)
2.01
2.11
2.14
2.15
2.1025
0.010
0.031
Crude
Fiber
(%)
9.91
9.84
9.90
9.91
9.89
0.005
0.016
Table.12 Effect of different addition level of LAB starter culture on organic acid content of
bread
Treatments
Control
T1
T2
T3
Mean
SE
CD at 5%
Lactic acid
(g/100g)
0.007
0.224
0.350
0.493
0.2685
0.034
0.103
Acetic acid
(g/100g)
0.010
0.041
0.072
0.093
0.054
0.006
0.018
Table.13 Total plate count at different storage intervals in bread samples
Treatments
Control
T1
T2
T3
0
4.2 101
-
Different storage intervals (hr.)
24
48
72
1
2
8.510
1.910
2.7 102
4 101
1.0102
1.4102
1
5.5 10
9.5 101
4.3 101
8.2 101
96
3.5 102
1.9 102
1.3 102
1.0 102
Table.14 Mold colony count at different storage intervals (hr.) in bread samples
Treatments
Control
T1
T2
T3
0
1.4 102
9 101
7 101
5 101
Different storage intervals (hr.)
24
48
72
2
2
1.9 10
2.3 10
2.9 102
1.2 102
1.6 102
2.1 102
1.0 102
1.3 102
1.7 102
8.1 101
1.0 102
1.4 102
2234
96
3.8 102
2.5 102
2.3 102
2.0 102
Int.J.Curr.Microbiol.App.Sci (2019) 8(2): 2224-2239
Table.15 Theoretical energy value of sour dough bread
Sample
Control
T1
T2
T3
Energy (Kcal)
Protein (Kcal)
32.08
Carbohydrate (Kcal)
180.08
Fat (Kcal)
7.29
31.64
32.04
31.6
158.04
151.6
146.8
6.57
6.3
6.84
Fig.1 Extensibility curve of sour dough
Fig.2 External sensorial characteristics of sour dough bread
2235
Total energy
(Kcal)
219.45
196.25
189.94
185.24
Int.J.Curr.Microbiol.App.Sci (2019) 8(2): 2224-2239
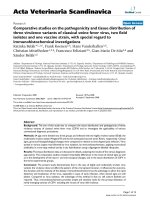
Fig.3 Internal sensorial characteristics of sour dough bread
Microbial analysis of sour dough bread
Total plate count for Sour Dough breads at
different storage intervals is given in the
Table 13. It is evident that the total plate
count was the highest (3.5 102) in breads
prepared from control yeast culture. However,
the total plate count was the lowest in Sour
Dough bread sample T3 (1.0 102) followed
by T2 (1.3 102) after 96 hours of storage. The
microbiological analysis of breads at different
storage intervals showed that the microbial
loads decreased with the increase in the
addition level of LAB starter cultures ranging
from 1.9 102 CFU/g to 1.0 102 CFU/g from
0 to 96 hour. In T1, microbial colonies
appeared after 24 h (4 101 CFU/g) and
increased (1.9 102CFU/g) in bread at 96 h of
storage. The colonies appeared after 48 h of
storage in T2 and T3 ranging from 5.5 101to
1.3 102CFU/g, 4.3 101 to 1.0 102 for the
sample T2 and T3 respectively. The total plate
count for the control ranged from 4.2 101 to
3.5 102 CFU/g. The Sour Dough breads
produced with the addition of LAB starter
cultures showed resistance against the growth
of the contaminating microorganisms. The
results of present study are in line with the
study of Latif et al., (1996)
Yeast and mold count at different storage
intervals in bread samples
Maximum number of yeast and mould
colonies were recorded in control bread (3.8
102). However, the fungal count was the
lowest in breads prepared with the sample T3
(2.0 02) followed by breads prepared by
sample T2 (2.3 102) even after 96 hours of
storage. The microbiological analysis of
breads at different storage intervals showed
that the microbial load decreased with
increased addition level of LAB starter
cultures. The mold count ranged from 1.4
102 to 3.8 102 for the control, 9 101 to 2.5
102 for T1, 7 101 to 2.3 102 for T2, 5 101
to 2.0 102 for the Sour Dough breads of
sample T3. The results are in line with the
findings of Hansen and Hansen (1994) (Table
14).
Theoretical energy value of Sour Dough
bread
It is evident from the Table 15 that total
energy value of control sample is 219.45 Kcal
while total energy value of Sour Dough bread
T1,T2 and T3 is 196.25, 189.94 and 185.24
Kcal respectively. Results showed that the
2236
Int.J.Curr.Microbiol.App.Sci (2019) 8(2): 2224-2239
total energy value of control was found to be
higher than Sour Dough bread samples. This
is due to increase in the resistant starch
content in Sour Dough bread.
In conclusion, dough was fortified with LAB
culture (Lactobacillus plantarum and
Lactobacillus brevis) at 0.1% (T1), 0.15% (T2)
and 0.2% (T3) level of incorporation. The
product prepared was evaluated for color,
flavour, taste, texture, appearance and overall
acceptability using semi-trained panel
members on 9 point hedonic rating. It can be
concluded that the LAB culture can be used
successfully in preparation of sour dough
bread at the level of 0.15% (T2) without any
undesirable changes in physical, chemical and
organoleptic attributes of bread.
References
A. A. C. C. (2000). Approved Methods of the
American
Association
of
Cereal
Chemists, 10th Ed. AACC, St. Paul, MN,
USA.
A.O. A. C. (2000). Official methods of analysis,
Association of Official Analytical
Chemists. Washington DC.
Brighenti F., Casiraghi M.C., Baggio C.,
(1998). Resistant starch in the Italian diet.
British Journal of Nutrition. 80: 333–341.
Brummer J. M, Lorenz K. (1991). European
developments in wheat sourdoughs.
Cereal Food World. 36:310–14.
Lorenz K. and Brummer J.M. (2003).
Preferments and sourdoughs in German
breads. In K. Kulp and K. Lorenz (Eds.),
Handbook of dough fermentations. New
York: Marcel Dekker Inc. pp. 247-267.
Catterall P., (1998). Flour milling. In: Cauvain,
S.P., Young, L.S. (Eds.), Technology of
Bread making. Blackie Academic and
Professional, London, pp. 296–329.
Cauvain S. (2003). Bread making: an overview.
In bread making improving quality.
Woodhead Publication Ltd. 14.
Chavan R. S. and Chavan S. R. (2011).
Sourdough Technology—A Traditional
Way for Wholesome Foods: A Review.
Comprehensive Reviews in Food Science
and Food Safety.10: 169–182.
Chavan R. S. and Jana A. (2008). Frozen dough
for bread making – a review.
International Journal of Food Science
and Technology. 2:9–27.
Clarke C., Schober T., Dockery P., O’Sullican
K. and Arendt E. (2004). Wheat
sourdough fermentation: effects of time
and
acidification
on fundamental
rheological properties. Cereal Chemistry.
81(3): 409-417.
Clarke C.I., T.J. Chober, Eangst and E.K.
Arendt. (2003). Use of response surface
methodology to investigate the effects of
processing conditions on sourdough
wheat bread quality. European Journal of
Food Research. Technol. 217:23-33
Collar C., Benedit, C. and Martinez-Anaya
M.A. (1994). Microbial sour dough
influence acidification properties and
bread making potential of wheat dough.
Journal of Food Science 59:629–33.
Corsetti A., B. Gobbetti B. De Marco, F.
Balestrieri F., Paoletti and J. Rossi
(2000). Combined effect of sourdough
lactic acid bacteria and additives on bread
firmness and staling. Journal of
Agriculture and Food Chemisty. 48:
3044-3051.
Corsetti A., Lavermicocca P., Morea M.,
Baruzzi F., Tosti N., and Gobbetti M.
(2001). Phenotypic and molecular
identification and clustering of lactic acid
bacteria and yeasts from wheat (species
Triticum durum and Triticum aestivum)
sourdoughs
of
Southern
Italy.
International
Journal
of
Food
Microbiology, 64:95–104.
Crowley P., Schober T., Clarke C., and Arendt
E. (2002). Textural and structural
properties of sourdough wheat bread.
European Food Research Technology.
214: 489-296.
Dubravka N., Duska C., Martina B., Irena CB.
And Nikolina C. (2011). Glycemic index
and phenolics of partially-baked frozen
bread with sourdough, International
2237
Int.J.Curr.Microbiol.App.Sci (2019) 8(2): 2224-2239
journal of Food Science and Nutrition,
62(1): 26-33
Ghadge P.N., Prasad K. and Kadam P.S.
(2008).Effect of fortification on the
physico- chemical and sensory properties
of buffalo milk yoghurt. Electronic
Journal of Environmental Agriculture of
Food Chemistry., 7(5): 2890-2899.
Gobbetti M, Angelis M, Arnault P, Tossut P,
Corsetti A, and Lavermicocca P. (1999).
Added pentosans in bread making:
fermentations of derived pentoses by
sourdough lactic acid bacteria. Food
Microbiology 16:409–18.
Gobbetti M, Corsetti A, and De Vincenzi S.
(1995). The sourdough microflora.
Characterization of homofermentative
lactic acid bacteria based on acidification
kinetics and impedance tests. Italian
Journal of Food Science 2:91–102.
Gobbetti M, Corsetti A, Rossi J, La Rosa F, and
Vincenzi S.D. (1994). Identification and
clustering of lactic acid bacteria and
yeasts from wheat sourdoughs of central
Italy. Italian Journal of Food Science.
1:85–94.
Hansen B. and Hansen A. (1994). Volatile
compounds
in
wheat
sourdoughs
produced by lactic acid bacteria and
sourdough
yeasts.
Zeitchcriftfür
Lebensmittel
Unterschung
und
Forschung. 198:202-209.
Hoseney C. (1994). Principles of cereal science
and technology. 2nd ed. St. Paul, Minn.:
American
Association
of
Cereal
Chemists. 67: 561-568
Jenson I. (1998). Bread and baker's yeast. In:
Wood BJB, editor. Microbiology of
fermented foods. London: Blackie
Academic and Professional. Pp. 172–98.
Katina K., Poutanen and Autio. (2004).
Influence and interactions of processing
conditions and starter culture on
formation of acids, volatile compounds
and amino acids in wheat sourdoughs.
Cereal Chemistry. 81(5): 598-610.
Katina K., Salmenkallio M., Partanen P.,
Forssell R., and Autio K. (2006). Effects
of sourdough and enzymes on staling of
high-fibre wheat bread. Food Science and
Technology. 39(5):479-491.
Katina K., E. Arendtb K.H. Liukkonen K.
Autio, L. Flander and K. Poutanen.
(2005). Potential of sourdough for
healthier cereal products. Trends Food
Science and Technology. 16: 104- 112.
Kent N.L. and Evers A.D (2000).Kent’s
technology
of
cereals
(ISBN:
1855733617).
Latif S. (1996). Effect of different types of
barley malt supplementation on the
quality of bread. M.Sc. (Hons.) Thesis,
Dept. Food Tech., Univ. Agri. Faisalabad,
Pakistan.
Magnusson J., Storm K., Ross S., Sgogren J.
and Schnurer J. (2003). Broad and
complex antifungal activity among
environmental isolates of lactic acid
bacteria.
Microbiology
Lettuces.
219:129–35.
MessensW.,and De Vuyst L. (2002). Inhibitory
substances produced by Lactobacilli
isolated from sourdoughs – a review.
International
Journal
of
Food
Microbiology. 72:31–43.
Ottogalli G., Galli A. and Foschino R. (1996).
Italian bakery products obtained with
sourdough: characterization of the typical
microflora. Advances in Food Science.
18:131–44.
Panse
G.V.
and
Sukhatme
P.V.
(1985).Statistical Method for Agricultural
Workers. ICAR, New Delhi.
Park Y.H, Jung L.H., Jeon E.R. (2006). Quality
characteristics of bread using sourdough.
Journal of Food Science and Nutrition.
33:323–27.
Peter C.M. and James H.B. (2000).Cereal
biotechnology
(Edits)
Woodhead
Publishing Limited. 2:132.
Pomeranz Y. (1988). Wheat: chemistry and
technology. AACC international. St. Paul
MN. 1: 192-198
Qarooni J. (1996). Flat bread technology. New
York: Chapman and Hall.1:99–101.
Rehman S., Paterson A and Piggott J.R.
(2006).Flavour in sourdough breads: a
review. Trends Food Science and
2238
Int.J.Curr.Microbiol.App.Sci (2019) 8(2): 2224-2239
Technology. 17:557–66.
Robert H., Gabriel V. D. Lefebvre, Rabier Y.,
Vayssier and C. Fontagne F. (2005).
Study of the behaviour of Lactobacillus
plantarum and Leuconostoc starters
during a complete wheat sourdough bread
making process. LWT-Food Science
Technology. 39: 256-265.
Rothe M. and Ruttloff H. (1983). Aroma
retention in modern bread production.
Nahrung 27:505–12.
Ryan L. M., Bello F. D., Czerny M., Koehler P.,
Arendt E. K. (2009). Quantification of
phenyllactic acid in wheat sourdough
using
high
resolution
gas
chromatography-mass
spectrometry.
Journal of Agricultural and Food
Chemistry. 57: 1060–4.
Salim-ur-Rehman, Haq N., Hussain S.,
Muhammad M. A., Anjum M. M. and
Mian S. A. (2007). Effect of Sourdough
Bacteria on the Quality and Shelf Life of
Bread. Pakistan Journal of Nutrition 6(6):
562-565.
Schober T.J., Dockery P., and Arendt E.K.,
(2003). Model studies for wheat
sourdough systems using gluten, lactate
buffer and sodium chloride. European
Food Research and Technology. 217,
235–243.
Shah P., G.M. Campbell, C. Dale and A.
Rudder. (1999). Modelling bubble growth
during proving of bread dough: predicting
the output from the Chopin rheo
fermentometer. In Campbell GM., C.
Webb, S.S. Pandiella, K. Niranjan. (eds.).
Bubbles in food. Eagan Press, St Paul,
Minn. 95-106.
Siddique, M.I. (1989). Physico-chemical
Properties of Composite Flours for
sourdough bread production. Ph.D.
Thesis, Dept. Food Tech. Univ. Agri.,
Faisalabad
Tarar O.M. (1999). Studies on shelf life of
bread using acidulants and their salts.
M.Sc. (Hons.) Thesis, Dept of Food Tech.
Univ. of Agriculture, Faisalabad.
Valerio F., Bellis P., Lonigro S. L., Visconti A.
and Lavermicocca P. (2008). Use of
Lactobacillus
plantarum fermentation
products in bread-making to prevent
bacillus
subtilisropy
spoilage .
International Journal Food Microbiology.
122:328– 32.
Wehrle K., Grau H. and Arendt E.K.,
(1997).Effects of lactic acid, acetic acid,
and table salt on fundamental rheological
properties of wheat dough. Cereal
Chemistry. 74, 739–744.
Williams P.C., Haramein F.J., Nelson W. and
Srivastava P. (1988). Particle size related
physical properties of flour produced by
smooth roll reduction of hard red spring
wheat farina, Cereal Chemistry, 65(6),
486-492.
Yun H., Quail K., and Moss R. (1996).
Physicochemical properties of wheat
flours for white salted noodles. Journal of
Cereal Science. 23:181-189.
How to cite this article:
Deshpande, H.W., S.D. Katke and Pathan M. Aziz Khan. 2019. Studies on Process
Development and Quality Evaluation of Sour Dough Bread. Int.J.Curr.Microbiol.App.Sci.
8(02): 2224-2239. doi: />
2239