Genetic parameters for grain yield and nutritional quality traits in foxtail millet [Setaria italica (L.) Beauv.]
Bạn đang xem bản rút gọn của tài liệu. Xem và tải ngay bản đầy đủ của tài liệu tại đây (160.42 KB, 6 trang )
Int.J.Curr.Microbiol.App.Sci (2019) 8(2): 4-9
International Journal of Current Microbiology and Applied Sciences
ISSN: 2319-7706 Volume 8 Number 02 (2019)
Journal homepage:
Original Research Article
/>
Genetic Parameters for Grain Yield and Nutritional Quality Traits in
Foxtail Millet [Setaria italica (L.) Beauv.]
Md Ayesha1, D. Ratna Babu2*, J. Dayal Prasad Babu3 and V. Srinivasa Rao4
1
Department of Genetics and Plant Breeding, 4Department of Statistics and Mathematics,
Agricultural College, Bapatla, India
2
Department of Genetics and Plant Breeding, APGC, Lam. Guntur, India
3
Office of DSA, ANGRAU, Guntur, India
*Corresponding author
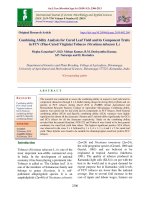
ABSTRACT
Keywords
Foxtail millet,
Variability,
Heritability and
Genetic advance
Article Info
Accepted:
04 January 2018
Available Online:
10 February 2019
The present investigation was carried out to assess the nature and magnitude of genetic
variability for yield and quality related traits in 50 genotypes of foxtail millet germplasm
collections. The experiment was laid out in an Augmented Randomised Complete Block
Design (ARCBD) at RARS, Lam, Guntur during Kharif, 2017-18. The analysis of variance
revealed the presence of significant differences for most of the traits viz., days to 50%
flowering, plant height, days to maturity, fat, carbohydrate, iron, phosphorus, calcium and
grain yield per plant indicating that the collections under study were genetically diverse for
most of the traits. Coefficient of variation studies indicated that the estimates of GCV were
lesser than the corresponding PCV estimates for all the traits indicating the influence of
environment on expression of these traits. High PCV and GCV were recorded for no. of
productive tillers per plant, fat, iron, phosphorus, calcium and grain yield per plant, while
days to 50% flowering recorded moderate PCV and GCV. The low GCV and PCV were
recorded in plant height, days to maturity and carbohydrate. The grain yield and its
components viz., days to 50% flowering, plant height, panicle length, protein, fat, iron,
phosphorus and calcium exhibited high genetic advance as per cent of mean coupled with
high estimates of heritability indicating that, there is predominance of additive gene action
in controlling the inheritance of these traits and direct phenotypic selection would be
effective for improvement of these traits.
1993). Foxtail millet is not thoroughly studied
so far and germplasm is underutilized which
resulted low productivity levels. The breeding
effort for developing high yielding varieties
followed through utilization of diverse
germplasm, creation and exploitation of the
genetic variation for different traits of
economic importance is critical in crop
Introduction
Foxtail millet is largely self-pollinated, with
cross pollination averaging about 4 per cent
(Li et al., 1935). Foxtail millet ranks second in
the world’s total production of millets and is
an important staple food for millions of people
in Southern Europe and Asia (Marathee,
4
Int.J.Curr.Microbiol.App.Sci (2019) 8(2): 4-9
improvement. In any crop improvement
programme, the knowledge of variability
available is necessary. Yield is a complex
character and is the product of the contribution
of various yield components. Presence of a
wider spectrum of variability will enhance the
chances of selecting a desired genotype.
Besides genetic variability, knowledge on
heritability and genetic advance measures the
relative degree to which a character is
transmitted to progeny, thereby helps the
breeder to employ a suitable breeding strategy
to achieve the objective. Keeping the above
points in view, the present investigation was
carried out with the objective to find the extent
of genetic variability, heritability and genetic
advance.
sense heritability was computed as suggested
by Hanson et al., (1956) and heritability in the
broad sense was categorised as per the
classification given by Johnson et al., (1955).
The range of genetic advance as per cent of
mean was classified and calculated based on
the formula given by Johnson et al., (1955).
The estimates of mean, range, PCV, GCV,
heritability (h2bs) and genetic advance as per
cent of mean (GAM) for foxtail millet
genotypes are presented in Table 1.
Results and Discussion
The variation for number of days taken to 50%
flowering ranged from 41 days (Ise-458) to 75
days (Ise-769) with a mean of 49.34 days. For
plant height the range of variation varied from
89.08 cm (Ise-1026) to 168.08 cm (Ise-160)
with a mean of 133.73 cm. The trait panicle
length has shown a variation ranging from
3.53 cm (Ise-785) to 18.53 cm (Ise-31) with a
mean of 13.59 cm. The variation for the
character number of productive tillers per
plant ranged from 1.52 (Ise-785) to 8.30 (Ise1605) with a mean of 4.42. Days to maturity is
the another important character having a
variation ranging from 72 days (Ise-1593) to
110 days (Ise-769) with a mean of 82.47days.
Test weight on the other hand has shown a
variation ranging from 1.13 g (Ise-1026) to
4.41 g (Ise-31, Ise-1881 and Ise-1892) with a
mean of 2.72 g. The protein content of the
studied genotypes ranged from 6.01 g (Ise362) to 19.56 g (Ise-838) with a mean of 11.58
g. Similarly it was 1.81 g (Ise-995) to 5.62 g
(Ise-1269) for fat with a mean of 3.52 g, 49.78
g (Ise-1419) to 73.00 g (Ise-1605) for
carbohydrate with a mean of around 64.54 g,
1.22 mg (Ise-840) to 27.73 mg (Ise-1354) for
iron with a mean of 12.54 mg, 0.11 mg (Ise1026) to 0.43 mg (Ise-1780) for phosphorous
with a mean of 0.28 mg, 5.57 mg (Ise-909) to
30.55 mg (Ise-907 and Ise-1059) for calcium
with a mean of 16.16 mg and 3.77 g (Ise-785)
to 39.83 g (Ise-1605) for grain yield per plant
Materials and Methods
The present investigation was carried out
during kharif, 2017-18 at RARS, Lam,
Guntur, Andhra Pradesh, which is located at
16.100 N latitude, 28.290 E longitude and 31.5
m altitude with 50 genotypes of foxtail millet
germplasm [Setaria italica (L.) Beauv.]
including checks. The trial was laid out in an
Augmented Randomised Complete Block
Design (Federer, 1956) with three checks viz.,
korra local, Prasad and Suryanandi in each
block. Each genotype was grown in a single
row of 4 m length with a spacing of 22.5 cm
between the rows and 10 cm between the
plants. Data were collected on five randomly
selected plants per treatment for plant height,
panicle length, no. of productive tillers per
plant and grain yield per plant. However data
on days to 50% flowering, days to maturity,
test weight, protein, fat, carbohydrate, iron,
phosphorus and were recorded on plot basis.
Phenotypic and genotypic coefficients of
variation were calculated according to the
formula given by Burton (1952) and these
PCV, GCV values were classified as described
by Sivasubramanian and Menon (1973).
Heritability (h2) in the broad sense and narrow
5
Int.J.Curr.Microbiol.App.Sci (2019) 8(2): 4-9
with a mean of around 15.18 g. Yield is a
complex character and is the product of the
contribution of various yield components.
Presence of a wider spectrum of variability
will enhance the chances of selecting a desired
genotype, as the success of any breeding
programme depends upon the quantum of
genetic variability present in the population.
et al., (2008), Nirmalakumari and Vetrivethan
(2010), Jyothsna et al., (2016) and Ashok et
al., (2016). For the character test weight the
estimate of PCV (23.08) was high and GCV
(14.44) was moderate. Similar results for high
PCV were reported by Sirisha et al., (2009),
and Kavya et al., (2017). While moderate
GCV was reported by Nirmalakumari et al.,
(2008). High PCV (21.76) and moderate GCV
(19.35) were recorded for the trait seed
protein. Similar results of high PCV were
reported by Rani (2014) in finger millet, while
Sirisha et al., (2009), Smita et al., (2016) and
Kavya et al., (2017) reported moderate GCV
for this trait in foxtail millet.
For the trait days to 50% flowering the PCV
(10.64) and GCV (10.48) estimates were
moderate indicating moderate variation among
genotypes studied and such estimates of PCV
and GCV were earlier reported by
Nirmalakumari et al., (2008), Tyagi et al.,
(2011) and Brunda et al., (2014). The
estimates of PCV (9.91) and GCV (9.87) were
low for plant height indicating less variation
among the genotypes studied. Similar results
were reported by Brunda et al., (2014) and
Jyothsna et al., (2016). The estimates of PCV
(22.28) and GCV (19.69) were high and
moderate for the character panicle length and
the difference between PCV and GCV value is
less indicating that there is little role of
environmental component in the observed
variation. Similar results for high PCV and
moderate GCV were earlier reported by
Prasad et al., (1985). For the trait number of
productive tillers per plant, the estimates of
PCV (36.36) and GCV (22.03) were high. The
difference between PCV and GCV value is
more which indicates that there is high
influence of environment in the observed
variation. Similar results of high PCV and
GCV were reported by Nirmalakumari et al.,
(2008), Nirmalakumari and Vetrivethan
(2010), Prasanna et al., (2013), Yogeesh et al.,
(2015), Jyothsna et al., (2016), Ashok et al.,
(2016) and Kavya et al., (2017). The estimates
of PCV (7.30) and GCV (7.12) were low for
days to maturity and the difference between
PCV and GCV value is less which indicates
that there is little role of environmental
component in the observed variation. These
results are in agreement with Nirmalakumari
High PCV (26.19) and GCV (24.11) were
recorded for seed fat and it was in line with
the results of Govindaraj et al., (2011) in pearl
millet. The estimates of PCV (7.03) and GCV
(6.89) were low for carbohydrate indicating
less variation among genotypes studied and
these findings are in conformity with the
results of Kavya et al., (2017). The estimates
of PCV (52.15) and GCV (51.83) were high
for the character iron and these findings are in
conformity with the results of Govindaraj et
al., (2011) in pearl millet and Smita et al.,
(2016) in foxtail millet. For phosphorous
content the estimates of PCV (26.98) and
GCV (26.64) were high indicating large
variation among genotypes studied. These
findings are in contrary to the results of
Govindaraj et al., (2011) in pearl millet where
he obtained low PCV and GCV. High PCV
(35.97) and GCV (35.47) were recorded for
the trait calcium indicating large variation
among genotypes studied and these findings
are in conformity with the results of Prasanna
et al., (2013). From the above studied PCV
and GCV values we can infer that the
genotypic coefficients of variation for all the
characters studied were lesser than the
phenotypic coefficients of variation indicating
the influence of environment on expression of
these traits.
6
Int.J.Curr.Microbiol.App.Sci (2019) 8(2): 4-9
Table.1 Estimates of variability, heritability and genetic advance as per cent of mean for grain yield and quality components in foxtail
millet [Setaria italica (L.) Beauv.]
S.
No.
1
2
3
4
5
6
7
8
9
10
11
12
13
Character
Days to 50% flowering
Plant height (cm)
Panicle length (cm)
No. of productive tillers/plant
Days to maturity
Test wt (g)
Protein (g/100g)
Fat (g/100g)
Carbohydrate (g/100g)
Iron (mg/100g)
Phosphorus (g/100g)
Calcium (mg/100g)
Grain yield/plant (g)
Mean
49.34
133.73
13.59
4.42
82.47
2.72
11.58
3.52
64.54
12.54
0.28
16.16
15.18
Range
Minimum Maximum
41.00
89.08
3.53
0.52
72.00
1.13
6.01
1.81
49.78
1.22
0.11
5.57
3.77
75.00
168.08
18.53
8.30
110.00
4.41
19.56
5.62
73.00
27.73
0.43
30.55
39.83
PCV = Phenotypic coefficient of variation
GCV = Genotypic coefficient of variation
7
Coefficient of variation
PCV (%)
GCV (%)
10.64
9.91
22.28
36.36
7.30
23.08
21.76
26.19
7.03
52.15
26.98
35.97
44.95
10.48
9.87
19.69
22.03
7.12
14.44
19.35
24.11
6.89
51.83
26.64
35.47
44.00
Heritability
(broad sense)
(%)
96.90
99.10
78.10
36.70
95.40
39.20
79.10
84.80
96.20
83.34
97.50
97.20
95.80
Genetic
advance as %
of mean
21.25
20.24
35.86
27.51
14.33
18.62
35.44
45.74
13.93
89.00
54.19
72.05
88.73
Int.J.Curr.Microbiol.App.Sci (2019) 8(2): 4-9
Consistency in the performance of selection
in succeeding generations depends on the
magnitude of heritable variation present in
relation to observed variation. The estimates
of heritability revealed that except for the
traits number of productive tillers per plant
(36.70) and test weight (39.20) all the
remaining traits were found to have high
magnitude of heritability. Heritability
estimates alone cannot give a better idea in
selecting suitable breeding method. So in
order to fulfil the requirement we have also
estimated genetic advance in addition to the
heritability. Heritability estimates along with
genetic advance are more helpful in
predicting the gain under selection than
heritability estimates alone and these will also
give a better picture for having an idea of
gene action involved. However, it is not
necessary that a character showing high
heritability will always exhibit high genetic
advance. Of the thirteen characters concerned,
high heritability coupled with high genetic
advance was noted for days to 50% flowering,
plant height, panicle length, protein, fat, iron,
phosphorous, calcium and grain yield per
plant indicating the predominance of additive
gene action, there by direct selection will be
effective to obtain the desired results. The
results were in accordance with Sirisha et al.,
(2009), Nirmalakumari and Vetrivethan
(2010), Tyagi et al., (2011), Govindaraj et al.,
(2011) in pearl millet, Brunda et al., (2014),
Yogeesh et al., (2015), Ashok et al., (2016),
Smita et al., (2016) and Kavya et al., (2017).
High heritability coupled with moderate
genetic advance were recorded for days to
maturity and carbohydrate indicating the
preponderance of both additive and non
additive gene action indicating that simple
selection will not be rewarding in improving
this trait. Similar results were earlier reported
by
Nirmalakumari
et
al.,
(2008),
Nirmalakumari and Vetrivethan (2010) and
Jyothsna et al., (2016). Moderate heritability
coupled with moderate genetic advance was
recorded for the trait test weight indicating
that there is involvement of both additive and
non-additive gene actions which may not be
exploited
through
simple
selection
procedures. However different results of high
heritability and moderate genetic advance as
per mean were indicated by Prasad et al.,
(1985). Moderate heritability coupled with
high genetic advance was recorded for
number of productive tillers per plant
indicating the preponderance of both additive
and non-additive gene action and hence
simple selection may not be rewarding. These
findings are in accordance with those of
Jyothsna et al., (2016).
References
Ashok, S., Patro, T.S.S.K., Jyothsna, S. and
Divya, M. 2016. Studies on genetic
parameters, correlation and path analysis for
grain yield and its components in foxtail
millet
(Setaria italica).
Progressive
Research. 11(3): 300-303.
Brunda, S.M., Kamatkar, M.Y., Hundekar, R.
and Naveenkumar, K.L. 2014. Studies on
genetic variability, heritability and genetic
advance in foxtail millet in both rainy and
post rainy season. IOSR-Journal of
Agriculture and Veterinary Science. 7(2):
34-37.
Burton, G.W. 1952. Quantitative inheritance in
grasses. Proceedings of the 6th International
Grassland Congress. 277-283.
Federer, W.T. 1956. Augmented designs.
Hawaiian Planter’s Record. 55: 191-208.
Govindaraj, M., Selvi, B., Rajarathinam, S. and
Sumathi, P. 2011. Genetic variability and
heritability of grain yield components and
grain mineral concentration in India’s’ pearl
millet [Pennisetum glaucum (L) R. Br.]
accessions. African Journal of Food,
Agriculture, Nutrition and Development.
11(3): 4758-4771.
Hanson, C.H., Robinson, H.F. and Comstock,
R.E. 1956. Biometrical studies of yield in
segregating
populations
of
Korean
8
Int.J.Curr.Microbiol.App.Sci (2019) 8(2): 4-9
Lespedeza. Agronomy Journal. 48(6): 268272.
Johnson, H.W., Robinson, H.F. and Comstock,
R.E. 1955. Estimates of genetic and
environmental variability in soyabean.
Agronomy Journal. 47: 314-318.
Jyothsna, S., Patro, T.S.S.K., Rani, Y.S., Ashok,
S., Neeraja, B. and Triveni, U. 2016.
Studies on genetic variability and interrelationship between grain yield and its
components in foxtail millet (Setaria
italica). International Journal of Agriculture
Sciences. 8(5): 1015-1017.
Kavya, P., Sujatha, M., Pandravada, S.R. and
Hymavathi, T.V. 2017. Variability Studies
in foxtail millet [Setaria italica (L.) P.
Beauv.]. International Journal of Current
Microbiology and Applied Sciences. 6(9):
955-960.
Li, H., Meng, W.J. and Liu, T.M. 1935.
Problems in the breeding of millet [Setaria
italica (L.) Beauv.]. Journal of American
Society of Agronomy. 27: 426–438.
Marathee,
J.P.
1993.
Structure
and
characteristics of the world millet economy.
Advances in small millets (Riley KW,
Gupta SC, Seetharam A and Mushonga JN,
eds.). New Delhi, India: Oxford & IBH.
159–178.
Nirmalakumari, A., and Vetriventhan, M. 2010.
Characterization of foxtail millet germplasm
collections for yield contributing traits.
Electronic Journal of Plant Breeding. 1(2):
140-147.
Nirmalakumari, A., Ganapathy, S. and
Murugan, R. 2008. Studies on variability
and descriptive statistics in foxtail millet
[Setaria italica (L.) Beauv.] germplasm.
Crop Research. 35(1&2): 80-82.
Prasad, G.P., Rao, N.M. and Anjanappa, M.
1985. Genetic variability in setaria (Setaria
italica (L.) Beauv.). The Andhra
Agricultural Journal. 32(1): 34-36.
Prasanna, P.L., Murthy, J.S.V.S., Kumar,
P.V.R. and Rao, S.V. 2013. Nature of gene
action for yield and yield components in
exotic genotypes of Italian millet. [Setaria
italica (L.) Beauv.]. Journal of Plant
Breeding and Crop Science. 5(5): 80-84.
Rani, A.J. 2014. Study of genetic divergence for
grain yield and yield components in finger
millet [Eleucine coracana (L.) Gaertn.].
M.Sc.(Ag.) thesis, Acharya N. G. Ranga
Agricultural University, Hyderabad.
Sirisha, A.B.M., Rao, C.P., Kumar, P.V.R. and
Rao, V.S. 2009. Variability, character
association and path coefficient analysis in
italian millet [Setaria italica (L.) Beauv.].
The Andhra Agricultural Journal. 56(4):
441-446.
Sivasubramanian, P., and Menon, P.M. 1973.
Inheritance of short stature in rice. Madras
Agricultural Journal. 60: 1129-1133.
Smita, S., Patil, J.V., Sunil, G. and Ganapathy,
K.N. 2016. Genetic variability and
association analysis for grain yield and
nutritional quality in foxtail millet.
International Journal of Bio-Resource and
Stress Management. 7(6): 1239-1243.
Tyagi, V., Ramesh, B., Kumar, D. and
Sukrampal. 2011. Genetic architecture of
yield contributing traits in foxtail millet
(Setaria italica). Current Advances in
Agricultural Sciences. 3(1): 29-32.
Yogeesh, L.N., Shankar, K.A., Prashant, S.M.
and Lokesh, G.Y. 2015. Genetic variation
and morphological diversity in foxtail
millet. International Journal of Science,
Environment and Technology. 4(6): 14961502.
How to cite this article:
Md Ayesha, D. Ratna Babu, J. Dayal Prasad Babu and Srinivasa Rao, V. 2019. Genetic
Parameters for Grain Yield and Nutritional Quality Traits in Foxtail Millet [Setaria italica (L.)
Beauv.]. Int.J.Curr.Microbiol.App.Sci. 8(02): 4-9.
doi: />
9