Expression profiling of resistance gene analogs from French bean (Phaseolus vulgaris L.) for the manifestation of rust (Uromyces phaseoli L.)
Bạn đang xem bản rút gọn của tài liệu. Xem và tải ngay bản đầy đủ của tài liệu tại đây (696.83 KB, 14 trang )
Int.J.Curr.Microbiol.App.Sci (2019) 8(3): 1760-1773
International Journal of Current Microbiology and Applied Sciences
ISSN: 2319-7706 Volume 8 Number 03 (2019)
Journal homepage:
Original Research Article
/>
Expression Profiling of Resistance Gene Analogs from French Bean
(Phaseolus vulgaris L.) for the Manifestation of Rust (Uromyces phaseoli L.)
B. Divya*, B. Fakrudin and V. Devappa
College of Horticulture, Bengaluru, University of Horticulutural Sciences, Bagalkot, India
*Corresponding author
ABSTRACT
Keywords
French bean, RGAs,
Arka Anoop, Arka
Sharath, Rust and
Expression analysis
Article Info
Accepted:
15 February 2019
Available Online:
10 March 2019
The resistant french bean genotype Arka Anoop and susceptible genotype Arka Sharath
were used for expression profiling of RGAs for the manifestation of rust. Leaf tissue was
collected from both resistant and susceptible genotypes which were challenged with rust
spores separately at 15 DAI and 45 DAI and synthesized cDNA. The expression level of
selected 10 RGA genes of french bean was measured in both resistant and susceptible
genotype rust inoculated leaf tissues separately at 15 DAI and 45 DAI. At 15 DAI, in case
of pathogen challenged leaf of resistant genotypes, the 9 COHFBRGA genes
(COHFBRGA1 to COHFBRGA38 except COHFBRGA2) were up-regulated with a fold
change range of 0.79 to 169.01 and COHFBRGA2 was down regulated with a fold change
of 0.79. Whereas, at 30 DAI in the resistant genotype, all RGA genes were up-regulated
with a fold change range of 20.01 (COHFBRGA9) to 115.69 (COHFBRGA25). In case of
susceptible genotype, 5 RGA genes with the fold change ranged between 1.59 and 11.10
(15 DAI) and 7 RGA genes with 0.10 (COHFBRGA38) to 19.29 (COHFBRGA9) were
down-regulated. Highest fold expression was found at 15 DAI in resistance genotype by
COHFBRGA26 and lowest noticed in susceptible genotype at 30 DAI by COHFBRGA38.
Introduction
French bean, Phaseolus vulgaris L. (2n = 22)
is a member of the family Fabaceae. It is an
important legume vegetable grown for its
tender green pods either for fresh
consumption or for processing as canned,
frozen or freeze dried product. It is a nutritive
vegetable which supplies protein (1.8 g),
calcium (132 mg), thiamin (0.08 mg),
riboflavin (0.06 mg) and vitamin C (24 mg)
per 100 g of edible pods. Its pods can be used
to strengthen diuretic, flushing of toxins from
the body and also infused in the treatment of
diabetics (Prajapati, 2003).
It is native of new world, principally Central
and South America (Kalpan, 1981) with small
genome 633 Mbp (Arumuganatham and
Earle, 1991). It is originated from wild
species Phaseolus aborigineus L. and
domesticated in Mexico, Peru and Colombia
about 8000 years ago. In world, french bean is
grown over an area of 1.48 million ha with
annual production of 17.65 million MT and
the productivity of 11.95 t/ha. In India, its
cultivation is in 0.21 million ha with
production of 0.58 million MT and
productivity of 2.8 t/ha (Anon., 2015).
1760
Int.J.Curr.Microbiol.App.Sci (2019) 8(3): 1760-1773
Like any other crops, legume vegetables are
also susceptible to various biotic and abiotic
stresses. Among the biotic stresses, rust
(Uromyces phaseoli L.) has become epidemic
in bean growing areas and especially in
locations where humid to moderately humid
conditions, long dew periods and cool
conditions prevail during the growing season
of beans. U. phaseoli is an autoecious,
macrocyclic, obligate parasite acts both on
inter and intracellular tissue by inserting
haustoria (Rangaswamy, 1975). The pathogen
infects leaves, pods, petioles, rarely stems and
branches. Initial symptoms appear usually on
the lower surfaces as minute whitish slightly
raised spots. These spots enlarge to form
mature reddish brown pustules (Harter and
Zaumeyer, 1941).
The yield loss due to rust ranges from 18 to
78 per cent (Mohan et al., 1993). This disease
is more severe in tropics than in temperate
region (Coyne and Schuster, 1975).
Fungicides
like
chlorothalonil,
dithiocarbamates, triazoles and carboxins
(Liebenberg and Pretorius, 2010) are being
used to control the disease. But, genetic
resistance always has an edge over the other
means of disease control as it is eco-friendly.
Host plant resistance is very important
because of high virulence and diversity of rust
pathogen (Lopez et al., 2003).
Many defense responses are initiated by
resistance gene/genes, providing a mechanism
by which the plant can recognize a pathogen
and execute a defense response against it.
Plant resistance (R) genes are thought to be
one of the components of the genetic
resistance mechanism in plants (Flor, 1956).
Development of plant organs is determined by
differential gene expression which can be
regulated at different levels. Numerous R
genes and RGAs have now been cloned,
determination of activity and specificity
against a given pathogen for development of
durable resistance is important in french bean
and other crop species (Madsen et al., 2003).
Advancement in technologies such as DNA
sequencing
methodologies,
throughput
platform DNA array, northern blotting,
subtractive hybridization, real-time PCR etc.
have tremendously increased our knowledge
of transcriptomes. But, the advent of real-time
PCR technology has significantly changed the
field of measuring gene expression in both the
animal and plant molecular biology research.
Real-time PCR is the technique of collecting
data throughout the PCR process as it occurs,
thus combining amplification and the
detection into a single step. It has become one
of the most widely used methods of gene
quantitation because of its high sensitivity,
good reproducibility and wide dynamic
quantitation range. It is the most sensitive
method for the detection and quantitation of
gene expression levels, in particular for low
abundant transcripts in tissues with low RNA
concentrations, from limited tissue sample
and for the elucidation of small changes in
mRNA expression levels (Mackay et al.,
2002). Keeping these in view, we conducted
on expressional analysis of resistance gene
analogs in response to rust disease
manifestation in French bean.
Materials and Methods
Plant material and growth condition
French bean genotypes resistant (Arka
Anoop) and susceptible (Arka Sharath) to rust
were raised in pots containing a mixture of
soil, sand and well decomposed Farm Yard
Manure (FYM) in the ratio of 2:1:1. The filled
pots were kept in polyhouse. The pot mixture
was sterilized before use. In replicated trials
one seed was sown in each pot. Rust spores
were collected from infected plants in farmers
filed and dissolved in water at 103
concentration and spread on pots one month
1761
Int.J.Curr.Microbiol.App.Sci (2019) 8(3): 1760-1773
after sowing. Control pots were maintained
without inoculation both in resistant and
susceptible genotypes. Both from susceptible
and resistant french bean genotypes the
tissues were collected from leaf tissues. Under
virulent pathogen challenging situations,
tissues from different stages (15 and 30 days
after post inoculation and till the completion
of the disease infestation) targeting different
stages of disease manifestation were collected
both from challenged and control plant. The
tissues were frozen with liquid nitrogen and
stored at -800C for isolation of total RNA
(Plate 1).
components using gradient PCR by
Eppendorf master cycles gradient. PCR
reactions were performed for genotype in a
total volume of 20 μl containing 100 ng of
cDNA, 1× PCR buffer, 2.5 mM MgCl2, 0.2
mM dNTPs, 0.1 μM of each primer, and 2.5
units of Taq polymerase (Invitrogen Life
Technologies, Carlsbad, CA). Cycling
conditions were initial denaturation at 95°C
for 10 min, followed by 40 amplification
cycles (95°C for 15s, annealing temp °C for
20s, and 68°C for 20s) and a melting curve
step at 95°C for 10 min before holding at
4°C).
RNA isolation and cDNA synthesis
primer
The master mix of different components of
real-time PCR was prepared fresh to avoid
handling errors. The reaction mixture of 10 μl
containing 1.0 ng cDNA, 200 nM of each
gene specific primer and 5 μl of 2x SYBR
green reagents (Cat.#4368706, Ambion,
USA) were used in the experiment. Individual
components of reaction mixture were
standardized for 10 μl reaction volume. In our
experiment we selected Arabidopsis thaliana
housekeeping gene actin as an internal control
(Caldana et al., 2007 and Czechowski et al.,
2004).
For 10 selected sequences of RGAs cloned in
the our previous study the primer pairs were
designed using Primer3Plus software and
primers were synthesized by Eurofins
Genomics India Pvt. Ltd. Bengaluru. A
predicted melting temperature (Tm) of
60+2°C, primer lengths of 20-24 nucleotides,
guanine-cytosine (GC) contents of 45-55 per
cent and PCR amplicon length of 90-200 base
pairs (bp) were adopted for designing the
primer pairs. The specificity of primer pairs
were reconfirmed by searching homology in
NCBI, BLAST search. The list of candidate
genes and their respective primer pairs are
shown in Table 1. PCR amplification of
RGAs was optimized for different
The mathematical model delta-delta Ct
method (Livak and Schmittgen, 2001) was
used to determine relative expression ratio
(fold change). In real-time PCR, fluorescence
was recorded at each cycle to monitor the
generation of amplified product. For proper
calculation of initial target levels, differences
in efficiency of amplification (E) must be
taken into consideration. Even small
differences in amplification efficiencies (E)
will get added up making large apparent
differences in mRNA levels. The absolute
quantification requires a set up of standard
curves from which PCR efficiency will be
deduce; the disadvantages of standard curves
are (i) the extra efforts and cost needed to set
up additional samples (ii) Non matching E
Total RNA was isolated from leaf tissues of
Arka Anoop and Arka Sharath genotypes
from both rust infected and non infected
conditions using TRIzol reagent. and driver
cDNAs were prepared from the total RNA of
each treatment by using SuperScript®
VILO™ cDNA Synthesis Kit (Cat.no.11754050, Invitrogen) as per the manufacturer’s
protocol.
Candidate-gene
design
selection
and
1762
Int.J.Curr.Microbiol.App.Sci (2019) 8(3): 1760-1773
due to presence of inhibitors and serial
dilutions. The relative quantification with
PCR efficiency correction was adopted to
calculate the fold change expression.
PCR efficiency of all the RGAs was obtained
from the exponential phase of each individual
amplification plot using the equation (1+E)
=10slope (Ramakers et al., 2003). The
LinReg
PCR
(info
@amc.uva.nl; subject: LinRegPCR) software
based on the above equation proposed a linear
regression on the log fluorescence per cycle
number data as an assumption-free method
was used to calculate starting concentrations
of mRNA and PCR efficiencies for each
sample. The log-linear part of the PCR data
was determined for each sample by selecting
a lower and an upper limit of a “window of
linearity”. Linear regression analyses was
used to calculate the intercept and the slope,
log (No) and log (eff.) respectively, from the
straight line that fits best to the included data
points. The individual PCR efficiency follows
from the slope of the linear regression line
(Eff =10slope) and used as a quality check to
exclude possible contained samples. To
ensure unambiguous selection of data point
within the “window of linearity”, the lines
consisting of at least 4 and not more than 6
data points with the highest R2 value (0.99)
and slope close to the maximum slope were
selected.
to the curves generated by the amplifier and it
should be subtracted from the raw
fluorescence without distorting the data
considerably. For background correction, the
baseline fluorescence data was collected from
3-15 cycles. The fluorescence increments
(raw fluorescence -Yo) were normalized to
reaction fluorescence background (Yo) for
each sample reaction as below (Yu et al.,
2006).
Normalized
fluorescence
fluorescence -Yo/ Yo
=
raw
The proposed method minimized the
influence of the initial vertical background
shift of reaction. The background corrected or
normalized fluorescence data was used to
calculate PCR efficiency by LinReg PCR
software. The calculated PCR efficiency was
used to derive fold expression of TFs gene
using the following method:
(E target) – Δ Ct
Ratio = -----------------------------(E control) – Δ Ct
E target = PCR efficiency of target gene in
sample.
E control = PCR efficiency of target gene in
control.
Δ Ct = (Ct of target gene - Ct of reference
gene).
Processing the raw fluorescence data
Results and Discussion
Pre-requisite for LinReg PCR to achieve
maximum PCR efficiency is background
corrected fluorescence data points of each
well. Raw fluorescence data was obtained
from the Applied Biosystems stepone RTPCR and this background was due to residual
fluorescence of the dye, differences in tube
transparency, dust, noise of the electronics
etc. In majority of cases, a variable
background makes a near-linear contribution
Predicted features and functions of 10 cloned
RGA genes were selected in this experiment
for their expression analysis (Table 1). The
total RNA from each treatment was treated
with DNase I enzyme to eliminate traces of
genomic DNA (Plate 2). Actual confirmation
of complete degradation of genomic DNA in
RNA preparation was done through PCR
amplification using total RNA as template.
There was no amplification from the total
1763
Int.J.Curr.Microbiol.App.Sci (2019) 8(3): 1760-1773
RNA preparation indicating absence of traces
of genomic DNA as contamination (Plate 3
and
4).
However,
elimination
of
contaminating genomic DNA enzymatically
is very important in gene expression analysis
using qRT-PCR (Chini et al., 2007). Presence
of genomic DNA/genetic copies of genes
seriously alter the precision of expression
quantitation of genes in target tissues.
Generally, 18S rRNA, EF-1, α actin, β tubulin
and ubiquitin (UBQ) genes are considered as
good reference genes for any gene expression
experiment (Caldana, 2007; Czechowski et
al., 2004). The gene expression stability
measure (M) was estimated to identify the
most stable reference gene among actin
(AC1), β-tubulin, 18S rRNA and elongation
factor-1 through qRT-PCR in a set of 3
different cDNA samples corresponding to
different interval of day after flowering i.e. 7
DAI, 15 DAI and 30 DAF tissues from french
bean leaves inoculated with rust (where
inoculated samples were collected from both
resistant and susceptible genotypes at
different intervals). The NormFinder software
which uses model-based variance estimation
approach was used; the M value should be
<1.5. The M value, 0.298, 0.311 and 0.326 for
actin (AC1), 18S rRNA and β-tubulin
respectively, based on M value actin (AC1)
gene was selected as endogenous reference
gene for rest of qRT-PCR experiments. In
several instances these gene has been tested
and used as reference genes in qRT-PCR
experiments, and the M values of these
reports are within the range of present
experimental results (Claus et al., 2004; Ruth
et al., 2008; Kakar et al., 2008). It is the most
stable combination indicating the absence of
significant differences in the expression levels
of reference genes in varied experimental
conditions. In several instances of plant gene
expression analysis by qRT-PCR these genes
with similar combination have been adopted
(Marino et al., 2003).
PCR efficiency correction was used to
calculate the fold change expression in the
relative quantification of gene expression.
The PCR efficiency of selected genes was
calculated from the exponential phase of
individual amplification plot using the
equation (1+E) = 10slope (Ramakers et al.,
2003). Subsequently, the average PCR
efficiencies were computed for each
individual primer pairs across all analyzed
samples. The range of PCR efficiency
determined was in consistent with the results
reported by Kakar et al., (2008), Caldana et
al., (2007) and Czechowski et al., (2004).
Further, PCR efficiency was used to calculate
final fold change of selected genes. The deltadelta Ct method (Livak and Schmittgen,
2001) was used to determine relative
expression ratio of 27 genes (fold change).
The delta-delta mathematical model of
determining fold changes in the expression of
genes is widely adopted in qRT-PCR
(Czechowski et al., 2004; Buchanan et al.,
2005; Caldana et al., 2007; Yang et al., 2010).
In this method an amplification efficiency of
each gene specific primer pairs from the log
slope of fluorescence versus cycle number in
the exponential phase and the same is used to
calculate fold expression using the delta-delta
Ct method. Similarly, Caldana et al., (2007)
and Yang et al., (2010) used delta-delta Ct
method to calculate relative fold change in
rice and common bean respectively.
The technical precision of qRT-PCR was
assessed
by
performing
replicated
measurements in separate PCR runs. The
same pool of cDNA to account the precision
in technique employed and two different
pools of cDNA obtained independently from
two different batches of total RNA under
same condition to test precision of biological
responses of plant to different day after
inoculation were used. Precision, as reflected
by the correlation coefficient, was high in
both cases; technical and biological replicates
1764
Int.J.Curr.Microbiol.App.Sci (2019) 8(3): 1760-1773
recorded correlation coefficient values greater
than 0.970 and 0.968 in different day after
inoculation tissues indicating high precision
of technical and biological treatments and
response of french bean tissues (Figure 2a and
2b). A similar strategy to monitor the
technical and biological precision of
experiment was adopted by Czechowski et
al., (2004) in Arabidopsis thaliana and by
Kakar et al., (2008) in Medicago.
Table.1 Specific primer pair sequences of french bean RGAs analyzed in response to MYMV
disease manifestation using qRT-PCR
Sl.
no.
1
2
3
4
5
6
7
8
9
10
Primer name
Primer sequence (5’-3’)
COHFBRGA1_F
ATGCAGGCCTCTGCAGTC
Length
(bp)
18
COHFBRGA1_R
ACCTCGCGAATGCATCTA
18
57.9
50.0
COHFBRGA2_F
GAGTCAGTGAGCGAGGAAGC
20
60.3
60.0
COHFBRGA2_R
AGCTTGGCGTAATCATGGTC
20
60.1
50.0
COHFBRGA3_F
ACCATGATTACGCCAAGCTC
20
60.1
50.0
COHFBRGA3_R
CAGCAGCAGAAGCACAACTC
20
59.9
55.0
COHFBRGA4_F
CAGGCGACGTCGAGATCTAT
20
60.4
55.0
COHFBRGA4_R
GTGCTGCAAGGCGATTAAGT
20
60.4
50.0
COHFBRGA9_F
GAGTCAGTGAGCGAGGAAGC
20
60.3
60.0
COHFBRGA9_R
AGCTTGGCGTAATCATGGTC
20
60.1
50.0
COHFBRGA25_F
GTCGAGGAAATGGCCAAA
18
59.6
50.0
COHFBRGA25_R
CACAGTCCCAGCAGCAGA
18
59.7
61.1
COHFBRGA26_F
CGAGGAAATGGCCAAAAGTA
20
60.1
45.0
COHFBRGA26_R
CGCTGGAAGAAGAGAAATGC
20
60.1
50.0
COHFBRGA27_F
CGAGGAAATGGCCAAAAGTA
20
60.1
45.0
COHFBRGA27_R
CGCTGGAAGAAGAGAAATGC
20
60.1
50.0
COHFBRGA32_F
CTCCGCCTAGGAGTGAGTTG
20
60.0
60.0
COHFBRGA32_R
GCCGTGCCTAAAGACTGAAC
20
59.9
55.0
COHFBRGA38_F
AACGTCGTGACTGGGAAAAC
20
60.0
50.0
COHFBRGA38_R
AATTTCCATTCGCCATTCAG
20
59.9
40.0
1765
Tm
(°C)
60.1
GC (%)
61.1
Product
size (bp)
163
263
245
162
263
154
179
179
217
145
Int.J.Curr.Microbiol.App.Sci (2019) 8(3): 1760-1773
Table.2 Relative change in the expression pattern of selected R genes found in rust inoculated leaf tissue of different genotypes of
french bean
Sl. No.
R gene
Normalize Ct values
(control)
15
15
30
30
DAIR DAIS DAIR DAIS
Normalize Ct values
15
15
30
30
DAIR DAIS DAIR DAIS
Fold expression
Log10 ratio
Cal. t value
15
DAIR
15
DAIS
30
DAIR
30
15
15
30
30
15 15 DAIS 30
DAIS DAIR DAIS DAIR DAIS DAIR
DAIR
30
DAIS
1
RGA1
1.45
3.03
2.64
2.04
1.45
6.65
2.64
4.90
4.72
6.65
33.31
0.27
0.67
-1.09
4.52
-0.56
0.21
0.32
0.32
0.81
2
RGA2
-1.07
0.91
-0.11
-1.40
-1.07
1.59
-0.12
1.46
0.79
1.59
44.85
0.68
-0.10
-0.21
5.65
-0.17
0.20
0.32
0.32
0.82
3
RGA3
-0.10
4.67
3.84
1.00
-0.10
6.22
3.84
3.86
56.90
6.22
57.88
1.75
1.76
-0.47
4.76
0.24
0.20
0.33
0.33
0.82
4
RGA4
6.66
11.85
8.68
9.84
6.66
9.77
8.67
12.70
1.42
9.77
40.60
0.56
0.15
0.62
3.61
-0.26
0.32
0.33
0.33
0.98
5
RGA5
0.80
11.85
2.08
1.35
0.80
3.90
2.08
4.21
12.98
3.90
78.49
19.29
1.11
2.39
5.89
2.30
0.30
0.34
0.34
0.98
6
RGA6
0.98
2.67
2.52
0.27
0.98
3.98
2.52
3.13
1.45
3.98
115.69
0.72
0.16
-0.40
6.06
-0.14
0.34
0.35
0.35
0.30
7
RGA7
4.60
-4.16
8.40
3.82
4.59
11.07
8.40
6.68
169.01
11.07
39.30
0.00
2.23
-4.58
4.59
-3.26
0.35
0.37
0.37
0.32
8
RGA8
-8.15
-3.01
-4.34
-4.41
-8.15
-2.97
-4.34
-1.55
1.04
-2.97
53.77
0.36
0.02
-0.01
8.73
-0.44
0.32
0.40
0.40
0.36
9
RGA9
-0.01
0.16
1.35
0.96
-0.01
2.87
1.35
3.82
1.69
2.87
20.01
0.08
0.23
-0.82
7.32
-1.10
0.57
0.40
0.40
0.45
10
RGA10
3.17
5.79
5.03
6.24
3.17
11.10
5.02
9.10
22.04
11.10
32.55
0.10
1.34
-1.60
6.51
-1.00
0.35
0.37
0.46
0.47
1766
Int.J.Curr.Microbiol.App.Sci (2019) 8(3): 1760-1773
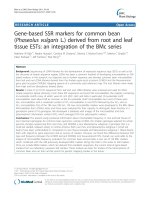
Fig.1 Relative change in the expression pattern of selected RGA genes found in rust manifested
leaf tissue at 15 and 30 days after inoculation of resistant and susceptible genotypes in french
bean
1
2
3
4
5
COHFBRGA1
COHFBRGA2
COHFBRGA3
COHFBRGA4
COHFBRGA9
6
7
8
9
10
COHFBRGA25
COHFBRGA26
COHFBRGA27
COHFBRGA32
COHFBRGA38
Fig.2a Technical precision of real time PCR reflected as correlation coefficient between the
duplicate measurements of cDNA levels of genes from the same reverse transcription reaction
(biological replicates)
Fig.2b Technical precision of real time PCR reflected as correlation coefficient between the
duplicate measurements of cDNA levels of genes from the same reverse transcription reaction
(technical replicates)
1767
Int.J.Curr.Microbiol.App.Sci (2019) 8(3): 1760-1773
1768
Int.J.Curr.Microbiol.App.Sci (2019) 8(3): 1760-1773
1769
Int.J.Curr.Microbiol.App.Sci (2019) 8(3): 1760-1773
Melting curve analyses was performed for all
PCR products to confirm the occurrence of
specific amplification peaks and the absence
of primer-dimer formation. Melting curve
analysis showed that all 10 genes were giving
specific amplification and there was absence
of primer-dimer formation. Similar technical
and biological precision in drought stress
experiments leading to qRT-PCR testing of
RGA gene was reported in Arabidopsis (Liu
et al., 2007; Huang et al., 2008; Seo et al.,
2009), soyabean (Stolf-Moreira et al., 2010)
and maize (Li and Wang, 2007; Xiao-feng et
al., 2009).
The expression level of selected 10 RGA
genes of french bean was measured in both
resistant and susceptible genotype rust
inoculated leaf tissues separately at 15 DAI
and 45 DAI. All the 10 genes at 30 DAI and
except COHFBRGA2 at 15 DAI were upregulated
in
resistant
genotype.
COHFBRGA1,
COHFBRGA2,
COHFBRGA25,
COHFBRGA9
and
COHFBRGA38 were down-regulated in
susceptible genotype at 15 and 30 DAI.
Whereas, COHFBRGA4, COHFBRGA9 and
COHFBRGA27 (15 DAI) and COHFBRGA9
at
30
DAI
showed
up-regulation.
COHFBRGA3 up-regulated at 30 DAI but
expressed inversely at 15 DAI in susceptible
genotype. Similarly, there was inverse trend
in the expression status of COHFBRGA4 and
COHFBRGA27. There was down-regulation
of these genes at 30 DAI and were upregulated at 15 DAI. But COHFBRGA26 was
down-regulated in susceptible genotype at 15
DAI and did not express at 30 DAI (Table 2).
RGA genes up-regulating and downregulating in leaf tissues of both resistant and
susceptible genotypes at 15 DAI and 30DAI
in pathogen challenged conditions is
illustrated in Figure 1. At 15 DAI, in case of
pathogen challenged leaf of resistant
genotypes, the 9 COHFBRGA genes
(COHFBRGA1 to COHFBRGA38 except
COHFBRGA2) were up-regulated with a fold
change range of 0.79 to 169.01 and
COHFBRGA2 was down regulated with a
fold change of 0.79. Whereas, at 30 DAI in
the resistant genotype, all RGA genes were
up-regulated with a fold change range of
20.01
(COHFBRGA9)
to
115.69
(COHFBRGA25). In case of susceptible
genotype, 5 RGA genes with the fold change
ranged between 1.59 and 11.10 (15 DAI) and
7 RGA genes with 0.10 (COHFBRGA38) to
19.29 (COHFBRGA9) were down-regulated.
Highest fold expression was found at 15 DAI
in resistance genotype by COHFBRGA26 and
lowest noticed in susceptible genotype at 30
DAI by COHFBRGA38 (Figure 1).
Emediato et al., (2013) revealed that, gene
expression for RGAs in both compatible and
incompatible interactions across the infection
time course with Mycosphaerella musicola in
banana showed low levels of RGA expression
in the early infection stages and up-regulation
in late stages.
In contrast, other RGAs displayed high
expression levels in the resistant cultivar
during the early infection stage, strong downregulation in the intermediate infection stage,
and recovery to higher levels in the final
stages of the infection time course. Wang et
al., (2006) reported that differences in
transcript levels could be correlated with the
reaction to susceptibility/resistance of the host
plant to pathogen. Gao et al., (2006) found
that some RGAs were expressed only after
challenge with Verticillium dahlia in cotton.
In conclusion, this study strongly suggests
that in common bean Assessing expression of
RGAs in other tissues apart from leaf tissue at
two time points to gain deeper understanding
of these genes in manifestation of other
disease.
1770
Int.J.Curr.Microbiol.App.Sci (2019) 8(3): 1760-1773
References
Anonymous.2015. Statistical data on
horticulture crops in Karnataka state.
Department
of
Horticulture.
Government of Karnataka. Lalbagh.
Bangalore.
Arumuganatham, K. And Earle, E. D.1991.
Nuclear DNA content of some
important plant species. Plant. Mol.
Boil. Rept., 9: 208-218.
Buchanan, C. D., Lim, S., Salzman, R. A.,
Kagiampakis, I., Morishige, D. T.,
Weers, B. D., Klein, R. R., Pratt, L.
H., Cordonnier-Pratt, M. M., Klein, P.
E. And Mullet, J. E.. 2005. Sorghum
bicolor transcriptome response to
dehydration, high salinity and ABA.
Pl. Mol. Bio., 58: 699-720.
Chini, V., Foka, A., Dimitracopoulos, G. And
Spiliopoulou. 2007. Absolute and
relative real time PCR in the
quantitation of tst gene expression
among
methicillin
resistant
Staphylococcus aureus: Evaluation by
two mathematical models. Soc. App.
Microbiol., 45: 479-484.
Claus, A. L., Jens, J. L. And Torben, O. F.
2004. Normalization of real-time
quantitative reverse transcription-PCR
data: A model-based variance
estimation approach to identify genes
suited for normalization, applied to
bladder and colon cancer data sets.
Cancer Res., 64: 5245-5250.
Coyne, D. P. And Schuster, M. L. 1975.
Genetic and breeding strategy for
resistance to rust (Uromyces phaseoli
Reben Wint.) in beans (Phaseolus
vulgaris L.). Euphytica, 24: 795-803.
Czechowski, T., Bari, R. P., Stitt, M.,
Scheible, W. R. And Udvardi, M. K.
2004. Real time PCR profiling of over
1400
Arabidopsis
transcription
factors: unprecedented sensitivity
reveals novel root and shoot specific
genes. Pl. J., 38: 366-379.
Emediato, F. L., Passos, M. A. N., Teixeira,
D. C. C., Pappas, G. J. And Miller, R.
N. G. 2013. Analysis of Expression of
NBS LRR resistance gene analogs in
Musa acuminata during compatible
and incompatible interactions with
Mycosphaerella musicola. Acta Hort.,
986: 255-258.
Flor, H. H. 1956. The complementary genic
system in flax and fax rust. Adv.
Genet., 8: 29-54.
Gao, Y. L., Guo, W. Z., Wang, L. And Zhang,
T.
Z.
2006.
Isolation
and
characterization of resistance and
defense gene analogs in cotton
(Gossypium barbadense L.). Life Sci.,
49:530-542.
Harter, L. L. And Zaumeyer, W. J. 1941.
Differentiation of physiological races
of Uromyces phaseoli typica on bean.
J. Agric. Res, 62: 717-731.
Huang, D., Wu, W., ABRAMS, S., R. And
Cutler, A., J. 2008. The relationship of
drought related gene expression in
Arabidopsis thaliana to hormonal and
environmental factors. J. Exp. Bot.,
59(11): 2991–3007.
Kakar, K., Wandrey, M., Czechowski, T.,
Gaertner, T., Scheible, W. R., Stitt, S.,
Torres-JEREZ, I., Xiao, X., Redman,
J. C., Wu, H. C., Cheung, F., Town, C.
D. And Udvardi, M. K. 2008. A
community
resource
for
high
throughput quantitative RT PCR
analysis of transcription factor gene
expression in Medicago truncatula.
Pl. Meth, 4: 18-23.
Kalpan., 1981. What is the origin of the
common bean? Econ. Bot., 35: 240–
254.
Li, H. Y. And Wang, T. Y. 2007. Isolation
and characterization of induced genes
under drought stress at the flowering
stage in maize. DNA Seq., 18(6): 445460.
1771
Int.J.Curr.Microbiol.App.Sci (2019) 8(3): 1760-1773
Liebenberg, M. M. And Pretorius, Z. A.2010.
Common Bean Rust: Pathology and
Control. Horticultural Reviews, 37: 174.
Liu, C., Zhou, J., Bracha-Drori, K., Yalovsky,
S., Ito, T. And YU, H. 2007.
Specification of Arabidopsis floral
meristem identity by repression of
flowering time genes. Develop., 134:
1901-1910.
Livak, K. J. And Schmittgen, T. D. 2001.
Analysis of relative gene expression
data using real time quantitative PCR
and the 2-DDCT method. Pl. Meth.,
25: 402-408.
Lopez, C. E., Acosta, I. F., Jara, C., Pedraza,
F., Gaitan-Solis, E., Gallego, G.,
Beebe, S. And Tohme, J. 2003.
Identifying resistance gene analogs
associated with resistance to different
pathogens
in
common
bean.
Phytopathol., 93: 88-95.
Mackay, I. M., Arden, K. E. And Nitsche, A.
2002. Real time PCR in virology.
Nucl. Acids Res., 30: 1292-1305.
Marino, H. J., Cook, P. And Miller, K.
S.2003. Accurate and statistically
verified quantification of relative
mRNA abundances using SYBR
Green I and realtime RT-PCR. J.
Immunol. Meth., 283: 291–306.
Mohan, N., Aghora, T. S., AND Girija,
G.1993. Sources of resistance to rust
(Uromyces phaseoli) in french bean.
In: Golden Jubilee Symposium
Horticultural Research changing
Scenario,
May
24-28,
1993.
Bangalore, Karnataka, India.
Prajapati, N. D.2003. A hand book of
medicinal plants: A complete source
book. Agrobios. Jhodhpur. 538, 539
and 390.
Ramakers, C., Ruitjer, J. M., Deprez, R. H.
And
Moorman,
A.
F.2003.
Assumption
free
analysis
of
quantitative real time polymerase
chain reaction (PCR) data. Neurosci.
Let., 13: 62-66.
Rangaswamy, G.1975. Diseases of Crop
Pants in India (2nd edn.), Prentice
Hall of India Pvt., Ltd., New Delhi,
pp. 250.
Ruth, C., Martin, V. G., Hollenbeck, T.,
James, E. And Dombrowski, G., 2008,
Evaluation of reference genes for
quantitative RT-PCR in Lolium
perenne. Crop Sci., 48: 1881- 1887.
Seo, P. J., Xiang, F., Qiao, M., Park, J. Y.,
Lee, Y. N., Kim, S. G., Lee, Y. H.,
Park, W. J. And Park, C. M., 2009,
The MYB96 transcription factor
mediates abscisic acid signaling
during drought stress response in
Arabidopsis. Pl. Physiol., 151: 275289.
Stolf-Moreira, R., Lemos, E. G. M., CararetoAlves, L., Marcondes, J., Pereira, S.
S., Rolla, A. A. P., Pereira, R. M.,
Neumaier,
N.,
Binneck,
E.,
Abdelnoor, R. V., Oliveira, M. C. N.,
Marcelino, F. C., Farias, J. R. B. And
Nepomuceno,
A.
L.2010.
Transcriptional profiles of roots of
different soybean genotypes subjected
to drought stress. Pl. Mol. Bio. Rep.,
56: 234-241.
Wang, X., El Hadrami, A., Adam, L. R. And
Daayf, F.2006. Local and distal gene
expression of pr-1 and PR-5 in potato
leaves inoculated with isolates from
the old (US-1) and the new (US-8)
genotypes of Phytophthora infestans
(Mont.). Environ. Exp. Bot., 57:70-79.
Xiao-Feng, D., Feng-Ling, F. And Wan-Chen,
L, I. 2009 Differential gene expression
in response to drought stress in maize
seedling. Agril. Sci., 8(7): 767- 776.
Yang, S. S., Valdés-López, O., Xu, W. W.,
Bucciarelli1, B., Gronwald, J. W.,
Hernández G. And Vancel, C. P.2010.
Transcript profiling of common bean
1772
Int.J.Curr.Microbiol.App.Sci (2019) 8(3): 1760-1773
(Phaseolus vulgaris L.) using the gene
chip
soybean
genome
array:
Optimizing analysis by masking
biased probes. BMC Pl. Biol., 10: 158.CALDANA, C., SCHEIBLE, W.
R., MUELLER-ROEBER, B. AND
RUZICIC, S., 2007, A quantitative RT
PCR platform for high-throughput
expression profiling of 2500 rice
transcription factors. Pl. Meth., 3:
1746-1748.
Yu, A., Geng, H. And Zhou, X.2006.
Quantify
single
nucleotide
polymorphism (SNP) ratio in pooled
DNA
based
on
normalized
fluorescence real time PCR. BMC
Genom., 7: 143-153.
How to cite this article:
Divya, B., B. Fakrudin and Devappa, V. 2019. Expression Profiling of Resistance Gene
Analogs from French Bean (Phaseolus vulgaris L.) for the Manifestation of Rust (Uromyces
phaseoli L.). Int.J.Curr.Microbiol.App.Sci. 8(03): 1760-1773.
doi: />
1773