Performance of chickpea-mustard intercropping on yield and economics of chickpea and mustard crop under different fertility management and various row combinations
Bạn đang xem bản rút gọn của tài liệu. Xem và tải ngay bản đầy đủ của tài liệu tại đây (234.18 KB, 14 trang )
Int.J.Curr.Microbiol.App.Sci (2019) 8(1): 236-249
International Journal of Current Microbiology and Applied Sciences
ISSN: 2319-7706 Volume 8 Number 01 (2019)
Journal homepage:
Original Research Article
/>
Performance of Chickpea-Mustard Intercropping on Yield and
Economics of Chickpea and Mustard Crop under Different Fertility
Management and Various Row Combinations
Vipul Singh*, Ghanshyam Singh, Vinay Kumar Pandey,
Manoj Kumar and Ajay Singh
Department of Agronomy, Narendra Deva University of Agriculture and Technology,
Faizabad (U.P.), India
*Corresponding author
ABSTRACT
Keywords
Chickpea, Mustard,
Fertility
management,
Intercropping and
Row combinations
Article Info
Accepted:
xx December 2018
Available Online:
xx January 2019
A field experiment was carried out at Agronomy Research Farm of Narendra Deva
University of Agriculture and Technology, Narendra Nagar (Kumarganj), Faizabad (U.P.)
during Rabi season of 2015-16 and 2016-17 to study the effect of fertility management on
chickpea-mustard intercropping under various row combinations. Twenty four treatment
combinations and consisted of three levels of fertility management (75% RDF, 100% RDF
and 125% RDF for both crops) and eight row combinations of chickpea + mustard (2:1,
4:1, 6:1, 2:2, 4:2, 6:2, sole crop of mustard and sole crop of chickpea).The experiment was
conducted in Factorial RBD with three replications. The yield components of chickpea &
mustard were maximum under 4:1 (4 row chickpea+ 1 row mustard) row combination in
both the consecutive years and among the fertility management 125% RDF being at par
with 100% RDF during both the consecutive years. The maximum chickpea equivalent
yield (CEY) was recorded under the treatment combinations of 4:1 (4 row chickpea + 1
row mustard) with 125% RDF which was significantly superior to overall the treatment
during both the years and maximum land equivalent ratio (LER) was obtained at 125%
RDF in a combination of 4:1 (4 row chickpea + 1 row mustard) in both the years. Number
of seeds plant-1 and harvest index in chickpea crop were not influenced significantly due to
fertility management and row combinations during both the consecutive years. The highest
net return (Rs. 87103 ha-1) and benefit cost ratio (4.68) were obtained with fertility
management 125% RDF for both crops in a combination of 4:1 (4 row chickpea + 1 row
mustard) could be most economical.
Introduction
Chickpea, the third most important pulse crop,
plays a vital role in global agricultural
economy. In the central and northern region of
India, the most commonly grown winter pulse
and oilseed crops are chickpea and mustard.
When a legume is grown in association with
other crop (intercropping), commonly oilseeds
and cereals, the nitrogen nutrition of the
associated crop improved by direct nitrogen
transfer from legume to oilseed or cereal
(Giller and Wilson, 1991). Legume intercrops
are also potential sources of plant nutrient that
236
Int.J.Curr.Microbiol.App.Sci (2019) 8(1): 236-249
compliment/ supplement inorganic fertilizers.
In addition, legumes are included in cropping
system because they reduce soil erosion
(Giller and Cadisch, 1995) and suppress
weeds (Exner and Cruse, 1993).
Intercropping utilizes the inter space of widely
space crop like mustard and chickpea.
Chickpea cultivation with mustard crop
augments the production and profitability.
Chickpea being legume augment the nitrogen
nutrition through nitrogen fixation and
consequently improve the soil fertility. Further
the production and profitability of mustardchickpea intercropping may be increased
through the use of optimum dose of fertilizers.
Cereal with legume intercropping is common
but the work done so far on oilseed and
legume intercropping with a suitable nutrient
management and proper crop ratio in merge.
Hence, the present study is to be ethiopian
mustard/chickpea
intercropping
system
recorded higher mustard equivalent yield over
sole mustard and sole chickpea. In
intercropping, the values of relative crowding
coefficient, AY L, aggressivity, and
competitive ratio indicated that the Ethiopian
mustard was more competitive than chickpea.
In association with mustard + chickpea as
inter crop with optimum dose of fertilizers
improved the yield of both crops. Tanwar et
al. (2011) replied that mustard + chickpea
intercropping with ratio of (1:6) and fertilizer
with 100% RFN + full P and K recorded
highest yield and net profit. Hence, an
experiment was planned to study the
production potential of chickpea + mustard
intercropping at various row combination at
varying fertility levels.
The soil of experimental field was low in
available nitrogen (203.00 and 208.00 kg/ha)
and organic carbon (0.38% and 0.42%),
medium in available phosphorus (12.25 and
13.20 kg/ha) and high in potassium (265.00
and 267 kg/ha) in Ist and IInd year,
respectively. The reaction of the soil was
slightly alkaline (7.8). The experiment was
laid out in Factorial RBD with three fertility
management (75% RDF, 100% RDF and
125% RDF for both crops) and eight row
combinations (2:1, 4:1, 6:1, 2:2, 4:2, 6:2, sole
crop of mustard and sole crop of chickpea)
with three replication. There were twenty four
treatment combinations comprised of 3
fertility management and 8 row combinations.
The sowing was done on 25 October in 2015
and 27 October in 2016 with the seed rate of
100 kg/ha for chickpea crop and 6 kg/ha for
mustard crop and spacing between rows was
30 cm apart. An uniform dose of 100 kg P2O5
ha-1 in chickpea and 114 kg N + 125 kg P2O5
+ 67 kg K2O ha-1 in mustard was applied to all
treatments. Full dose of phosphorus as per
treatments and potassium along with half of
the nitrogen were applied as basal while
remaining half dose of nitrogen was topdressed at first irrigation. Tube-well was the
source of irrigation. Irrigations were applied at
all critical stages. In order to check the weeds
growth one manual weeding was done at 35
days after sowing. The crop was harvested at
proper stage of maturity as determined by
visual observations on 17 February in 2015
and 19 February in 2016.
Results and Discussion
Chickpea
Materials and Methods
Yield contributing characters
The field experiment was conducted at
Agronomy Research Farm, Narendra Deva
University of Agriculture and Technology,
Narendra Nagar (Kumarganj) Faizabad (U.P.),
during Rabi season of 2015-16 and 2016-17.
Number of pods plant-1
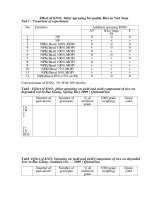
A perusal of data in table 1 revealed that the
maximum number of pods plant-1 recorded in
fertilizer 125% RDF and significantly superior
237
Int.J.Curr.Microbiol.App.Sci (2019) 8(1): 236-249
over rest of the fertility management during
both the years.
Combination of sole chickpea produced
significantly higher number of pods plant-1
which was at par with 2:1, 4:1, 6:1, 4:2 and
6:2 and
found significant with 2:2
chickpea+mustard row combination during
both the consecutive years. Interaction effect
between fertility management and row
combination was not significant.
Higher value of these indices was recorded at
125 % RDF which increased slightly with an
increase in levels of fertilizer. This findings
are in line of those Abraham et al. (2010),
Gokhale et al. (2008), Karwasra and Kumar
(2007), Tripathi et al. (2005b), Hossain et al.
(2003), and Bhohra and Srivastava (2002).
Number of pods plant-1 varied significantly
among the row combinations of chickpeamustard intercropping pattern. Among the row
ratios in intercropping systems, maximum
values of these indices were recorded under
sole chickpea which was at par with all row
combinations and found significant with 2:2
row combination in both the years. This might
be due to lesser inter-crop competition, higher
photosynthetic active radiation and latent heat
available to the crops leading to higher
production of photosynthates which together
favourably influenced the yield attributing
parameters. This finding is in conformity with
the results of Kumar and Singh (2006), Kumar
et al. (2006), Tripathi et al. (2005b) and
Ahlawat et al. (2005a).
Number of seeds plant-1
The data revealed that the number of seeds
plant-1 was not influenced significantly by
fertility management and row combination.
Number of seeds plant-1 did not vary
significantly at different fertility levels in both
the years. This findings are in line of those
Abraham et al. (2010), Gokhale et al. (2008),
Karwasra and Kumar (2007), Tripathi et al.
(2005b), Hossain et al. (2003), and Bhohra
and Srivastava (2002).
100-seed weight (g)
The data revealed that the maximum 100-seed
weight (g) was recorded with fertilizer 125%
RDF which was at par with 100% RDF and
found significant with 75% RDF during both
the years. However, as regards row
combinations, sole chickpea recorded higher
test weight being at par with 2:1, 4:1, 6:1, 4:2
and 6:2 and significantly superior over 2:2
chickpea-mustard intercropping in both the
years. Interaction effect between fertility
management and row combination was not
significant.
Test weight of chickpea influenced
significantly at different fertility levels in both
the years. Higher value of these indices was
recorded at 125 % RDF which increased
slightly with an increase in levels of fertilizer.
This findings are in line of those Abraham et
al. (2010), Gokhale et al. (2008), Karwasra
and Kumar (2007), Tripathi et al. (2005b),
Hossain et al. (2003), and Bhohra and
Srivastava (2002).
Test weight (g) varied significantly among the
row combinations of chickpea-mustard
intercropping pattern. Among the row ratios in
intercropping systems, maximum values of
these indices were recorded under sole
chickpea which was at par with all row
combinations and found significant with 2:2
row combination in both the years. This might
be due to lesser inter-crop competition, higher
photosynthetic active radiation and latent heat
available to the crops leading to higher
production of photosynthates which together
favourably influenced the yield attributing
parameters. This finding is in conformity with
the results of Kumar and Singh (2006), Kumar
238
Int.J.Curr.Microbiol.App.Sci (2019) 8(1): 236-249
et al. (2006), Tripathi et al. (2005b) and
Ahlawat et al. (2005a).
Yield characters
Biological yield (q ha-1)
The biological Yield (q ha-1) influenced
significantly by fertility management and row
combination. The maximum biological yield
was found with 125% RDF and significantly
superior over rest of the fertility management
during both the consecutive years. This might
be due to increasing levels of fertilizers to
intercrops increases photosynthetic rates and
translocation of photosynthate to different
plant parts and influenced the yield of
intercrops. Abraham et al. (2011), Tripathi et
al. (2005b), Bohra and Srivastava (2002),
Singh and Verma (1997) and Singh et al.
(1998) reported the similar results.
Combination of sole chickpea produced
significantly higher biological yield at all the
stages of growth which was significantly more
than rest combinations of row in both the
years. Interaction effect between fertility
management and row combination was not
significant. Sole chickpea recorded maximum
biological yield which was found significantly
superior to overall the row combinations in
both the years. The result of this investigation
also get supported from those obtained by
Kumar and Nandan (2007), Kumar and Singh
(2006), Kumar et al. (2006), Tripathi et al.
(2005b), Ahlawat et al. (2005a) and Thakur et
al. (2000).
increasing levels of fertilizers to intercrops
increases
photosynthetic
rates
and
translocation of photosynthate to different
plant parts and influenced the yield of
intercrops. Abraham et al. (2011), Tripathi et
al. (2005b), Bohra and Srivastava (2002),
Singh and Verma (1997) and Singh et al.
(1998) reported the similar results (Table 2).
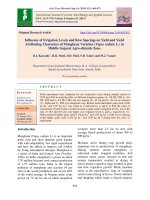
Row combination had significant effect on the
seed yield. The maximum seed yield was
obtained of 18.92 q ha-1 in first year and 19.12
q ha-1 with sole chickpea which was
significantly superior to over all the treatment.
However, the lowest seed yield was recorded
with 2:2 (2 row chickpea + 2 row mustard)
row combination. The interaction between
fertility management and row combination did
not influence seed yield significantly.
In the present experiment seed yield of
chickpea were highest in their respective sole
crop as compare to their intercropping, it was
obvious due to more number of plant
population in sole than intercropping. The
result of this investigation also get supported
from those obtained by Kumar and Nandan
(2007), Kumar and Singh (2006), Kumar et al.
(2006), Tripathi et al. (2005b), Ahlawat et al.
(2005a) and Thakur et al. (2000).
Straw yield (q ha-1)
Seed yield (q ha-1)
The highest straw yield of 20.75 q ha-1 in
first year and 21.07 q ha-1 was obtained with
125% RDF and significantly superior to other
fertilizers. However, the lowest straw yield
was recorded with 75% RDF fertility
management in both the years.
The highest seed yield of 16.72 q ha-1 in first
year and 16.99 q ha-1 in second year was
obtained with 125% RDF and significantly
superior to other fertility management.
However, the lowest seed yield was recorded
with 75% RDF. This might be due to
This might be due to increasing levels of
fertilizers
to
intercrops
increases
photosynthetic rates and translocation of
photosynthate to different plant parts and
influenced the yield of intercrops. Abraham et
al. (2011), Tripathi et al. (2005b), Bohra and
239
Int.J.Curr.Microbiol.App.Sci (2019) 8(1): 236-249
Srivastava (2002), Singh and Verma (1997)
and Singh et al. (1998) reported the similar
results.
Row combination had significant effect on the
straw yield. The maximum straw yield was
obtained of 23.47 q ha-1 in first year and
23.63 q ha-1 with sole chickpea which was
significantly superior to overall the treatments.
However, the lowest straw yield was recorded
with 2:2 (2 row chickpea + 2 row mustard)
during both the years. The interaction effect
between fertility management and row
combinations was found not significant.
In the present experiment straw yield of
chickpea were highest in their respective sole
crop as compare to their intercropping, it was
obvious due to more number of plant
population in sole than intercropping. The
result of this investigation also get supported
from those obtained by Kumar and Nandan
(2007), Kumar and Singh (2006), Kumar et al.
(2006), Tripathi et al. (2005b), Ahlawat et al.
(2005a) and Thakur et al. (2000).
Harvest index (%)
Harvest index was influenced nonsignificantly with fertility management and
row combinations during both the years. This
might be due to increasing levels of fertilizers
to intercrops increases photosynthetic rates
and translocation of photosynthate to different
plant parts and influenced the yield of
intercrops. Abraham et al. (2011), Tripathi et
al. (2005b), Bohra and Srivastava (2002),
Singh and Verma (1997) and Singh et al.
(1998) reported the similar results.
In the present experiment harvest index was
not influenced significantly with various row
combinations.
The result of this investigation also get
supported from those obtained by Kumar and
Nandan (2007), Kumar and Singh (2006),
Kumar et al. (2006), Tripathi et al. (2005b),
Ahlawat et al. (2005a) and Thakur et al.
(2000).
Mustard
Yield contributing characters
Number of siliquae plant-1
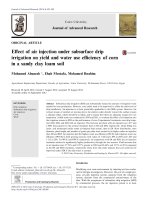
A perusal of data in table 3 revealed that the
maximum number of siliquae plant-1 recorded
in fertilizer 125% RDF which was at par with
fertilizer 100% RDF and found significant
with fertilizer 75% RDF during both the years.
Combination of 6:1 chickpea+mustard
produced significantly higher number of
siliquae plant-1 which was at par with 2:1, 4:1,
2:2, 4:2 and 6:2 row combination and found
significant with sole mustard row combination
during both the consecutive years. Interaction
effect between fertility management and row
combination was not significant.
The maximum number of siliquae plant-1 of
mustard was recorded at 125% RDF, which
was significantly superior to 75% RDF and at
par with 100% RDF in both the years. This
findings are in line of those Abraham et al.
(2010), Gokhale et al. (2008), Karwasra and
Kumar (2007), Tripathi et al. (2005b),
Hossain et al. (2003), and Bhohra and
Srivastava (2002).
In the present investigation, maximum value
of these indices were recorded under 6:1 row
combination which was found at par with all
row combination and found significant with
sole mustard in both the years.
Similar results were obtained by Kumar and
Singh (2006), Tripathi et al., (2005b) and
Ahlawat et al. (2005a) also.
240
Int.J.Curr.Microbiol.App.Sci (2019) 8(1): 236-249
Length of siliquae (cm)
The maximum length of siliquae was noted
with the application of 125% RDF which was
at par with 100% RDF and found significant
with 75% RDF during both the years.
As
regards
row
combinations
of
chickpea+mustard intercropping, length of
siliquae (cm) increased significantly upto 6:1
row combination being at par with 2:1, 4:1,
2:2, 4:2 and 6:2 row combination and found
significant with sole mustard row combination
in both the consecutive years. Interaction
effect was not significant.
In the present investigation, maximum value
of these indices were recorded under 6:1 row
combination which was found at par with all
row combination and found significant with
sole mustard in both the years. Similar results
were obtained by Kumar and Singh (2006),
Tripathi et al., (2005b) and Ahlawat et al.
(2005a) also.
Number of seeds siliquae-1
The number of seeds siliquae-1 influenced by
fertility management and row combinations.
The maximum number of seeds siliquae-1 was
found with recommended dose of fertilizer
125% RDF for both crops which was at par
with 100% RDF and found significant with
75% RDF during both the consecutive years.
Combination of 6:1 chickpea+mustard
intercropping produced significantly higher
number of seeds siliquae-1 which was at par
with 2:1, 4:1, 2:2, 4:2
and 6:2 row
combination and found significant with sole
mustard row combination in both the
consecutive years.
Interaction
effect
between
fertility
management and row combination was not
significant.
The maximum number of seeds siliquae-1 of
mustard was recorded at 125% RDF, which
was significantly superior to 75% RDF and at
par with 100% RDF in both the years. This
findings are in line of those Abraham et al.
(2010), Gokhale et al. (2008), Karwasra and
Kumar (2007), Tripathi et al. (2005b),
Hossain et al. (2003), and Bhohra and
Srivastava (2002).
In the present investigation, maximum value
of these indices were recorded under 6:1 row
combination which was found at par with all
row combination and found significant with
sole mustard in both the years. Similar results
were obtained by Kumar and Singh (2006),
Tripathi et al. (2005b) and Ahlawat et al.
(2005a) also.
Test weight (g)
The data revealed that the maximum test
weight (g) was recorded with fertilizer 125%
RDF which was at par with 100% RDF and
found significant with 75% RDF during both
the
years.
However,
as
regards
chickpea+mustard row combinations, 6:1
recorded higher test weight being at par with
2:1, 4:1, 2:2, 4:2 and 6:2 row combination
and significantly superior over sole mustard in
both the years. Interaction effect between
fertility management and row combination
was not significant.
Test weight of mustard crop influenced
significantly among the different fertility
levels in both the years. This findings are in
line of those Abraham et al. (2010), Gokhale
et al. (2008), Karwasra and Kumar (2007),
Tripathi et al. (2005b), Hossain et al. (2003),
and Bhohra and Srivastava (2002).
In the present investigation, maximum value
of these indices were recorded under 6:1 row
combination which was found at par with all
row combination and found significant with
241
Int.J.Curr.Microbiol.App.Sci (2019) 8(1): 236-249
sole mustard in both the years. Similar results
were obtained by Kumar and Singh (2006),
Tripathi et al. (2005b) and Ahlawat et al.
(2005a) also.
(2007), Kumar and Singh (2006), Kumar et al.
(2006), Tripathi et al. (2005b), Ahlawat et al.
(2005a) and Thakur et al. (2000).
Stover yield (q ha-1)
Yield characters
-1
Seed yield (q ha )
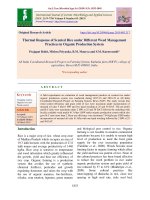
The highest seed yield of 7.60 q ha-1 in first
year and 7.67 q ha-1 in second year was
obtained with 125% RDF and significantly
superior to other fertility management.
However, the lowest seed yield was recorded
with 75% RDF (Table 4).
Row combination had significant effect on the
seed yield. The maximum seed yield was
obtained of 14.29 q ha-1 in first year and 14.44
q ha-1 in second year with sole mustard which
was significantly superior to over all the
treatment. However, the lowest seed yield was
recorded with 6:1 (6 row chickpea + 1 row
mustard) row combination. The interaction
between fertility management and row
combination did not influence seed yield
significantly.
In mustard maximum seed yield were
recorded at 125 % RDF and significantly
scored over 75% RDF in both the years. This
might be due to increasing levels of fertilizers
to intercrops increases photosynthetic rates
and translocation of photosynthate to different
plant parts and influenced the yield of
intercrops. Abraham et al. (2011), Tripathi et
al. (2005b), Bohra and Srivastava (2002),
Singh and Verma (1997) and Singh et al.
(1998) reported the similar results.
In the present experiment grain yield of
mustard were highest in their respective sole
crop as compare to their intercropping, it was
obvious due to more number of plant
population in sole than intercropping. The
result of this investigation also get supported
from those obtained by Kumar and Nandan
The highest stover yield of 23.79 q ha-1 in first
year and 31.73 q ha-1 was obtained with 125%
RDF and significantly superior to other
fertilizers. However, the lowest stover yield
was recorded with 75% RDF fertility
management in both the years.
Row combination had significant effect on the
stover yield. The maximum stover yield was
obtained of 44.36 q ha-1 in first year and
59.16 q ha-1 with sole mustard which was
significantly superior to overall the treatments.
However, the lowest straw yield was recorded
with 6:1 (6 row chickpea + 1 row mustard)
during both the years. The interaction effect
between fertility management and row
combinations was found not significant.
In mustard maximum stover yield were
recorded at 125 % RDF and significantly
scored over 75% RDF in both the years in
both the years. This might be due to increasing
levels of fertilizers to intercrops increases
photosynthetic rates and translocation of
photosynthate to different plant parts and
influenced the yield of intercrops. Abraham et
al. (2011), Tripathi et al. (2005b), Bohra and
Srivastava (2002), Singh and Verma (1997)
and Singh et al. (1998) reported the similar
results.
In the present experiment straw yield of
mustard were highest in their respective sole
crop as compare to their intercropping, it was
obvious due to more number of plant
population in sole than intercropping. The
result of this investigation also get supported
from those obtained by Kumar and Nandan
(2007), Kumar and Singh (2006), Kumar et al.
(2006), Tripathi et al. (2005b), Ahlawat et al.
(2005a) and Thakur et al. (2000) (Table 5).
242
Int.J.Curr.Microbiol.App.Sci (2019) 8(1): 236-249
Chickpae
Table.1 Yield contributing characters of chickpea as influenced by different fertility
management and various row combinations
Treatments
Fertilizer managementF1- 75% RDF
F2- 100% RDF
F3- 125% RDF
S.Em.+
C.D.(5%)
Row combinationsC1- 2:1
C2- 4:1
C3-6:1
C4- 2:2
C5- 4:2
C6- 6:2
C7-Sole Chickpea
S.Em.+
C.D.(5%)
No. of Pods/ Plant
No. of Seeds/ Pod
100 Seed Weight (g)
58.8
63.3
65.8
0.65
1.86
1.04
1.07
1.14
0.05
NS
17.66
18.15
18.37
0.15
0.43
61.6
62.8
63.7
61.1
62.1
62.9
64.2
0.99
2.84
1.07
1.09
1.10
1.06
1.07
1.09
1.11
0.07
NS
17.86
18.04
18.30
17.75
17.86
18.16
18.45
0.23
0.66
Table.2 Seed yield (q ha-1), straw yield (q ha-1), biological yield (q ha-1) and harvest index as
influenced by different fertility management and various row combinations
Treatments
Seed yield (q
ha-1)
Fertilizer management15.15
F1- 75% RDF
16.86
F2- 100% RDF
0.24
F3- 125% RDF
0.68
S.Em.+
0.68
C.D.(5%)
Row combinations13.15
C1- 2:1
16.50
C2- 4:1
16.70
C3-6:1
10.49
C4- 2:2
13.41
C5- 4:2
14.77
C6- 6:2
19.02
C7-Sole Chickpea
0.37
S.Em.+
1.04
C.D.(5%)
Straw yield (q
ha-1)
Biological yield (q
ha-1)
Harvest Index
(%)
18.78
20.91
0.58
0.58
1.65
28.08
33.92
37.765
0.775
2.215
44.595
44.655
44.62
0.37
NS
16.32
20.49
20.70
13.04
16.66
17.99
23.55
0.88
2.52
29.47
36.99
37.395
23.525
30.07
32.765
42.57
1.185
3.385
44.6
44.605
44.65
44.595
44.585
44.62
44.675
0.565
NS
243
Int.J.Curr.Microbiol.App.Sci (2019) 8(1): 236-249
Mustard
Table.3 Yield contributing characters of mustard as influenced by different fertility management
and various row combinations
Treatments
Number of
siliquae plant-1
Fertility management
225.3
F1- 75% RDF
244.8
F2- 100% RDF
253.7
F3- 125% RDF
3.45
S.Em.+
9.85
C.D.(5%)
Row combinations
244.5
C1- 2:1
246.3
C2- 4:1
250.0
C3-6:1
236.3
C4- 2:2
239.4
C5- 4:2
242.1
C6- 6:2
230.0
C7-Sole Mustard
5.27
S.Em.+
15.06
C.D.(5%)
Length of
siliquae (cm)
Number of seeds
siliquae-1
1000-grain
weight (g)
5.8
6.1
6.3
0.09
0.26
10.5
11.0
11.2
0.14
0.39
4.1
4.2
4.3
0.06
0.16
6.1
6.2
6.3
5.9
6.0
6.1
5.8
0.14
0.40
11.0
11.1
11.3
10.7
10.8
10.9
10.5
0.21
0.59
4.2
4.3
4.3
4.1
4.1
4.2
4.0
0.09
0.24
Table.4 Seed yield, stover yield and harvest index as influenced by different fertility
management and various row combinations
Treatments
Seed yield (q ha-1)
Fertility management
5.0
F1- 75% RDF
6.7
F2- 100% RDF
7.6
F3- 125% RDF
0.08
S.Em.+
0.23
C.D.(5%)
Row combinations
5.8
C1- 2:1
3.8
C2- 4:1
2.7
C3-6:1
8.7
C4- 2:2
5.5
C5- 4:2
4.3
C6- 6:2
14.4
C7-Sole Mustard
0.13
S.Em.+
0.35
C.D.(5%)
Stover yield (q ha-1)
Harvest Index (%)
18.5
24.4
27.8
0.20
0.56
23.78
24.105
24.06
0.09
0.26
21.5
13.9
10.1
31.6
20.5
15.7
51.8
0.30
0.86
23.855
24.06
23.68
24.175
23.755
23.97
24.355
0.14
0.39
244
Int.J.Curr.Microbiol.App.Sci (2019) 8(1): 236-249
Table.5 Chickpea yield equivalent (CYE) and land equivalent ratio (LER) as influenced by
different fertility management and various row combinations
Treatments
Seed Yield (q ha-1)
*CYE (q/ha)
#LER
Chickpea
Mustard
T1- 75% RDF- 2:1
11.21
4.46
14.34
1.08
T2- 75% RDF- 4:1
13.44
2.92
15.51
1.08
T3 75% RDF-6:1
14.22
2.02
15.64
1.05
T4- 75% RDF- 2:2
8.77
6.93
13.62
1.25
T5- 75% RDF- 4:2
11.62
4.24
14.64
1.09
T6- 75% RDF- 6:2
12.46
3.18
14.80
1.04
T7- 75% RDF-MUSTARD
0.00
11.28
8.57
1.00
T8- 75% RDF- CHICKPEA
16.43
0.00
16.43
1.00
T9- 100% RDF- 2:1
13.48
6.04
17.66
1.11
T10- 100% RDF- 4:1
16.20
3.95
18.98
1.15
T11-100% RDF-6:1
17.13
2.94
19.19
1.13
T12- 100% RDF- 2:2
10.82
9.11
17.10
1.17
T13- 100% RDF- 4:2
13.77
5.75
17.77
1.12
T14- 100% RDF- 6:2
15.29
4.39
18.42
1.12
T15- 100% RDF-MUSTARD
0.00
14.77
10.99
0.92
T16- 100% RDF- CHICKPEA
19.32
0.00
19.32
1.08
T17- 125% RDF- 2:1
14.77
6.96
19.49
1.13
T18- 125% RDF- 4:1
19.87
4.45
22.96
1.25
T19-125% RDF-6:1
18.76
3.17
20.96
1.12
T20- 125% RDF- 2:2
11.87
10.09
18.78
1.16
T21- 125% RDF- 4:2
14.86
6.52
19.33
1.11
T22- 125% RDF- 6:2
16.57
5.21
20.13
1.13
T23- 125% RDF-MUSTARD
0.00
17.04
12.40
0.96
T24- 125% RDF- CHICKPEA
21.32
0.00
21.32
1.07
S.Em+
0.38
0.37
0.59
-
C.D.(5%)
1.12
1.05
1.69
-
C.V.(%)
6.88
6.13
6.08
-
245
Int.J.Curr.Microbiol.App.Sci (2019) 8(1): 236-249
Table.6 Economics of various treatment combinations
Treatments
Cost of cultivation
(Rs/ha)
Gross income
(Rs/ha)
Net income
(Rs/ha)
B:C
T1- 75% RDF- 2:1
16382
65618
49236
3.01
T2- 75% RDF- 4:1
17102
71234
54132
3.17
T3 75% RDF-6:1
17359
72065
54706
3.15
T4- 75% RDF- 2:2
15559
61972
46413
2.98
T5- 75% RDF- 4:2
16382
66846
50464
3.08
T6- 75% RDF- 6:2
16844
67479
50635
3.01
T7- 75% RDF-MUSTARD
12988
34722
21734
1.67
T8- 75% RDF- CHICKPEA
18130
76070
57940
3.20
T9- 100% RDF- 2:1
17218
81011
63793
3.71
T10- 100% RDF- 4:1
17849
87194
69345
3.89
T11-100% RDF-6:1
18074
88367
70293
3.89
T12- 100% RDF- 2:2
16497
78120
61623
3.74
T13- 100% RDF- 4:2
17218
81430
64212
3.73
T14- 100% RDF- 6:2
17623
84330
66707
3.79
T15- 100% RDFMUSTARD
14244
45448
31204
2.19
T16- 100% RDFCHICKPEA
18750
89472
70722
3.77
T17- 125% RDF- 2:1
18054
89802
71748
3.97
T18- 125% RDF- 4:1
18596
105699
87103
4.68
T19-125% RDF-6:1
18790
96641
77851
4.14
T20- 125% RDF- 2:2
17435
85982
68547
3.93
T21- 125% RDF- 4:2
18054
88897
70843
3.92
T22- 125% RDF- 6:2
18402
92769
74367
4.04
T23- 125% RDFMUSTARD
15500
52426
36926
2.38
T24- 125% RDFCHICKPEA
19370
98708
79338
4.10
246
Int.J.Curr.Microbiol.App.Sci (2019) 8(1): 236-249
a combination of 4:1 chickpea+mustard
during both the years of experimentation;
differences were found to be significant
among the fertility levels in both the years.
These findings are in the line of those of
Abraham et al. (2011), Srivastava et al.
(2007), Tripathi et al. (2005a), Varshney and
Arya (2004) and Shrivastava et al. (1996).
Harvest index
The harvest index influenced significantly by
fertility management and row combination.
The maximum harvest index was found with
100% RDF which was at par with 125% RDF
and found significant with 75% RDF in first
year and maximum harvest index was found
with 100% RDF which was at par with 75%
RDF and 125% RDF in second year.
In the present investigation, the maximum
CYE and LER was recorded in 4:1 row ratio
of chickpea + mustard which was found
significantly superior to overall the row
combinations. The higher CYE and LER ratio
in this row ratio of 4:1 was as result of
increase in seed yield of component crop in
intercropping systems with little effect on the
yield of main crop. This finding is in close
conformity with the result of and Kumar and
Nandan (2007), Kumar and Singh (2006),
Kumar et al. (2006), Tripathi et al. (2005a),
Ali and Mishra (2002) and Pali et al. (1997).
Combination of sole mustard produced
significantly higher harvest index which was
at par with 4:1 and 2:2 and found significantly
superior to rest of the chickpea+mustard row
combinations in first year and maximum
harvest index was recorded with sole mustard
which was at par with 2:2 and 6:2 and
significantly superior to rest of the
chikpea+mustard row combinations in second
year. Interaction effect between fertility
management and row combination was not
significant.
Economics
Harvest index of mustard influenced
significantly at different levels of fertilizer in
both the years. This might be due to
increasing levels of fertilizers to intercrops
increases
photosynthetic
rates
and
translocation of photosynthate to different
plant parts and influenced the yield of
intercrops. Abraham et al. (2011), Tripathi et
al. (2005b), Bohra and Srivastava (2002),
Singh and Verma (1997) and Singh et al.
(1998) reported the similar results. The result
of this investigation also get supported from
those obtained by Kumar and Nandan (2007),
Kumar and Singh (2006), Kumar et al.
(2006), Tripathi et al. (2005b), Ahlawat et al.
(2005a) and Thakur et al. (2000).
In the present investigation gross return, net
return and benefit: cost ratio show significant
variation among the fertilizer levels in both
the years of investigation. Maximum gross
return, net return and benefit: cost ratio was
recorded under 125% RDF in both the years.
These indices increased with increase in
levels of fertilizers up to 125 % RDF, increase
in fertilizer levels slightly increased the value
of these indices in both the years. This might
be due to higher cost involvement in the
application of fertilizers at higher fertility
level without commensurate increase in the
crop yield of the systems. This may have
followed the trend of the law of diminishing
returns. These results are in close conformity
with those of Abraham et al. (2011),
Srivastava et al. (2007), Tripathi et al.
(2005a), Dubey et al. (2001), Tripathi et al.
(1998) and Shrivastava et al. (1996) (Table
6).
Chickpea yield equivalent (CYE) and land
equivalent yield (LER)
In the present investigation, the maximum
CYE and LER were recorded at 125% RDF in
247
Int.J.Curr.Microbiol.App.Sci (2019) 8(1): 236-249
Crop production technology not only be
technically feasible but it must be
economically viable, ecologically sound and
sustainable for greater benefit and adoption to
the farmers. In the present investigation,
maximum gross return, net return and B:C
ratio were recorded in 4:1 row ratio of
chickpea + mustard in both the years. These
results are in accordance with those of
Abraham et al. (2010), Kumar and Singh
(2006), Kumar et al. (2006) and Pali et al.
(2000).
Studies on sulphur levels and sources at
different fertility levels on yields and
output-input ratio of Indian mustard.
Research on Crops 3 (3): 538-541.
Dubey, M.P. (2001). Response of late-planted
linseed (Linum usitatissimum) varieties
to nitrogen levels under rain-fed
condition. Indian Journal of Agronomy
46 (3): 547-551.
Exner, D.N. and Cruse, R.M. (1993).
Interseeded forage legume potential as
winter ground cover, nitrogen source,
and competition. Journal of Production
and Agriculture, 6: 226-231.
Giller, K.E. and Cadisch, G. (1995). Future
benefits from biological nitrogen
fixation: an ecological approach to
agriculture. Plant and Soil, 174: 225277.
Giller, K.E. and Wilson, K.J. (1991). Nitrogen
fixation and tropical cropping systems.
CAB International, Wallingford, 10120.
Gokhale, D.N., Wadhvane, S.V., Kalegore,
N.K., Khalge, M.L and Shaikh, F.G.
(2008). Response of linseed varieties to
row spacing and phosphorus levels
under irrigated condition. Journal of
Oilseed Research 25 (1): 94-95.
Hossain, M.A. (2003). Management of
chickpea pod borer, (Helicoverpa
armigera) through intercropping and
insecticide spraying. Thai Journal of
Agricultural Science 36 (1): 51-56.
Karwasra, R.S and Kumar, A. (2007).
Response of raya to NPK fertilization
under rain-fed condition in Haryana.
Haryana Journal of Agronomy 23
(1/2):109-110.
Kumar, A. and Singh, B.P. (2006). Effect of
row ratio and phosphorus level on
performance of chickpea (Cicer
arietinum) + Indian mustard (Brassica
juncea) intercropping. Indian Journal of
Agronomy 51 (2): 100-102.
Kumar, G. and Nandan, R. (2007). Effect of
Thus by raising intercrops not only gives
additional yield of intercrop but higher net
return can also be generated. In the present
investigation mustard has been found to be
promising and compatible crop for
intercropping with chickpea in 4:1 row ratios,
which can increase income considerably
without any additional land.
References
Abraham, T., Sharma, U.C., Thenua, O.V.S
and Kumar, B.G.S. (2010). Effect of
levels of irrigation and fertility on yield
and economics of chickpea (Cicer
arietinum) and mustard (Brassica
juncea) under sole and intercropping
systems. Indian Journal of Agricultural
Sciences 80 (5): 372-376.
Abraham, T., Thenua, O.V.S. and Sharma,
U.C. (2011). Evaluation performance of
chickpea and mustard intercropping
system viz.-a-viz. their sole crops as
influenced by irrigation regimes and
fertility gradients. Indian Journal of
Agricultural Sciences 81 (8): 772-775.
Ahlawat, I.P.S., Gangaiah, B and Singh, O.
(2005a). Production potential of
chickpea (Cicer arietinum) based
intercropping systems under irrigated
condition. Indian Journal of Agronomy
50 (1): 27-30.
Bohra, J.S. and Srivastava, R.K. (2002).
248
Int.J.Curr.Microbiol.App.Sci (2019) 8(1): 236-249
date and pattern of planning on
productivity and economics of chickpea
+ mustard intercropping system.
Journal of food legumes 20 92): 184186.
Pali, G.P and Tripathi, R.S. (2000).
Performance of linseed varieties under
sowing and fertilizer management in
rainfed condition. Indian Journals of
Agronomy 45 (4): 771-775.
Pali, G.P., Patel, S.R. and Tripathi, R.S.
(2000). Intercropping in linseed (Linum
usitatissimum) with mustard (Brassica
juncea) under rainfed condition of
Chhattisgarh region. Indian Journal of
Agronomy 45 (3): 540-544.
Pali, G.P., Patel, S.R., Sarkar. C., and
Tripathi, R.S. (1997). Performance of
linseed (Linum usitatissimum) and gram
(Cicer arietinum) intercropping system
under rainfed condition of Chhattisgarh
region in Madhya Pradesh. Indian
Journal of Agronomy 42 (2): 244-246.
Singh, N.B and Verma, K.K. (1997).
Response of linseed to varying
irrigation and fertility levels. Indian
Journal of Agronomy 42 (4): 696-698.
Singh, R.P. and Singh, Y. (1998).
Performance of rainfed Indian mustard
varieties at varying levels of nitrogen.
Indian Journal of Agronomy 43 (4):
709-712.
Srivastava, R.K., Bohra, J.S. and Singh, R.K.
(2007).Yields advantage and reciprocity
function of Wheat + Indian mustard
intercropping under varying row ratios,
variety and fertility levels. Indian
Journals of Agricultural Sciences 77
(3):139-144.
Tanwar, S.P.S., Rokadia, P. and Singh, A.K.
(2011). Effect of row ratio and fertility
levels on chickpea (Cicer arietinum L.)
and linseed (Linum usitatissimum L.)
intercropping system. Indian Journal of
Agronomy, 56: 217-222.
Thakur, N.S., Pannase, S.K. and Sharma, R.S.
(2000). Production potential of gram
(Cicer arietinum)-based intercropping
system under rainfed condition. Indian
Journal of Agronomy 45 (3): 534-539.
Tripathi, A.K., Lal, J.P., Mishra, R.K. and
Dwivedi, R.K. (1998). Effect of fertility
levels on production and economics of
Rabi oilseed crops in dry land
conditions. Bhartia Krishi Anusandhan
Patrika 13 (3/4): 157-160.
Tripathi, H.N., Chand, S. and Tripathi, A.K.
(2005a). Biological and economical
feasibility
of
chickpea
(Cicer
arientinum) + Indian mustard (Brassica
juncea) cropping systems under varying
levels of phosphorus. Indian Journal of
Agronomy 50 (1): 31-34.
Tripathi, H.N., Chand, S., Tripathi, A.K.
(2005b). Growth and yield of Bengal
gram (Cicer arientinum) as influenced
by mustard raised as intercrop and
varying levels of phosphorus. Research
on Crops 6 (2): 205-208.
Varshney, G.J. and Arya, R.L. (2004). Effect
of integrated nutrients use and weedcontrol methods on sole gram (Cicer
arietinum) and gram + Indian mustard
(Brassica juncea) intercropping system.
Indian Journal of Agricultural Sciences
74 (3): 121-125.
How to cite this article:
Vipul Singh, Ghanshyam Singh, Vinay Kumar Pandey, Manoj Kumar and Ajay Singh. 2019.
Performance of Chickpea-Mustard Intercropping on Yield and Economics of Chickpea and
Mustard Crop under Different Fertility Management and Various Row Combinations.
Int.J.Curr.Microbiol.App.Sci. 8(01): 236-249. doi: />
249