Physiological characterization of cluster bean (Cyamopsis tetragonoloba (L.) Taub) genotypes for growth parameters
Bạn đang xem bản rút gọn của tài liệu. Xem và tải ngay bản đầy đủ của tài liệu tại đây (489.28 KB, 11 trang )
Int.J.Curr.Microbiol.App.Sci (2019) 8(3): 2329-2339
International Journal of Current Microbiology and Applied Sciences
ISSN: 2319-7706 Volume 8 Number 03 (2019)
Journal homepage:
Original Research Article
/>
Physiological Characterization of Cluster Bean
(Cyamopsis tetragonoloba (L.) Taub) Genotypes for Growth Parameters
L. Ashwini*, S. Mohankumar, B. Fakrudin, M. Shivapriya,
S. J. Prashath and Jayashree Ugalath
Department of Biotechnology and Crop Improvement, College of Horticulture, UHS Campus,
GKVK Post, Bengaluru-65, Karnataka, India
*Corresponding author
ABSTRACT
Keywords
Cluster Bean (Cyamopsis
tetragonoloba (L.) Taub),
Genotypes
Article Info
Accepted:
20 February 2019
Available Online:
10 March 2019
A field experiment was conducted during 2017-18 at College of Horticulture, Bengaluru.
The experiment was laid out in augmented block design with 72 genotypes and 3 checks.
The results revealed that there were significant differences between the genotypes for
different morpho-physiological and biochemical traits studied. Among the genotypes the
genotype COHBCBC 2 (100%), COHBCBC 16 (56.67cm), COHBCBC M5 (6.20),
COHBCBC 6S1 (338.64 cm2 plant-1), COHBCBC 15S1(280.96 cm2 g-1), COHBCBC 28
(12.32g) performed better for the traits such as germination percent, plant height, number
of branches per plant, leaf area, specific leaf area, total dry matter respectively. Genotypes
COHBCBC 10 (82.67), COHBCBC M3 (88.20), COHBCBC25 (1.45), COHBCBC 27
(64.43) found superior for biochemical traits such as stomatal frequency, Relative water
content, epicuticular wax content, SPAD values respectively. High PCV and GCV were
observed for the traits number of branches per plant, leaf area, epicuticular wax content.
Introduction
Legumes play an important role in diet and
they are often referred to as ‘Poor Man’s
Meat’. Among the legumes cluster bean
(Cyamopsis tetragonoloba (L.) Taub.) is a
self-pollinated crop with erect and bushy
annual growth habit having diploid
chromosome number 2n=14 and belongs to
family Fabaceae.
It is widely used as vegetable and commonly
known as Gaur, Guwar, Gavar and Guvar
bean.It is originated from African species
Cyamopsis senagalensis.
It is a good source of nutrition and its tender
green pods are also a economic source of
nutrients. Tender pods are nutritionally rich in
energy (16 Kcal), moisture (81 g), protein (3.2
g), fat (1.4 g), carbohydrate (10.8 g), Vitamin
A (65.3 IU), Vitamin C (49 mg), phosphorus
(57 mg), calcium (130 mg) and iron (4.5 mg)
for every 100 g of edible portion (Kumar and
Singh, 2002). A significant reduction was
noted in serum cholesterol concentration of
diabetic subjects after 15 and 30 days of
consumption of roasted and cooked guar fibre
(Soniand Rajnee, 2011). The seed of cluster
bean contains about 30-33% gum in the
endosperm
called
galactomannan.
2329
Int.J.Curr.Microbiol.App.Sci (2019) 8(3): 2329-2339
(Reference). The crop is grown especially in
the arid regions of India (Rajasthan, Haryana,
Gujarat and Punjab) for gum purpose, whereas
it is grown for vegetable purpose in other parts
of India (Rai and Dharmatti, 2013).The major
cluster bean cultivating countries are India,
Pakistan, USA, Italy, Morocco, Germany and
Spain. India produces about 80 percent of the
world cluster bean production (Tripathy and
Das, 2013).
The balanced partitioning of assimilates by the
plant into the green leaves, stem, roots
constitute a prime requirement in designing a
plant architecture for high yield. In modern
plant breeding, one of the major trends has
been supporting the traditional methods by
physio-biochemical investigation so as to
obtain better estimates of the breeding value
of the strain. So there is a need to develop
genetically diverse varieties using morpho
physiological and biochemical parameters as a
selection tool for yield maximization in cluster
bean. In this context present study has been
attempted to identify variability in terms of
morpho-physiological traits among cluster
bean genotypes.
Materials and Methods
The study was carried out in experimental
field of Department of Biotechnology and
Crop improvement, College of Horticulture,
Bengaluru, during the year 2017-18.The
experiment site is located in the agro climatic
zone-5 (Eastern dry zone) of Karnataka state.
The material used in the study consisted of 75
genotypes
(including
check
varieties
PusaNavabahar,
COHBCBC
8
and
COHBCBC 45) collected from laboratory of
Biotechnology and Crop Improvement was
evaluated in an Augmented Block Design.
After the layout preparation the genotypes and
checks were assigned to different lines in each
block by random table with a row-row and
plant- plant spacing of 45×25 cm.
Recommended basal dose of fertilisers
(25:75:60 kg NPK /ha) was incorporated into
the soil before final harrowing, remaining
fertilisers applied after 35 DAS. Five
randomly selected plants tagged for recording
different morpho- physiological traits such as
germination percent, plant height, number of
branches per plant, leaf area, specific leaf area
and total dry matter. Physio- biochemical
traits include stomatal frequency, epicuticular
wax content, relative water content and SPAD
value.
Statistical analysis
The data collected was subjected to software
the web service for Analysis of Augmented
designs (Rathore, Prasad and Gupta,
2004).Genotypic and phenotypic variations
among the characters analysed by using the
formulae given by Burton (1952) presented in
table 3. Degree of correlation among the
characters was studied in accordance with
Aljibouri et al., (1958) presented in table 4.
Results and Discussion
The maximum percent of germination was
recorded in genotype COHBCBC 2 (100%)
and minimum germination percent was
recorded in the genotype 28S4 (40%) table 2.
This might be due to the better utilisation of
seed
reserve
substances
for
good
establishment (Adat et al., 2011). Plant height
varied significantly among the varieties at 90
DAS (Table 2). The maximum plant height
was observed in the genotype COHBCBC 16
(56.67cm) significantly superior compared to
all other genotypes. The minimum plant
height is observed in the genotype 28S3
(18.89 cm) variations for plant height is a
genotypic character and increased synthesis of
carbohydrates,
amino
acids
and
phytohormones like auxins synthesis leads to
good plant growth. Variability for plant height
has been previously reported by Reddy et al.,
2330
Int.J.Curr.Microbiol.App.Sci (2019) 8(3): 2329-2339
(2017) and Satyavathi et al., (2014) in cluster
bean.
Among the genotypes, COHBCBC M5 (6.20)
recorded significantly more number of
branches followed by COHBCBC 24 (5.80)
and COHBCBC 25 (5.80). There were no
primary branches observed in PusaNavabahar
(check), genotypes COHBCBC 2, COHBCBC
5, COHBCBC 7, COHBCBC 10, COHBCBC
16, COHBCBC 21, COHBCBC 27,
COHBCBC 28, COHBCBC 36, COHBCBC
39, COHBCB 40, COHBCBC 6S2,
COHBCBC 21 S2, COHBCBC 28 S4,
COHBCBC 31S1, COHBCBC 2 S1,
COHBCBC 5S1 and COHBCBC 28 S2.
Whereas the genotype COHBCBC 3 S1 (3.2)
produced minimum number of branches per
plant (Table 2). This might be due to reduced
level of synthesis of phytohormones like
auxins and proliferation of lateral buds which
provides better plant architecture. Similar
findings were reported by Ansari et al., (2017)
and Reddy et al., (2017) in cluster bean. Leaf
area determines the light interception and
co2assimilation capacity of a plant. Highest
leaf area was recorded in the genotype
COHBCBC6S1 (338.64) followed by
COHBCBC M5 (329.59), lowest was found in
COHBCBC M8 (121.59) followed by
COHBCBC M12 (138.06) (Table 2).
Variations for leaf area is might be a varietal
character often leads to better canopy
management.
Correspondingly variability for leaf area was
noticed previously by Shilpa et al., (2017) in
cluster bean and Ahmed et al., (2011) in mung
bean. Highest Specific leaf area (SLA) was
recorded in COHBCBC15-S1 (280.96) the
least SLA was recorded in the genotype
COHBCBC 29 (141.72) followed by
COHBCBC 42 (150.16) (Table 2). This might
be due to genetic nature of plant or
environmental conditions. Similar findings
have been reported earlier by Satyavathi et al.,
(2014) and Sinha et al., (2018). Genotypes
varied significantly for total dry matter. The
genotypes COHBCBC 28 (12.32) and
COHBCBC 19 (12.31) were on par with each
other and accumulated maximum dry matter
content whereas the genotype COHBCBC 15S1(5.40) recorded minimum total dry matter
content followed by COHBCBC-14(5.51),
COHBCBC43 (5.64) were at on par with each
other (Table 2). Dry matter content is a
chemical potential of the crop and reflects its
true biological yield. These results are in
conformity with results of Ansari et al., (2017)
and Ashok and Bajpai (1979).
The results on biochemical and physiological
parameters viz., stomatal frequency, relative
water content, epicuticular wax content,
SPAD values differed significantly among the
genotypes (Table 2).
The genotype COHBCBC-10 (82.67) revealed
maximum number of stomata on abaxial
surface. Whereas the genotype COHBCBC
43(36.00) showed minimum stomatal number
(Table 2).As stomata are associated with
transpiration and photosynthesis and its
regulation is controlled by stomatal frequency,
reduced stomatal density leads to reduced
photosynthetic rate and lower yields of plants
on the contrary high stomatal frequency were
able to take advantage of increased water and
co2supplyby
increasing
transpiration,
photosynthetic rate and yield Buttery et al.,
(1993).The maximum relative water content
was noticed in COHBCBC M3 (88.20).
Whereas the genotype COHBCBC 13 (60.13)
recorded minimum relative water content
(Table 2). RWC is a robust indicator of water
status of a plant (Lawlor and Cornic, 2002)
hence the genotype performed better may have
better water holding capacity. Corresponding
results were noticed earlier by Manzer et al.,
(2015) in fababean. The genotype COHBCBC
25(1.45) recorded maximum epicuticular wax
content.
2331
Int.J.Curr.Microbiol.App.Sci (2019) 8(3): 2329-2339
Table.1 Genotypic variations among the cluster bean genotypes for
Morpho-physiological parameters
Sl.
No.
1
2
3
4
5
6
7
8
9
10
11
12
13
14
15
16
17
18
19
20
21
22
23
24
25
26
27
28
29
30
31
32
33
34
35
36
37
38
Genotypes
COHBCBC 1
COHBCBC 2
COHBCBC 4
COHBCBC 5
COHBCBC 6
COHBCBC 7
COHBCBC10
COHBCBC 11
COHBCBC 13
COHBCBC 14
COHBCBC 16
COHBCBC 17
COHBCBC 18
COHBCBC 19
COHBCBC 21
COHBCBC 22
COHBCBC 23
COHBCBC 24
COHBCBC 25
COHBCBC 26
COHBCBC 27
COHBCBC 28
COHBCBC 29
COHBCBC 30
COHBCBC 31
COHBCBC 32
COHBCBC 33
COHBCBC 34
COHBCBC 35
COHBCBC 36
COHBCBC 37
COHBCBC 38
COHBCBC 39
COHBCBC 40
COHBCBC 41
COHBCBC 42
COHBCBC 43
COHBCBC 44
Germination Plant
percent (%) height
(cm)
60.00 43.64
100.00 43.97
73.33 37.31
60.00 35.78
46.67 44.17
66.67 47.22
66.67 43.61
46.67 45.83
46.67 47.22
60.60 50.00
60.60 56.67
80.60 53.33
73.33 45.31
66.67 40.58
73.33 39.75
66.67 40.14
60.00 40.97
80.00 42.78
80.00 44.44
53.33 46.39
66.67 52.50
80.00 53.33
86.67 51.39
93.33 45.83
80.00 38.33
53.33 36.94
93.33 36.11
66.67 39.72
73.33 37.28
93.33 33.14
86.67 35.64
53.33 37.81
80.00 40.00
60.00 42.78
53.33 30.00
60.00 21.94
66.67 28.61
60.00 33.33
2332
Number
of branches
/ plant
4.40
0.00
5.40
0.00
4.60
0.00
0.00
5.00
5.20
4.60
0.00
4.20
4.40
4.80
0.00
5.00
4.80
5.80
5.80
4.80
0.00
0.00
4.20
4.80
5.60
4.40
3.40
4.20
4.80
0.00
4.20
4.40
0.00
0.00
4.20
4.40
3.40
4.40
Leaf area
Specific
(cm2/
leaf area
plant)
(cm2/ plant)
155.36
176.54
165.89
211.32
179.24
229.76
196.34
194.93
223.21
199.64
187.86
243.19
143.25
197.69
179.43
228.30
195.05
221.54
184.14
215.37
172.24
230.87
166.87
160.25
147.49
180.80
309.69
152.14
193.22
207.83
283.33
206.19
183.38
223.82
277.39
210.41
258.40
184.89
183.08
197.70
185.73
222.76
318.05
181.81
182.94
141.72
198.02
210.41
170.76
247.29
158.13
177.47
171.08
236.54
270.54
175.27
196.88
211.32
212.76
243.59
163.74
190.71
186.88
211.81
274.64
172.39
279.07
203.83
308.32
188.67
199.64
150.16
181.07
213.29
184.26
225.58
Total dry
matter
(g)
9.57
9.77
10.59
9.48
7.16
6.14
6.34
8.40
8.30
5.51
8.26
9.89
8.26
12.31
8.99
11.05
6.90
12.05
12.17
10.75
10.40
12.32
8.08
9.31
9.79
8.08
8.28
11.48
11.32
7.64
7.93
8.22
8.71
10.72
9.55
10.14
5.64
9.79
Int.J.Curr.Microbiol.App.Sci (2019) 8(3): 2329-2339
39
40
41
42
43
44
45
46
47
48
49
50
51
52
53
54
55
56
57
58
59
60
61
62
63
64
65
66
67
68
69
70
71
72
73
74
75
COHBCBC 6-S2
COHBCBC 3
COHBCBC 9
COHBCBC 20
COHBCBC M3
COHBCBC M5
COHBCBC M6
COHBCBC M8
COHBCBC M11
COHBCBC M12
COHBCBC M13
COHBCBC M15
COHBCBC 21-S2
COHBCBC 28-S3
COHBCBC 3-S1
COHBCBC 18-1
COHBCBC 15-S2
COHBCBC 28-S4
COHBCBC 22-S1
COHBCBC 33-S1
COHBCBC 15-S1
COHBCBC 4-S1
COHBCBC 4-S2
COHBCBC 12-S1
COHBCBC 31-S1
COHBCBC 2-S1
COHBCBC 5-S1
COHBCBC 28-S2
COHBCBC 14-S2
COHBCBC 20-S1
COHBCBC 24-S3
COHBCBC 16-S2
COHBCBC 6-S1
COHBCBC 45-S1
COHBCBC-8
COHBCBC-45
PusaNavabahar
Mean
SE
Test treatment not
d±
in the same block
CD
Test treatment not
@5% in the same block
66.67
53.33
80.00
53.33
86.67
93.33
93.33
93.33
66.67
93.33
73.33
73.33
66.67
66.67
86.67
73.33
66.67
40.00
60.00
60.00
53.33
53.33
73.33
66.67
80.00
53.33
66.67
53.33
53.33
60.00
80.00
80.00
53.33
60.00
89.52
93.31
92.19
73.33
2.5
49.17
48.06
32.22
34.17
30.83
25.83
36.94
42.22
48.61
41.25
33.75
34.86
22.64
18.89
33.19
33.33
33.06
29.31
25.28
30.14
28.75
31.97
25.72
23.92
28.10
27.30
29.83
30.53
28.39
23.83
32.53
40.08
37.31
23.67
40.42
42.63
47.88
38.93
6.2
0.00
4.20
4.00
4.00
4.60
6.20
4.60
4.80
4.20
4.20
3.40
4.80
0.00
4.20
3.20
4.80
3.60
0.00
3.80
3.80
4.20
4.40
4.80
3.60
0.00
0.00
0.00
0.00
4.20
3.60
3.40
4.80
4.80
4.20
4.83
4.69
0.00
3.30
0.38
180.66
186.24
144.88
188.87
287.93
329.59
195.96
121.59
200.73
138.06
178.31
195.25
206.51
197.91
193.54
154.37
242.38
199.83
189.93
162.86
156.22
171.86
210.08
160.88
181.90
192.46
156.19
185.19
194.15
159.56
242.56
291.98
338.64
143.25
183.98
188.80
170.70
197.29
12.3
210.91
213.52
242.02
204.61
181.46
174.73
215.48
271.42
194.40
208.81
213.47
200.07
195.79
182.36
208.00
223.48
260.71
197.33
199.32
214.93
280.96
215.08
204.51
193.14
256.56
197.97
202.99
234.01
210.68
190.97
168.31
162.87
169.93
182.82
197.20
203.08
153.34
201.5
5.4
7.79
8.95
7.40
6.31
10.50
10.76
6.61
7.27
8.18
7.18
6.23
9.08
9.13
9.08
6.87
6.85
7.42
8.19
7.01
8.03
5.40
6.46
8.11
8.72
7.29
8.59
5.99
7.60
5.91
9.07
10.86
9.30
10.86
9.95
8.75
10.04
11.34
3.30
3.5
5.6
13.8
0.86
27.3
12.0
1.14
2333
Int.J.Curr.Microbiol.App.Sci (2019) 8(3): 2329-2339
Table.2 Genotypic variations among the cluster bean genotypes for biochemical and
physiological parameters
Sl. No.
1
2
3
4
5
6
7
8
9
10
11
12
13
14
15
16
17
18
19
20
21
22
23
24
25
26
27
28
29
30
31
32
33
34
35
36
37
38
Genotypes
COHBCBC 1
COHBCBC 2
COHBCBC 4
COHBCBC 5
COHBCBC 6
COHBCBC 7
COHBCBC10
COHBCBC 11
COHBCBC 13
COHBCBC 14
COHBCBC 16
COHBCBC 17
COHBCBC 18
COHBCBC 19
COHBCBC 21
COHBCBC 22
COHBCBC 23
COHBCBC 24
COHBCBC 25
COHBCBC 26
COHBCBC 27
COHBCBC 28
COHBCBC 29
COHBCBC 30
COHBCBC 31
COHBCBC 32
COHBCBC 33
COHBCBC 34
COHBCBC 35
COHBCBC 36
COHBCBC 37
COHBCBC 38
COHBCBC 39
COHBCBC 40
COHBCBC 41
COHBCBC 42
COHBCBC 43
COHBCBC 44
Stomatal
frequency
(number/ mm2)
48.33
52.33
50.67
78.00
55.67
74.33
82.67
54.33
60.00
55.33
52.33
55.67
56.00
50.33
71.67
46.67
64.00
45.67
41.67
46.00
45.33
37.00
56.67
56.33
49.33
53.33
46.67
41.33
45.33
37.00
41.33
53.67
54.00
54.00
55.00
48.00
36.00
40.33
2334
Relative
water
content (%)
72.94
76.49
86.57
83.24
62.35
75.10
78.16
67.90
60.13
62.15
61.68
69.46
84.10
78.89
85.69
87.15
85.61
85.13
84.70
80.09
87.44
79.35
71.05
83.04
84.41
79.80
73.81
86.45
85.73
75.11
77.85
82.39
74.22
75.19
72.06
80.13
76.92
80.51
SPAD
values
59.53
63.37
54.17
59.73
57.70
59.30
59.47
59.90
60.40
60.77
44.33
63.23
53.03
62.43
60.10
61.90
62.50
54.77
60.60
61.50
64.43
57.57
60.53
58.30
59.20
57.40
60.50
56.83
60.13
57.70
51.97
58.83
64.17
52.90
59.17
57.97
54.73
61.07
Epicuticular
wax content
(mg /cm2)
0.50
0.67
0.52
0.80
0.55
0.64
0.54
0.65
1.09
0.93
0.63
0.49
0.48
0.41
1.01
0.72
0.65
0.92
1.45
0.47
0.55
0.66
0.70
0.71
0.78
1.05
0.35
0.70
1.14
0.75
1.19
1.24
0.51
0.71
0.98
0.68
0.41
0.42
Int.J.Curr.Microbiol.App.Sci (2019) 8(3): 2329-2339
39
40
41
42
43
44
45
46
47
48
49
50
51
52
53
54
55
56
57
58
59
60
61
62
63
64
65
66
67
68
69
70
71
72
73
74
75
Mean
SE d±
CD
@5%
COHBCBC 6-S2
COHBCBC 3
COHBCBC 9
COHBCBC 20
COHBCBC M3
COHBCBC M5
COHBCBC M6
COHBCBC M8
COHBCBC M11
COHBCBC M12
COHBCBC M13
COHBCBC M15
COHBCBC 21-S2
COHBCBC 28-S3
COHBCBC 3-S1
COHBCBC 18-1
COHBCBC 15-S2
COHBCBC 28-S4
COHBCBC 22-S1
COHBCBC 33-S1
COHBCBC 15-S1
COHBCBC 4-S1
COHBCBC 4-S2
COHBCBC 12-S1
COHBCBC 31-S1
COHBCBC 2-S1
COHBCBC 5-S1
COHBCBC 28-S2
COHBCBC 14-S2
COHBCBC 20-S1
COHBCBC 24-S3
COHBCBC 16-S2
COHBCBC 6-S1
COHBCBC 45-S1
COHBCBC-8
COHBCBC-45
PusaNavabahar
Test treatment not in the
same block
Test treatment not in the
same block
45.00
44.00
51.00
54.33
52.67
74.33
61.00
57.67
58.00
41.67
64.33
66.00
61.67
55.00
45.00
49.67
45.67
40.67
49.67
36.33
48.33
57.33
50.33
37.67
39.00
56.00
67.33
44.67
59.33
47.33
44.33
50.00
54.00
55.00
48.43
50.31
62.58
52.45
2.60
87.09
68.54
80.92
68.50
88.20
80.98
81.05
80.98
87.16
81.54
86.41
73.64
74.79
75.20
75.43
79.12
78.44
76.95
72.10
78.42
77.50
73.30
82.47
87.56
84.83
83.20
85.41
81.70
83.88
70.80
65.79
69.43
83.76
77.70
76.04
80.53
86.21
78.82
4.4
56.47
56.43
59.07
40.47
59.60
62.73
57.13
63.13
56.97
44.47
40.70
55.57
50.40
53.17
51.63
61.33
53.70
60.63
60.40
59.83
60.30
51.07
53.07
61.13
52.07
52.80
55.13
56.63
59.37
52.40
58.17
60.50
51.37
59.50
60.93
56.66
60.34
57.65
2.40
0.45
0.53
0.35
0.66
0.38
0.32
0.47
0.65
0.57
0.42
0.67
1.18
0.91
1.11
1.11
1.11
0.95
1.05
0.60
1.08
0.87
1.07
1.02
1.12
1.17
0.82
0.96
0.76
1.18
0.66
1.11
0.64
0.45
0.90
1.20
0.99
1.10
0.83
5.3
5.80
9.9
0.16
0.36
*40x microscope field having an area of 0.159 mm2
2335
Int.J.Curr.Microbiol.App.Sci (2019) 8(3): 2329-2339
Table.3 Estimates of variability for morpho-physiological traits among cluster bean genotypes
Traits
Mean
Range
Min. Max.
PCV
(%)
GCV
(%)
h2
Germination percent (%)
Plant height (cm)
No. of branches/ plant
Leaf area (cm2 /plant)
Specific leaf area (cm2/ plant)
Total dry matter (g /plant)
Stomatal frequency (number/ mm2)
Relative water content (%)
Epicuticular wax content (mg/ cm2)
SPAD values
73.33
38.93
3.30
197.29
201.05
8.90
52.45
78.82
0.83
57.65
40.00 60.00
18.89 60.00
0.00
6.20
121.5 338.6
141.7 280.95
5.40 12.69
36.0
82.6
60.13 89.28
0.32
1.45
40.46 64.43
19.18
5.89
60.98
25.22
13.59
19.94
9.61
8.84
33.39
8.74
16.47
5.33
60.53
24.93
13.49
16.85
9.13
8.14
30.42
8.36
73.71
84.21
98.51
97.73
98.53
71.42
90.17
84.77
80.09
91.54
GA as
% of
mean
40.53
14.55
42.50
52.45
28.49
49.10
21.53
19.29
166.0
19.60
h2 - Broad sense heritability, GAM - Genetic advance as per cent of mean, GCV - Genotypic co-efficient of
variation, PCV - Phenotypic co-efficient of variation
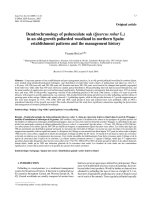
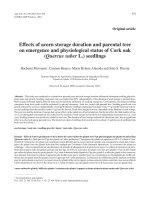
Fig.1 Genotypic and phenotypic variability for morpho physiological and biochemical
parameters in cluster bean genotypes
X1 : Germination %
X5:
Specific
leaf
area X9: Epicuticular wax content (mg
(cm2/gram)
/cm2)
X6 : Total dry matter (g /plant)
X10 : SPAD value
X2 : Plant height (cm)
X3 : Number of branches / X7: Stomatal frequency (number
/mm2)
plant
2
X8: Relative water content (%)
X4 : Leaf area (cm / plant)
2336
Int.J.Curr.Microbiol.App.Sci (2019) 8(3): 2329-2339
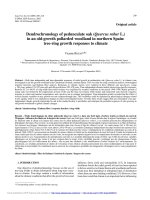
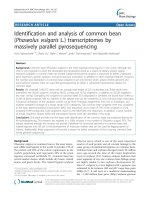
Fig.2 Heritability estimates and genetic advance over percent mean for morpho - physiological
and biochemical parameters in cluster bean genotypes
X1 : Germination %
X5:
Specific
leaf
area X9: Epicuticular wax content (mg
2
(cm /gram)
/cm2)
X6 : Total dry matter (g /plant)
X10 : SPAD value
X2 : Plant height (cm)
X3 : Number of branches / X7: Stomatal frequency (number
/mm2)
plant
X8: Relative water content (%)
X4 : Leaf area (cm2 / plant)
The minimum wax content was noticed in the
genotypes
COHBCBC
M5
(0.32),
COHBCBC-33(0.35) and COHBCBC-9(0.35)
were at on par with each other (Table 2). This
might be due to genotype have efficiency to
synthesise wax content to control loss of
water from epicuticular tissues. Similar
results were reported earlier by Jayant et al.,
2015 in peanut genotypes. The highest SPAD
value was recorded in the genotype
COHBCBC-27
(64.43)
followed
by
COHBCBC 39 (64.17), COHBCBC 2(63.37)
and were on par with each other. The least
SPAD value was observed in the genotype
COHBCBC-20
(40.47)
followed
by
COHBCBC M13 (40.70) (Table 2).This
might be due to genetic ability of a genotype
to synthesise increased amount chlorophyll
pigment. Thakur et al., (2016) and Kashiwagi
et al., (2010) noticed similar findings in
cluster bean and chickpea genotypes.
Estimates of variance
The genetic parameters viz., genotypic and
phenotypic
coefficient
of
variation,
heritability in broad sense and genetic
advance along with the mean were analysed
and presented in table 3 and figure 1 and 2.
High GCV and PCV values were recorded for
traits like number of branches per plant (PCV
= 60.98, GCV = 60.53), leaf area (PCV =
25.22, GCV = 24.93), epicuticular wax
content (PCV = 33.39, GCV = 30.42) these
results are in confirmation with earlier reports
of Patil, 2014. Narrow differences between
GCV and PCV indicate that these traits were
less influenced by environment. A high value
2337
Int.J.Curr.Microbiol.App.Sci (2019) 8(3): 2329-2339
for GCV over PCV suggests that there is
possibility of improvement through direct
selection for these traits. Based on the above
results the traits like number of branches per
plant, leaf area, epicuticular wax content
selection based on these traits have ample
scope for direct selection.
Heritability estimates were high for all the
characters studied. Similar results were
obtained in previous study (Patil, 2014;
Jithendar et al.,). It indicates characters are
least influenced by the environment.
Relatively high genetic advance as percent of
mean was noticed for trait epicuticular wax
content these results are similar to results of
previous study Galeano et al., 1985. High
heritability combined with high genetic
advance as percent mean is indicative of
additive gene action and selection based on
these traits would be beneficial.
From the findings of the present studies, we
conclude that genotypic variations among the
genotypes due to their differential responses
for morpho-physiological and biochemical
characteristics. The data obtained from this
study identified several better performing
cluster bean genotypes compared to check
varieties and these could likely utilised in
further breeding programme
References
Adat, S. S., Chavan, A. B., Sawashe, A. Y.,
Sonavane, P. N. and Chalke, P. R.,
2011, Studies on growth parameters of
cluster bean (Cyamopsis tetragonoloba)
varieties under Marathwada condition.
Green farming. 2(6): 684-685.
Ahamad, M. A., Kalsoom, A., Sarwao, G. and
Ashraf, M., 2011, Evaluation of
varieties of greengram at varied plant
densities. Bangladesh J. Agri., pp: 473482.
Ansari, Z. G., Rao, R., Vasht, D., Sreelatha,
P. and Aparna, K., 2017, Evaluation of
morpho-physiological traits at various
growth stages and its correlation with
seed yield in guar gum genotypes. Int. J.
Chemi. Studies. 5(6): 909-912
Ashok, C., and Bajpai, M. R., 1979, A note on
the response of rainfed guar to
phosphorus and nitrogen. Ann. Arid
Zone. 18(4): 272-73.
Buttery, B.R., Tan C. S., Buzzel, R. I.,
Gaynor, J. D. and Mactavish. D. C.,
1993, Stomatal numbers of soyabean
and response to water stress. J. Plant.
Soil., 149(2):283-288.
Galeano, R., Rambaugh, M.D., Johnson, D.
A., and Bushnell, J. L, 1985, Variation
in epicuticular wax content of alfalfa
cultivars and clones. Crop Sci., 26(4):
703-706.
Jayant, K. S. and Sarangi, S. K., 2015, Effect
of drought stress on epicuticular wax
load in peanut genotypes. J. Appl. Bio.
Biotech., 3 (4): 046-048.
Jithendar, S. K., Pahuja, Varma, N., and
Bhusal, N., 2014, Genetic variability
and heritability for seed yield and water
use efficiency related characters in
cluster bean (Cyamopsis tetragonoloba
(L.) Taub). Forage Res., 39 (4): 170174.
Kashiwagi, J., Hari D., Upadhyayaand
Krishnamurthy, L.,2010, Significance
and genetic diversity of SPAD
chlorophyll meter reading (SCMR) in
the chickpea (Cicer arietinum L.)
germplasm
in
the
semiarid
environments. J. Food Leg. 23(2): 99105.
Lawlor, D. W. and Cornic, G., 2002.
Photosynthetic carbon assimilation and
associated metabolisnm in relation to
water deficits in higher plants.Pl. Cell
Envt., 25:275-294.
Manzer, H. S., Muthahar Y., Al- Khaishany.,
Mohammed, A., Mohammed. H.,
2338
Int.J.Curr.Microbiol.App.Sci (2019) 8(3): 2329-2339
Grover, A., Hayssam, M., Mona, S. and
Najat, A., 2015, Response of different
genotypes of French bean plant to
drought stress. Int. J. Mol. Sci.,
16:10214-10227.
Patil, D.V., Genetic variability and sowing
dates effect of cluster bean (Cyamopsis
tetragonoloba (L.) Taub) genotypes in
semi-arid region of Maharashtra. Plant
archives 14(1): 1-6.
Rai, P. S., Dharmatti, P. R., Shashidhar, T. R.,
Patil, R. V. and Patil, B. R., 2012,
Genetic variability studies in cluster
bean [Cyamopsis tetragonoloba (L.)
Taub]. Karnataka J. Agric. Sci., 25(1):
108-111.
Reddy, D. R., Saidaiah, P., Ravinder, R. K.
and Pandravada, S. R., 2017, Mean
performance of cluster bean genotypes
for yield, yield parameters and quality
traits. Int. J. Current Mic. and Appl.
Sci., 6(9): 3685-3693.
Satyavathi, P. M., Vanaja, A. G. K., Reddy,
P., Vagheera, A. N., Reddy, G. V.,
Kumar, A., Razak, S., Vaidya, P. S. and
Khan, I., 2014, Identification of suitable
guar genotypes for summer season of
semi-arid region. Int. J. Appl. Biol.
Pharm. Technol., 5(4): 71-73.
Shi1pa, V. C. and Chandranath, H. T., 2017,
Dry matter production and partitioning
of
clusterbean
(Cyamopsis
tetragonoloba (L.) taub) genotypes
(gum) as influenced by plant density
and bio inoculants. Int. J. Curr.
Microbio. App. Sci., 6(12): 1797-1803.
Sinha, T., Mondal, S. and Hembramm. S. K.,
2018,
Evaluation
of
Chickpea
Genotypes on the Basis of their
Physiological Growth Parameters. Int.
J. Curr. Microbiol. App. Sci 7: 38883895.
Thakur, K., Katiyar, P. and Ramteke, V.,
2016, Physiological and growth
response of clusterbean [Cyamopsis
tetragonoloba (L.) Taub.] varieties to
different growing seasons. J. Envir. Sci.,
9:651-657.
Tripathy, S. and Das, M. K., 2013, Guar gum:
present status and applications. J.
Pharm. Scientific Innov., 2:24 -28.
How to cite this article:
Ashwini L., S. Mohankumar, B. Fakrudin, M. Shivapriya, S. J. Prashath and Jayashree Ugalath.
2019. Physiological Characterisation of Cluster Bean (Cyamopsis tetragonoloba (L.) Taub)
Genotypes for Growth Parameters. Int.J.Curr.Microbiol.App.Sci. 8(03): 2329-2339.
doi: />
2339