Optimization of composite protein- lipid film by ohmic heating using mixture design
Bạn đang xem bản rút gọn của tài liệu. Xem và tải ngay bản đầy đủ của tài liệu tại đây (671.59 KB, 12 trang )
Int.J.Curr.Microbiol.App.Sci (2019) 8(3): 230-241
International Journal of Current Microbiology and Applied Sciences
ISSN: 2319-7706 Volume 8 Number 03 (2019)
Journal homepage:
Original Research Article
/>
Optimization of Composite Protein- Lipid Film by
Ohmic Heating using Mixture Design
V. Ajesh Kumar1*, M. Pravitha1 and Akash Pare2
1
ICAR-Central Institute of Agricultural Engineering, Bhopal, India
Indian Institute of Food Processing Technology, Thanjavur, India
2
*Corresponding author
ABSTRACT
Keywords
Protein lipid film,
Soybean, Ohmic
heating. Mixture
design
Article Info
Accepted:
04 February 2019
Available Online:
10 March 2019
Protein-lipid film is a very popular food material which can be prepared from various
protein foods. A remarkable example of the protein-lipid film is a traditional soybean food
which is a cream-yellow bland flavoured surface film of high nutritional value (soy
protein-lipid film, designated as Yuba or soymilk skin), which is formed during the heating
of soymilk. The protein digestion rate of the protein-lipid film is almost 100%.The
objective of this study was to optimize the production of the composite protein lipid film
using ohmic heating method, which has a significant effect on the quality of film produced
over the conventional water bath heating, from blends of soy milk, peanut milk and fresh
corn milk according to D-optimal mixture design approach. Results demonstrated that soy
milk, peanut milk and fresh corn milk had noticeable effect on yield and protein content of
the film. Multi-response optimization using all of the regression models was performed
with the Design-Expert software, using its defaults settings to construct a desirability score
that balances all of the fitted models. The methodology of the desired function was applied
and the optimum level of various process variables was obtained as, Soy milk 0.57 Peanut
milk 0.4 and corn milk 0.03, which gives the maximum of 21.44 g/100ml yield and
56.83% protein content with overall desirability value of 0.81.Other responses like colour,
rehydration capacity and thickness of the film found to have no significant effect with the
different milk formulations
Introduction
Edible films can be used for versatile food
products to reduce loss of moisture, restrict
absorption of oxygen, lessen migration of
lipids,
improve
mechanical
handling
properties, provide physical protection, and/or
offer an alternative to the commercial
packaging materials. The films can enhance
the organoleptic properties of packaged foods
provided that various components (such as
flavourings, colourings and sweeteners) are
used. The films can function as carriers for
antimicrobial
and
antioxidant
agents
(Bourtoom, 2009). The films can also be used
for individual packaging of small portions of
food, particularly products that are currently
not individually packaged for practical
reasons. These include pears, beans, nuts and
strawberries. In a similar application they
230
Int.J.Curr.Microbiol.App.Sci (2019) 8(3): 230-241
also can be used at the surface of food to
control the diffusion rate of preservative
substances from the surface to the interior of
the food. When soymilk is heated in flat,
shallow, open pans at about 90ºC, a creamyellow, bland flavoured surface film
gradually forms. The films, which is also
known as Yuba, are successively removed
from the surface, hung to air dry and
marketed or stored as dried sheets, sticks
and chips, or further fabricated into
texturized food products. The films can be
consumed directly as an ingredient of soups
or used as a sheet for wrapping and shaping
ground meats or vegetables into various
forms. The protein digestion rate of proteinlipid film is almost 100%. Protein-lipid film
is a very popular food material in China as
well as Japan. The yield per year in China
was over 200,000 tons at the end of 20th
century. The formation mechanism of proteinlipid film is entirely different from that of
tofu which is another traditional soybean
food.
protein- lipid film formation. It has also been
widely suggested that protein creates a
framework in the protein-lipid film structure,
while lipids are dispersed in it as droplets.
The concentration of protein lipid film in
the soy milk which is ultimately depends
on the soybean cultivar has dependence on
the productivity of protein–lipid film
formation (Enujiugha, 2013). Various reports
have shown the effect of protein and lipid
contents on the productivity of protein-lipid
film. Wu and Bates (1972) observed that
poor productivity of protein lipid film
occurred in systems with low protein-lipid
ratio under 1.00. The suitability of soybean
cultivars for protein- lipid film production is
still not clear. Soybeans with high protein
content are selected generally selected for
tofu production. However, since the
formation mechanism of protein-lipid film is
different from that of tofu, there may be
some other factors than protein content
which are dominant in protein-lipid film
productivity.
Tofu is a kind of gel formed by the
addition of solidification reagents such as
CaCO3 and is mainly composed of protein,
lipid and water. On the other hand, proteinlipid film is formed as a result of endothermic
polymerization of heat denatured proteins or
lipoprotein monomers at the liquid surface
promoted by surface dehydration. Heating of
soymilk leads to a change in the threedimensional structure of proteins and
results in exposing sulphydryl groups and
hydrophobic side chains. In tofu processing,
proteins create a framework, while lipid and
water are buried in networks. Therefore, high
protein concentration is beneficial for tofu gel
formation. During the film formation of
Yuba, lipid acts as a surfactant which
moves to the air/water interface and interacts
with proteins by hydrophobic interactions.
Furthermore, some of the lipids can be buried
in a protein network structure during the
In view of the potential value of proteinlipid films for both their structural and
nutritional properties and the ease with which
such films can be formed from dilute
aqueous protein-lipid dispersions, it was
deemed worthwhile to investigate a few of
the numerous protein sources presently
receiving considerable attention. In this
study of film formation employing various
agricultural and industrial protein and lipid
ingredients, designed to establish conditions
and blends for maximal yield and protein
recovery, with desirable quality attribute like
colour and thickness.
Wu et al., (1973) conducted a film formation
studies employing several agricultural and
industrial protein and lipid ingredients,
designed to establish conditions and blends
for maximal protein recovery, film formation
rate and mechanical strength. Oilseeds such
231
Int.J.Curr.Microbiol.App.Sci (2019) 8(3): 230-241
as peanuts and cottonseed are useful proteinlipid film ingredients; particularly in the high
lipid content is reduced by oil recovery or
improved by adding functional protein from
soy, whey or casein derivatives. These films
can be used as substitute to meat. Wu et al.,
(1975) conducted a study to create proteinlipid film as a substitute to meat, the sheets
are soaked inappropriate flavouring solutions
such as soy or meat broths, layered several
sheets thick, rolled tightly, wrapped firmly in
cloth, and tied to retain internal pressure. The
rolls are then steamed for about 1 hr and
consumed as a main dish. An alternate
texturization process involves placing layers
of moist, flavoured films in aluminium
moulds shaped like whole chicken or fish.
The centre of the mould may be stuffed
with film remnants, or fitted with a wooden
plug, thus providing a hollow space for
subsequent stuffing ingredients. The mould
is closed and manual pressure applied,
resulting in a firm meat-like texture of
desired shape. Although they employ low-cost
raw materials, extensive hand labour is
required. Consequently, such fabrication
techniques are not conducive to the
production of uniform quality, high volume
food materials.
PIE by ohmic heating was higher than those
by water bath heating. Also film formation
rate and rehydration capacity of protein–lipid
film was increased by ohmic heating (Lei et
al., 2007)
The protein lipid film prepared from soy
bean doesn’t contain all the essential amino
acids. Several combinations of protein sources
can be blended in different proportions to
develop a new product with altered
characteristics and enhanced nutritional
profile. So in order to enrich the protein lipid
film, we considered protein sources like
peanut and maize with soybean for developing
composite protein-lipid films. In other way
the extraction of protein component from
sources like maize are difficult. So the method
of surface film formation will enable us to
extract the protein from the same. Considering
all the facts discussed above and pointing out
the necessity of developing a protein rich
blended film, the main objective of this study
has been selected as production of composite
protein-lipid film from soy-peanut - corn milk
blend using ohmic heating method.
Materials and Methods
Materials
Ohmic heating is a new method used for the
production of protein–lipid film. The
conventional heating method of producing
protein–lipid film is water bath heating, in
which it is difficult to control the heating
temperature. Moreover, it is difficult to heat
soybean milk evenly and the yield and
quality of protein– lipid film are affected
heavily. These problems can be addressed
using ohmic heating method which ensures
uniform
heating
and
control
over
temperature. The ohmic heating method has
significant effect on yields, film formation
rates, PIE, whiteness and rehydration
capacities of protein–lipid films compared to
conventional water bath heating. Yield and
Soybean (Glicene max(L)), CO-1 variety,
Peanut and fresh Corn were procured from the
local market of Thanjavur and were kept at
cold (4-8oC) storage until used for the
extraction of milk. The moisture content of the
soybean and peanut determined by hot air
oven method were 14.5% and 8 %
respectively.
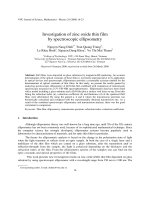
Ohmic heating Setup
Ohmic heating set up present in the
Incubation centre of IICPT (Fig. 1) has been
used for this study. It consist of power
supply (generator) for producing electricity,
232
Int.J.Curr.Microbiol.App.Sci (2019) 8(3): 230-241
electrodes connected to power supply system
which facilitate the electric current to pass
through the food material. It also has the
facility to change the electric field strength
(V/cm) and frequency. The temperature of the
system can also be measured using
thermocouples provided.
1 min before being taken down from the rod.
Every sheet of film was numbered according
to the sequence of removal.
The laboratory scale ohmic heating tray, with
a capacity of 500ml (Fig. 2) is used for
heating the milk blends. It is made of acrylic
sheet of 6 mm thickness.
Total soluble solids (TSS) of the mixture
was determined using a digital refractometer,
(Model: RX-7000; Make: Atago, Japan)
which has an accuracy of ±0.000010 nD and
±0.005. °Brix. Few drops of the sample were
placed on the sample slot of refractometer
and the TSS of the sample was recorded and
expressed in ˚Brix. Refractive index (nD)
and brix varies in the range of 1.32422 to
1.70000 and 0.00 to 100.00% respectively.
Sample preparation
Soymilk extraction plant installed at IICPT
Thanjavur was used for the extraction milk
by following the standard operating
procedures of the plant. Definite amount of
soy bean, peanut and fresh corn were cleaned
and soaked in 4 times of tap water for 12
hours at 4ºC. This soaked sample were
grinded and filtered using soy milk extraction
plant. The Soluble solid content of the
milks
were
measured
with
digital
refractometer and adjusted to 7.5, 7.5 and
2.5ºBrix for soy milk, peanut milk and fresh
corn milk respectively by adding distilled
water. Blends of milk samples with different
proportion were made according to the
experimental design.
Film formation
Physico-chemical analysis
Measurement of total soluble solid (TSS)
Measurement of colour
CIE colour parameters L* (Lightness); a*
(red-green) and b* (yellow-blue) of the
sample
are
estimated
using
spectrophotometer (Model: ColorFlex EZ;
Make: Hunterlab, USA). Whiteness was used
to compare the colour difference between
different protein lipid films. The equation for
calculating whiteness wasby proposed by L.
Lei et al., (2007)
Whiteness = L*- 3b*
Measurement of film thickness
500 ml of milk formulation prepared
according to the experimental design was
poured in to the ohmic heating tray. The
ohmic heating parameters were set as 12 EFS
and 40 Hz. The temperature of composite
milk was controlled within 85 ± 3 oC. After7–
8 min, the first film was formed on the
surface. An L shaped plastic rod was slipped
under the film and then gently lifted, resulting
in a sheet film hung upon the rod (Fig. 3). The
film sheet was drained for a few seconds and
then hung to air dry(ambient dehydration) for
Thickness of double layer of protein lipid
films was measured by using vernier
caliper. The vernier caliper has least count of
0.1mm. Prior to the measurement, films were
dried in ambient temperature for 10-12 hr.
Proximate analysis
Total protein (Nitrogen x6.25) was analysed
using approved methods of Kjeldahl (AOAC,
1990) in automatic machine (Model: Kelplus
233
Int.J.Curr.Microbiol.App.Sci (2019) 8(3): 230-241
Classic DX; Make: Pelican, India).Fat content
of the protein-lipid film was analysed using
Soxhlet apparatus (Model: Socsplus- SCS06
AS; Make: Pelican, India).n-hexane was used
as solvent for fat extraction.
mixture component were used to generate the
design. Selected components and their
constraints for the mixture design of
experiments are shown in table 1.
Results and Discussion
Preliminary experiments
Yield
Preliminary experiments were conducted to
find the suitable maximum and minimum
values for the ingredients of the blend milk,
and also to find the suitable ohmic heating
parameter for the production of the better
protein-lipid film formation. Shivasankary et
al., (2015) used 12 V/cm of Electric field
strength and 40Hz frequency as optimized
parameter. In the preliminary experiment it
is observed that 12V/cm EFS and 40Hz
frequency were giving good results with
different combination of milk blends. For the
optimization of soy- peanut-corn milk of
formulations variable like protein content of
the film, colour, thickness, rehydration
capacity and yield were dependent parameters.
Experimental design
Based on preliminary studies, fixed ohmic
heating parameters, independent variable
with their ranges and dependent variable
were selected for the final experiment. The
fractions of components in a mixture cannot
be changed independently, and for this
situation the mixture designs are appropriate.
The nonnegative fractions must add up to 1
(Montgomery, 2009). Using Optimal Mixture
design (Cornell, 1983) sixteen milk
formulation were processed by mixing the
three basic ingredients; soy milk, peanut
milk and fresh corn milk. A mixture design
was programmed using Design Expert 10
software, to obtain 16 design points from
three components. The lower limit (soy milk0.4, peanut milk-0.2. corn milk- 0.0) and
upper bound constraints (soy milk- 0.6,
peanut milk-0.4. corn milk- 0.2) for each
Yield of the protein-lipid film for different
milk blends varies from 12.26 to 21.44 g
/100ml of milk. All the milk formulations
showed significant difference (p<0.05) in the
yield of the sample. The regression models
obtained by the measured values were
analyzed and fitted to various models. In
general, exploration of a fitted response
surface may produce poor or misleading
results, unless the model exhibits a good
fit, which makes checking of the model
adequacy essential (Table 2). The adequacy of
model summary output indicates that, the
cubic model was highly
significant
statistically for effect variables on yield.
Cubic model was found to have maximum
“Adjusted R-Squared” and “Predicted RSquared” values and hence the cubic model
was chosen for further analysis (Table 3).
The third-order polynomial equation in
terms of coded units the following
equations was generated by the application
of response surface methodology to obtain
the empirical relationship between the
experimental results on the basis of Mixture
design.
Yield (gm/100ml milk) = -146.654 * A +
116.706 * B + 99.0093 * C + 113.692 * AB +
151.342 * AC + -376.092 * BC + 136.715 *
ABC + 95.3469 * AB(A-B) + 498.712 *
AC(A-C) + -108.741 * BC(B-C)
In general, proceeding with exploration and
optimization using a fitted response surface
may produce unreliable results unless the
234
Int.J.Curr.Microbiol.App.Sci (2019) 8(3): 230-241
model exhibits an adequate fit (Omwamba
and Hu, 2009). This makes the checking of
model adequacy essential.
The results of analysis of variance (ANOVA)
for the optimal mixture design are shown in
Table 4. The ANOVA of Cubic model
demonstrates that the model is highly
significant as evident from Fisher’s F-test
value being 68.69. The coefficient of
determination, which is a measure of degree
of fit, was 0.990 for yield.
The adjusted R2 value obtained is 0.976.
Higher the value of coefficient of variation
(CV) shows lower reliability of experiment.
Here, a lower value of CV (2.94) indicated a
greater reliability of the experiments
performed.
Protein
Total protein percentage of the film varies
significantly with dependent variables.
Value of protein percentage varies from 52.2
to 61.03%. All the milk formulations
showed significant difference (p<0.05) in the
protein percentage of the sample. Model
summary output indicates that, the special
Quartic Vs Quadratic model was highly
significant statistically for effect variables on
Protein percentage of samples.
Protein (%) = 69.3534 * A + 75.5424 * B +
47.8811 * C + -49.3684 * AB + -20.0368 *
AC + - 35.9162 * BC + -38.4312 * A2BC + 362.907 * AB2C + 879.771 * ABC2
new data. The coefficient of variation value of
protein percentage is found to be very low,
0.93. The ANOVA of special Quartic Vs
Quadratic model demonstrates that the model
is highly significant as evident from Fisher’s
F-test value being 50.67 (Table 6).
Colour
Colour plays a major role in consumer
acceptability of protein-lipid films. Colour
values are compared using whiteness (L*3b*) value of the film. Average L*, b*and
L* -3b* value of 1st, 3rd, layer were
displayed in Table 7.
The whiteness value varied from -29.24 from
1.71. Colour didn’t have significant effect on
the whiteness of protein–lipid film even
though the whiteness was reduced by increase
in corn milk content. The corn milk plays
major role in determining the colour of the
films.
Thickness
Thickness of the protein lipid film was
measured using the vernier calliper after
drying in ambient condition for 10-12 hours.
The thickness of the developed film varies
from 0.70 to 1.01mm. Thickness of the
protein lipid film is not significantly affected
by the independent variables. Table 8 shows
the average thickness value protein-lipid
films of different milk formulations.
Rehydration capacity
The fit of these empirical models was also
checked by the coefficient of determination
(R2), the adjusted-R2, the predicted-R2, and
the Coefficient of variation (CV), see Table 5.
Adjusted R2 is 0.963 and Predicted R2 is
0.920 meaning that the full model is estimated
to explain about 92.37% of the variability in
Rehydration capacity was an important
character of protein–lipid film because it was
generally stored and sold in a dried condition.
During rehydration, the amount of water
absorbed increased fast in the time range of 1–
15 min.
235
Int.J.Curr.Microbiol.App.Sci (2019) 8(3): 230-241
At about 12min, it reached the maximum. At
last, the protein– lipid film regained a
considerable percentage of its original
moisture content. However rehydration
capacity is not significantly affected by
independent variable. The rehydration
capacity of protein– lipid film, measured
percentage weight gain, for 10-15 minutes,
for every formulation is shown in Table 9.
Optimal formulation
Responses
of
the
overall
The process parameters were optimized to
achieve
maximum.
Multi
response
optimization using all of the regression
models was performed with the DesignExpert software, using its defaults settings to
construct a desirability score that balances all
of the fitted models. The Figure 6 shows the
formulation that was considered optimal,
along with contours of the desirability score.
The methodology of desired function was
applied and the optimum level of various
process variables were obtained as, Soy milk
0.576Peanut milk 0.4 and corn milk 0.023,
which gives maximum of 21.44 g yield and
56.83% protein content with overall
desirability value of 0.81 (Fig. 4–6).
Table.1 Component constraints
Component
Fraction restriction
Soy milk (A)
0. 4 ≤A ≤0.6
Peanut milk (B)
0. 2 ≤B ≤0.4
Corn milk (C)
0.0 ≤ C ≤0.2
Table.2 Model adequacy indicators for responses
Response
R2
Adj-R2
Pred-R2
CV
2.
94
0.
93
Yield
0.9904
0.9760
0.9463
Protein
0.9830
0.9636
0.9209
Table.3 Model summary statistics
Source
Linear
Quadratic
Special Cubic
Cubic
Sp Quartic vs
Quadratic
Quartic vs Cubic
Quartic vs Sp
Quartic
Sequential
p-value
0.4295
0.0019
0.4409
0.0003
0.0187
0.7404
0.0123
Lack of Fit
p-value
0.0002
0.0022
0.0017
0.7404
0.0123
236
Adjusted
Predicted
R-Squared R-Squared
-0.0132
-0.2957
0.6859
0.5395
0.6745
0.5145
0.9760
0.9463
0.8833
0.5675
0.9719
0.9719
Suggested
Aliased
Aliased
Int.J.Curr.Microbiol.App.Sci (2019) 8(3): 230-241
Table.4 ANOVA for Yield of formulated milk blends
Source
Model
1
Linear Mixture
AB
AC
BC
ABC
AB(A-B)
AC(A-C)
BC(B-C)
Residual
Lack of Fit
Pure Error
SS
119.20
14.67
df
9
2
MS
13.24
7.34
F Value
68.69
38.05
p-value Prob > F
< 0.0001
0.0004
0.86
1.02
9.89
0.33
1.02
13.57
1.36
1.16
0.028
1.13
1
1
1
1
1
1
1
6
1
5
0.86
1.02
9.89
0.33
1.02
13.57
1.36
0.19
0.028
0.23
4.43
5.29
51.27
1.73
5.31
70.39
7.05
0.0798
0.0611
0.0004
0.2359
0.0608
0.0002
0.0378
0.12
0.7404
Cor Total
120.36
15
significant
not significant
Table.5 Model summary statistics
Source
Linear
Quadratic
Special Cubic
Cubic
Sp Quartic vs Quadratic
Quartic vs Cubic
Quartic vs Sp Quartic
Sequential
p-value
0.1871
0.0039
0.3226
0.0015
0.0003
0.6114
0.8559
Lack of Fit
p-value
0.0008
0.0075
0.0066
0.6114
0.8559
Adjusted
R-Squared
0.1084
0.6780
0.6810
0.9578
0.9636
0.9521
0.9521
Predicted
R-Squared
-0.3562
0.2417
0.2457
0.8677
0.9209
Table.6 ANOVA for Protein of formulated milk blends
Source
Model
1
Linear
Mixture
AB
AC
BC
A2BC
AB2C
ABC2
Residual
Lack of
Fit
Pure
Error
Cor Total
Sum of
Squares
116.14
26.85
df
8
2
Mean
Square
14.52
13.43
F
Value
50.67
46.87
p-value
Prob > F
< 0.0001
< 0.0001
0.20
0.027
0.10
0.022
1.16
11.27
2.01
0.12
1
1
1
1
1
1
7
2
0.20
0.027
0.10
0.022
1.16
11.27
0.29
0.060
0.68
0.093
0.36
0.077
4.04
39.33
0.4360
0.7696
0.5654
0.7896
0.0843
0.0004
0.16
0.8559
1.88
5
0.38
118.14
15
23
7
significant
not
significant
Suggested
Aliased
Aliased
Int.J.Curr.Microbiol.App.Sci (2019) 8(3): 230-241
Table.7 Colour values
Ru
n
R1
R2
R3
R4
R5
R6
R7
R8
R9
R1
0
R1
1
R1
2
R1
3
R1
4
R1
5
R1
L*
64.8
0
65.6
5
64.5
5
64.0
7
63.0
6
63.6
3
63.4
5
70.1
1
65.5
5
65.1
0
70.4
1
64.3
3
69.1
2
64.5
4
64.2
8
70.2
a*
3.9
2
4.2
0
4.1
0
3.8
7
3.5
5
4.3
5
3.6
4
3.6
9
3.5
1
2.9
6
2.5
3
3.7
9
3.7
0
3.2
8
3.2
8
2.5
b*
27.7
5
30.1
8
24.3
0
23.7
2
25.6
0
30.9
6
25.9
9
26.2
5
26.8
7
27.1
7
22.9
0
23.7
8
26.3
4
27.8
2
24.2
1
22.9
L*3b*
18.4
624.8
98.3
6
- 7.0
9
-13.7
5
29.2
4
14.5
1
- 8.6
15.0
-5
6 1.7
16.4
0-1
7.0
1
- 9.9
1
18.9
28.3
1.4
42
6 Table.8
7
6
5 values
Thickness
Run
R1
R2
R3
R4
R5
R6
R7
R8
R9
R10
R11
R12
R13
R14
R15
R16
Thickness
0.92
0.82
0.91
1.01
0.74
0.77
0.76
0.86
0.94
0.97
0.72
0.99
0.80
0.78
0.72
0.70
(mm)
Table.9 Rehydration data, percentage gain in water
Time,
min
10
136.27 112.50 97.08 51.08 110.73 92.59 114.41 102.33 93.75 84.57 77.94 77.34 100.00 80.14 135.48 88.93
12
143.52 118.27 106.57 59.71 121.47 101.65 122.52 106.20 103.33 92.57 86.83 85.25 109.63 84.25 141.94 98.21
14
148.70 125.96 112.04 66.91 124.86 104.94 125.23 111.63 109.17 98.86 95.73 93.53 110.55 86.99 143.23 108.93
16
152.85 125.96 112.04 70.74 125.42 105.76 125.23 114.73 110.42 100.00 95.73 98.20 113.76 87.67 149.03 110.00
R1
R2
R3
R4
R5
R6
R7
R8
R9
R10
R11
R12
Fig.1&2 Ohmic heating Setup & Ohmic heating tray
23
8
R13
R14
R15
R16
Int.J.Curr.Microbiol.App.Sci (2019) 8(3): 230-241
Fig.3 Freshly formed protein-lipid film
Fig.4 Contour plot of yield for different milk blends
A: soy
milk 0.8
2
12 14 2
00.2
24 20 18
22
16
14
2
2
12
0.6
B: peanut milk
20.4
C: corn milk
23
9
Int.J.Curr.Microbiol.App.Sci (2019) 8(3): 230-241
Fig.5 Contour plot of protein for different milk blends
A: soy milk
0.8
2
56
2
56
0
60
58
0.2
56
58
2
2
56
54
2
0.6
B: peanut milk
0.4
0.4
C: corn milk
Fig.6 Contour plot of optimal formulation for overall desirability
A: soy milk
0.8
2
0
Desirability
0.2 20.806887
A: soy milk
0.8
2
0.4
0.2
0
0.6
Prediction
21.44
12
14 2
24 20 18 16
22
A: soy milk
0.8
2
0.2
0
Prediction 56.8387
2
56
60
56
58
14
2
0.2
2
2
56
58 0.2
2
2
2
12
56
54
2
0.6
B: peanut milk
0.4
Desirability
2
0.4
C: corn milk
0.6
B: peanut milk
0.4
2
0.4
C: corn milk
Yield (gm/100ml milk)
In conclusion, design and analysis of an
optimal mixture experiment was used to
0.6
B: peanut milk
0.4
0.4
C: corn milk
Protein (%)
obtain the optimal formulation of milk blend
to develop composite protein lipid film from
24
0
Int.J.Curr.Microbiol.App.Sci (2019) 8(3): 230-241
soy milk, peanut milk and corn milk.
Analysis of variance revealed that not all the
responses are significantly affected by the
independent variables. Yield and protein
content are the two responses which have
significant effect on the formulated milk
blends. Other responses had shown no
effect with the formulated milk blends.
Obtained optimum level of various process
variables in fraction were as follows; Soy
milk 0.576, peanut milk 0.40 and 0.023. The
optimized combination different milk
formulation results a maximum response of
21.44g yield of the composite protein lipid
film with protein content of 56.83% with a
desirability value of 0.81. Responses like
colour, rehydration capacity and thickness
of the film found to have no significant
effect with the different milk formulations.
Long Lei, Han Zhi, Zhang Xiujin, Ishitani
Takasuke, Li Zaigui. (2007). Effects of
different heating methods on the
production of protein–lipid film.
Journal of Food Engineering 82 (2007)
292–297
Montgomery DC. (2009). Design and
analysis of experiments. 7th ed. John
Wiley & Sons;
Omwamba, M., & Hu, Q. (2009).
Antioxidant capacity andantioxidative
compounds in barley (Hordeum
vulgare L.) grain optimized using
response surface methodology in hotair
roasting. European Food Research and
Technology, 229,907-914
Prakash Maran, J., & Manikandan, S. (2012).
Response surface modeling and
optimization of process parameters for
aqueous extraction of pigments from
prickly pear (Opuntia ficus-indica) fruit.
Dyes and Pigments, 95, 465-472.
Qun. S, Xiujin. Z, Zhi. H, Zaigui LI and
Masayoshi SAITO(2009).Productivity
Properties of Protein-lipid Film (Yuba).
JARQ 43 (1), 25–31
Shivashankary, M, Akash Pare, Yadav B. K.,
Santhakumaran. A, (2015). Estimation
of Electrical Conductivity of Soymilk
with Varied TSS Levels using Ohmic
Heating. Trends in Bioscience, 8(3),
601-610.
Wu, L. C., & Bates, R. P. (1973). Influence
of ingredients upon edible protein–lipid
film characteristics. Journal of Food
Science, 38,783–787.
.Wu, L. C., & Bates, R. P. (1975). ProteinLipid Films as Meat Substitutes.
Journal of Food Science, 40, 160–163.
References
Bourtoom,(2009),. Edible protein films;
Properties enhanced. International food
Research Journal Vol.16 Vol. 1-9
Bradenburg, A. H., Weller, C. L. and Testin,
R. F.. Edible films and coatings from
soy protein. Journal of Food Science
Vol.58 (1993), pp. 1086-1089.
Cao Y.M. and Chang K.C. (2001).Edible
Films Prepared from Water Extract of
Soybeans. Journal of Food Science
Vol.67, Nr. 4, 1449-1454
Cornell. J. A. (1983). Experiment with
Mixture: designs, Models, and the
Analysis of Mixture data. John Wiley &
Sons
Enujiugha V. N., Ayodele R. O.,Seidu K. T.
(2013).IJAFS 4 (1&2), Pp 553-570
How to cite this article:
Ajesh Kumar, V., M. Pravitha and Akash Pare. 2019. Optimization of Composite ProteinLipid Film by Ohmic Heating using Mixture Design. Int.J.Curr.Microbiol.App.Sci. 8(03): 230241. doi: />
241