Evaluation of sodicity indices for non-saline sodic soils of Ramthal micro irrigation project area of UKP and their associated risks for horticultural crops
Bạn đang xem bản rút gọn của tài liệu. Xem và tải ngay bản đầy đủ của tài liệu tại đây (463.52 KB, 9 trang )
Int.J.Curr.Microbiol.App.Sci (2019) 8(2): 349-357
International Journal of Current Microbiology and Applied Sciences
ISSN: 2319-7706 Volume 8 Number 02 (2019)
Journal homepage:
Original Research Article
/>
Evaluation of Sodicity Indices for Non-saline Sodic Soils of Ramthal
Micro Irrigation Project Area of UKP and their Associated
Risks for Horticultural Crops
P.D. Lakshmi*, M.S. Nagaraja, Shankara Meti, R. Suma,
C.N. Pallavi and Anita E. Kondi
Department of Soil Science and Agricultural Chemistry, College of Horticulture, University of
Horticultural Sciences, Bagalkot, 587104, India
*Corresponding author
ABSTRACT
Keywords
Sodicity indices,
SAR, RSC,
Vertisols, Northern
Karnataka
Article Info
Accepted:
04 January 2019
Available Online:
10 February 2019
The presence of salts in soil is a common phenomenon. However, the extent of salts in a
soil is determined by soil type and the prevailing regional climate. The seasonal rainfall
and irrigation practices will alter the salt dynamics. A study was conducted in a small area
of the country’s largest micro-irrigation project – Ramthal Micro Irrigation Project of UKP
command. About 500 ha of the project area with about 25 m elevation was covered and
assessed for sodification risks. The sodicity indices viz. SAR, RSC, SSP and alkalinity
fraction were evaluated and compared with their elevation and slope factors. The soils
existing on flat and slope lands of high elevated areas were found prone for sodification
with higher sodicity indices. Contrastingly, the soil at lower elevation recorded lesser
sodicity. Solubility and precipitation reactions of different salts in the region might have
caused variation in sodicity indices. Though, the extent of soil salinity appears to be low,
there is risk of sodicity in the region. Thus, the selection of sodicity tolerant crops remains
crucial to make the project more successful.
of Na make them sodic soils (Chaabra, 1996;
Rengasamy and Sumner, 1998). Occurrence
of sodic soils with low salt content is also
possible and often observed in semi-arid
tracts (Sharma and Chaudhari, 2012). The
excess of sodicity with low total salt content
can also have similar effects as that of sodic
soils with high salt content. Large tracts of
soils of northern Karnataka possess high
amounts of salts and inherently low
productive due to scarcity of water as the
region falls under semi-arid conditions with
PET > RF. Though introduction of irrigations
Introduction
The occurrence of salts in soil is a common
phenomenon. However, the extent of salts in a
soil depends on the prevailing regional
environmental and soil factors (Sharma and
Chaudhary, 2012). Soils with higher amounts
of water soluble salts can cause yield
reductions and hence, they are categorized as
salt affected soils. Presence of higher amounts
of salts of Ca2+, Mg2+, Na+, K+ and Cl-1, SO42
, NO3-1, HCO3-1, CO3-2 etc. make them saline
soils while, dominance of HCO3-1 and CO3-2
349
Int.J.Curr.Microbiol.App.Sci (2019) 8(2): 349-357
in this region have enhanced productivity, it
has also induced secondary salinization
(Doddamani et al., 1994; Rudramurthy and
Dasog, 2001; Pradeep et al., 2006).
extremely low with average of rainfall of
about 630 mm. Accumulation of salts in the
surface is anticipated in these soils as PET >
RF in this region. However, seasonal rainfall
is likely to move these salts both vertically
and laterally.
Upper Krishna Project was one of the
ambitious projects across Krishna and
executed in 1980s at Almatti, Bagalkot
district to provide irrigations for large dry
tracts of northern Karnataka. Lift irrigation
was also adopted to lift the water to higher
elevation areas so as to enhance productivity.
However, the land productivity largely
depends on soil fertility as determined by soil
texture (Nagaraja et al., 2016), soil organic
matter, soil reaction (Dattaraja et al., 2017)
etc. To increase the area under irrigations
further, micro irrigation concept was adopted
at Ramthal in Hunugund taluka and the
irrigation project was called ‘Ramthal Micro
Irrigation Project’ with a provision of
providing assured protective irrigations to 2
ha of land of each farmer of the Ramthal
village cluster (command area). Considering
the introduction of irrigations to the rainfed
black soils, a study was carried out to assess
the sodicity risks associated in the new
Ramthal Micro irrigation project area by
evaluating different sodicity indices in the
region.
Ramthal Micro-irrigation Project Area of the
Upper Krishna Project is divided into two
large blocks and they are being operated by
Jain Irrigations and Netafim Irrigation
systems separately. Each block is divided into
22-25 zones covering an area of about 500 ha.
This study was carried out in zone 20 of
Netafim Project area with an elevation
gradient of about 20 mtrs. The topography of
the study area ranged from gentle to moderate
slopes and the soils were found to be in situ
formed with varying soil depths (deep soils at
high elevations and shallow soils at low
elevations).
Categorization of soil samples
Materials and Methods
The soil samples were categorized based on
the elevation and slope of the study area.
Considering the slope of 21 m and elevation
difference from 510 to 530 m, the soil
samples were categorized into 6 groups
namely, L1: High flat lands, L2: High slope
lands, L3: Mid flat lands, L4: Mid slope lands,
L5: Low flat lands and L6: Low slope lands.
Location and study area
Collection of soil samples
Hungund of Bagalkot district, coming under
Northern Dry Zone of Karnataka, largely
represents typical black soils and belongs to
Vertisols. The topography of the study area
exhibits gentle to moderate undulations and
experiences sub-tropical climate with dry
semi-arid conditions. The soils are mostly
derived from basaltic parent materials. The
mean annual temperature of the Hungund
taluk ranged from 33 to 36 oC (in the last 10
years) while, the annual precipitation is
The information on land and soils of the study
area prepared by NBSS & LUP, Netafim,
KSRSAC and Survey of India toposheets
were used in identification of the study area.
Each land unit of 2-5 ha was considered as a
sampling unit in the study location. Name of
the farmer, survey number and the exact
position of the sampling site were recorded
using Garmin GPS meter. Representative
surface soil samples (0-15cm) for each study
unit was collected by pooling of three soil
350
Int.J.Curr.Microbiol.App.Sci (2019) 8(2): 349-357
samples from the same sampling site. Pooled
samples were mixed, cleaned (stones, roots,
etc. removed) and collected about 500 g of
soil samples. The soil samples were air dried,
pounded, sieved and stored in air tight
containers for further analysis.
SAR (in
)
RSC (in meq/l) =
(Total Ca2+ + Mg2+)
Soil-water extraction and chemical analysis
SSP (in %)
The water soluble salts were extracted from
soil-water suspension in the ratio of 1:2 by
shaking 50 g soil with 100 ml of distilled
water for 30 mins. After 10 minutes, the
supernatant was centrifuged at 1500 rpm for
20 min and then, filtered to obtain the clear
extract. These extracts were stored in
refrigerator for chemical analysis. The water
extractable cations namely, Ca and Mg (by
Versanate titration; Baruah and Barthakur,
1999) and Na (by flame photometry; Sarma et
al., 1987) were determined. Similarly, water
extractable anions namely total carbonates, Cl
and SO42- were determined by acid-base
titrations, by Mohr’s AgNO3 titration method
and turbidometric method respectively
(Sarma et al., 1987; Baruah and Barthakur,
1999).
Alkalinity
(Total carbonates) –
Fraction
(a
ratio)
Results and Discussion
Soil reaction (pH)
conductivity (EC2.5)
and
Electrical
The extent of two important soil
electrochemical properties namely pH and EC
in Ramthal Project study area are presented in
Table 1 and their magnitudes across different
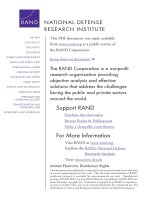
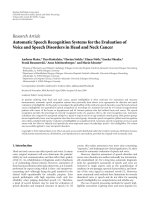
land categories are depicted in Figure 1. The
topography had influenced both pH and EC
significantly. The soils at lower elevations
(L3) areas recorded significantly lower pH
(8.80 ± 0.23) while, the soils existing on high
elevations recorded higher pH values (9.15 ±
0.24).
Sodicity indices
The dominance of alkalinity forming ions
viz., sodium and total carbonates (CO32- +
HCO3-) over calcium and magnesium
determines the soil susceptibility for
sodification (Chaabra, 1996; Sharma and
Chaudhari, 2012). Thus, the soil chemical
properties were assessed in terms of RSC Residual Sodium Carbonate; SAR - Sodium
Adsorption Ratio; SSP - Soluble Sodium
Percentage; and Alkalinity Fraction. The
concentrations of respective ions in meq/L
were used in deriving the above indices
values using the following formulae.
The electrical conductivity (EC2.5 – 1:2.5 soil
water suspension) ranged from 0.10 to 0.36
dS m-1. All the soil samples in the study area
were observed under non saline category with
EC2.5 values of < 0.8 dS m-1. In Ramthal study
area, nearly 64% (n=151) of soil samples
recorded medium conductivity in the range of
0.15 to 0.30 dS m-1, while, 27 % of soil
samples (n =64) recorded conductivity of <
0.15 dS m-1. Low elevation (L3) areas
recorded significantly lower EC values (0.16
± 0.04 dS m-1) while, the soils at higher
elevations (L1 and L2) recorded high EC2.5
values. In general, the soils existing on of
slopy lands recorded higher pH and
conductivity values.
The formulae used for different sodicity
indices are given below
351
Int.J.Curr.Microbiol.App.Sci (2019) 8(2): 349-357
The conductivity of soils reflects the amount
of water soluble salts while, the soil reaction
is determined by the type of ions in a given
soil (Bohn et al., 2001). The presence of base
forming cations such as calcium, magnesium
and sodium are known to increase the soil pH.
The soils of arid and semiarid region are
known to have higher amounts of salts due to
low rain fall and high evapotranspiration
(Chabbra,
1996).
Movement
and
accumulation of water soluble salts is likely to
be more severe in black soils. Higher pH and
EC2.5 ratios in high elevation areas may be
attributed to deep clayey soils exhibiting
higher capillary movement during summer
(Singh and Verma, 2016). Higher movement
of carbonates and sodium salts due to their
high solubility might have induced higher pH
(Kirankumar et al., 2015; Lakshmi et al.,
2018).
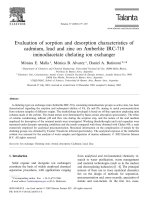
sodification/ alkalization. Extent of variations
in RSC and SAR values among different land
categories and their spatial spread in the study
area are presented in Table 2 and Figures 2.
In general, the RSC values were found in
safer limits though the carbonates and
bicarbonates were more than calcium and
magnesium contents in soil solution. The RSC
values ranged from -1.98 meq l-1 in mid
elevation flat lands (L3) to 3.51 meq l-1 in
high elevation flat land soils (L1). Nearly 70
per cent of the soil samples (n = 166) were
found with medium RSC values while, only
10 per cent of the samples recorded higher
RSC values (> 2 meq l-1). Similarly, the SAR
values ranged from 2.90 to 20.65 (meq/l)½. In
the study area, majority of the soil samples
(nearly 2/3rd) were found safe from
sodification with values of < 10 (meq/l)½.
However, 30 % of the soil samples indicated
moderate sodicity risks with > 10 (meq/l)½.
The soils of this region are mostly derived
from basalts and lime based parent materials
thus, the soils are rich in the above bases and
the aridity (PET > RF) also might have
contributed (Kirankumar et al., 2015; Rekha
et al., 2015). Alternate wetting and drying
cycles in this region encourage total
carbonates and increase soil pH further
(Pradeep et al., 2006; Shivakumar and
Nagaraja, 2016). Similar values of higher pH
in these soils were reported earlier by
Doddamani et al., (1994); Rudramurthy and
Dasog, (2001); Pradeep et al., (2006).
Howeer, the EC2.5 values were substantially
lower
compared
to
irrigated
areas
(Kirankumar et al., 2015; Rekha et al., 2015;
Ashwin et al., 2017).
It was observed that the soils existing in high
elevated areas were relatively more
susceptible for sodification compared to low
and mid elevated areas. The soils existing on
flat and slopy lands of high elevated areas (L1
and L2), exhibited significantly higher SAR
values of 11.51 ± 2.78 (meq /l) ½ and 12.66 ±
3.10 (meq /l) ½ respectively. Least mean SAR
values were observed in slopy lands (L6) low
elevation 8.78 ± 2.09 (meq /l) ½ and the values
were found on par with soils existing at mid
elevation and low elevation areas.
Similarly, the soils existing slopy lands
existing at higher elevation (L2) recorded
significantly higher RSC values (1.41 ± 0.93
meq l-1) followed by high elevation flat areas
(L1) (0.96 ± 0.91 meq l-1). Contrastingly, the
soils on slopy lands at low elevations (L6)
recorded least RSC values (0.26 ± 1.10
meq l-1). This could be attributed to
preferential adsorption of divalent Ca2+ and
Mg2+ ions (Lakshmi et al., 2018;
Sharanagouda et al., 2018).
Residual sodium carbonate (RSC) and
sodium adsorption ratio (SAR)
The relative dominance of sodium and total
carbonates over calcium and magnesium in
soils is commonly indicated as SAR and RSC
values. The RSC and SAR values are used to
assess the susceptibility of a soil for
352
Int.J.Curr.Microbiol.App.Sci (2019) 8(2): 349-357
Table.1 Extent of variations in pH and EC of black soils of Ramthal irrigation project area
EC (dS m-1)
pH
Land Category
Low
(8.0 - 8.5)
Medium
(8.5-9.0)
High
(> 9.0)
Low
(<0.15)
Medium
(0.21–0.30)
High
(> 0.30)
L1-High elevation flat land (n = 77)
-
20 (8.4)
57 (24.1)
11 (4.6)
57 (24.1)
9 (3.8)
L2-High elevation sloppy land (n = 20)
-
6 (2.5)
14 (5.9)
2 (0.8)
11 (4.6)
7 (2.9)
L3-Mid elevation flat land (n = 95)
2 (0.8)
47 (19.9)
46 (19.4)
35 (14.8)
57 (24.5)
3 (0.8)
L4-Mid elevation slopy land (n=26)
1 (0.42)
14 (5.9)
11 (4.6)
7 (2.9)
17 (7.2)
2 (0.8)
L5-Low elevation flat land (n = 11)
-
9 (3.8)
2 (0.8)
8 (3.3)
3 (1.2)
-
L6-Low elevation sloppy land (n = 7)
-
4 (1.6)
3 (1.2)
1 (0.4)
6 (2.5)
-
3 (1.2)
100 (42.3)
133 (56.3)
64 (27.1)
152 (64.4)
20 (8.4)
Total (n = 236)
Table.2 Extent of variations in RSC and SAR values of black soils of Ramthal project area
RSC (meq L-1)
Land Category
SAR (meq L-1)½
Low
(<1.25)
Medium
(1.25 – 2.5)
High
(>2.5)
Low
(<10)
Medium
(10– 18)
High
(18-26)
Very high
(>26)
L1-High elevation flat land (n = 77)
46 (19.4)
25 (10.5)
6 (2.5)
20 (8.4)
54 (22.8)
3 (1.2)
-
L2-High elevation sloppy land (n = 20)
10 (4.2)
8 (3.3)
2 (0.8)
3 (1.2)
16 (6.7)
1 (0.4)
-
L3-Mid elevation flat land (n = 95)
62 (26.2)
25 (10.5)
8 (3.3)
58 (24.5)
32 (13.5)
5 (2.1)
-
L4-Mid elevation slopy land (n=26)
17 (7.2)
5 (2.1)
4 (1.6)
15 (6.3)
11 (4.6)
-
-
L5-Low elevation flat land (n = 11)
6 (2.5)
5 (2.1)
-
4 (1.6)
7 (2.9)
-
-
L6-Low elevation sloppy land (n = 7)
6 (2.5)
1 (0.4)
-
4 (1.6)
3 (1.2)
-
-
147(62.2)
69(29.2)
20(8.4)
104(44)
123(52.1)
9(3.8)
0 (0)
Total (n = 236)
353
Int.J.Curr.Microbiol.App.Sci (2019) 8(2): 349-357
Table.3 Extent of soluble sodium percentage (SSP) and alkalinity fraction in black soils of
Ramthal project area
Land Category
L1-High elevation flat land (n = 77)
L2-High elevation sloppy land (n = 20)
L3-Mid elevation flat land (n = 95)
L4-Mid elevation slopy land (n=26)
L5-Low elevation flat land (n = 11)
L6-Low elevation sloppy land (n = 7)
Total (n = 236)
Soluble Sodium Percentage
Low
Medium
Low
(<60)
(60 – 75)
(<60)
4 (1.6)
4 (1.6)
26 (11.0)
4 (1.6)
7 (2.9)
3 (1.2)
4 (1.6)
40 (16.9)
4 (1.6)
Alkalinity Fraction
Medium
Low
Medium
(60 – 75)
(<60)
(60 – 75)
4 (1.6)
4 (1.6)
26 (11.0)
4 (1.6)
26 (11.0)
7 (2.9)
7 (2.9)
3 (1.2)
3 (1.2)
40 (16.9)
4 (1.6)
40 (16.9)
Fig.1 Effect of slope and elevation on pH and EC
Fig.2 Effect of slope and elevation on RSC and SAR
354
Int.J.Curr.Microbiol.App.Sci (2019) 8(2): 349-357
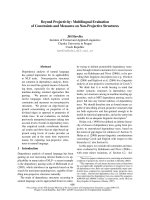
Fig.3 Effect of slope and elevation on soluble sodium percentage (SSP) and alkalinity fraction
Thus, the cations present in soil water are
preferentially retained on soil colloids during
capillary movement of water (Bohn et al.,
2001; Tan, 2013). Similar reports on
dominance of divalent cations were also
reported by Yogeeshappa et al., 2013; Anita
et al., 2018; Rekha et al., 2018; In other
words, there is more mobility of Na+ than
divalent cations (Ca2+ and Mg2+). This could
be the reason for observing significantly
higher RSC and SAR values at higher
elevations (Bohn et al., 2001; Tan, 2013).
significantly high SSP values of 85.5 ± 4.2
and 84.3 ± 4.3 respectively. The soils present
on sloppy land at lower elevations (L6)
recorded significantly lower values (78.2 ±
6.2 %). Thus, the soils existing at higher
elevations indicated higher sodicity risks
compared to the soils existing at mid and low
elevations (Figure 3).
The alkalinity fraction ranged from 0.14 to
0.69 (a ratio without any units). Nearly 80 per
cent of the soil samples (n = 186) were
observed with medium alkalinity values. High
alkalinity values of >0.4 were recorded in
about 15 per cent of samples (n = 35). The
values of alkalinity fraction of different soils
and its spread across Ramthal study area is
presented in table 3 and depicted in figures 2.
In the study area the alkalinity fraction ranged
from 0.14 to 0.69. > 70 per cent of the soil
samples (n= 186) were in medium alkalinity
values. All the samples were significantly
different.
Soluble sodium percentage (SSP) and
alkalinity fractions
The dominance of sodium and associated
risks of sodification can also be measured by
its relative proportion to the total cations
present in soil water extract as soluble sodium
percentage (SSP) and alkalinity fraction. The
corresponding SSP and alkalinity values of
soils representing different slopes and
elevations are presented in Table 3 and Figure
3. The SSP values ranged from 53.6 to 92.3
per cent and > 80 per cent of the soil samples
(n=192) were observed with high SSP values.
Only four soil samples were observed in low
sodicity risk category with < 60 per cent SSP
values. The areas situated at higher elevations
on slopy (L2) and flat lands (L1) exhibited
These two indices also indicated that high
elevated areas were more susceptible for
sodification. This could be due to
precipitation
of
exchangeable-Ca
as
respective carbonates during alternate wetting
and drying cycles. Solubility of CO2 in soil
water at high temperature might have
355
Int.J.Curr.Microbiol.App.Sci (2019) 8(2): 349-357
enhanced such precipitation reactions (Bohn
et al., 2001; Tan, 2013).
and Sukumar, R., 2018, Woody‐plant
diversity in relation to environmental
factors in a seasonally dry tropical
forest
landscape,
Journal
of
Vegetation Science, 29 (4): 704-714.
Doddamani, V.S., Bidari, B.I. and Hebsur,
N.S., 1994, Physical and chemical
features of soils of upper Krishna
project derived from diverse parent
materials. Karnataka Journal of
Agricultural Science, 7(2): 146-149.
Kirankumar S, Nagaraja MS, Suma R, Ashok
Alur S., 2015, Extent of soil
sodification as influenced by different
irrigation water sources in a typical
black soil of Karnataka, An Asian
Journal of Soil Science, 10: 159-162.
Lakshmi, P.D., Nagaraja, M.S., Prasanna,
S.M., Shankara Meti and Tanveer, A.,
2018, Vertical distribution of cations
and anions along the slope in a vertisol
of dry land areas representing northern
dry zone of Karnataka, International
Journal of Chemical Studies, 6(5):
1617-1620.
Nagaraja, M.S., Bharadwaj, A.K., Prabhakara
Reddy, G.V., Srinivasamurthy, C.A.,
Sandeep Kumar, 2016, Estimations of
soil fertility in physically degraded
agricultural soils through selective
accounting of fine earth and gravel
fractions. Solid Earth, 7:897-903.
Pradeep, R., Dasog, G.S. and Kuligod, V.S.,
2006, Nutrient Status of Some
Groundnut Growing Soils of Upper
Krishna Command Area, Karnataka,
Karnataka J. Agric. Sci., 19(1): 131133.
Rekha, M.V., Kirankumar, S., Ashok Alur, S.,
Nagaraja, M.S. and Suma, R., 2015,
Effect of irrigation water sources on
micronutrients availability in a typical
black soil of northern Karnataka.
Andhra
Pradesh
Journal
of
Agricultural Sciences, 1:75-79.
Rekha, M.V., Anita, E.Kondi, Champa, B.V.,
Sodicity risks for horticultural crops
These observations clearly indicate the
sodification risks associated in the Rmathal
Micro-Irrigation project area. Sodifiction in
soils can induce specific ion toxicities
especially for vines, stone fruits, beans and
potatoes. Meanwhile, nutrient imbalance in
terms of uptake of Ca and Mg by plant roots
can also be anticipated. Thus, periodical
monitoring of these soils and introduction of
suitable midterm corrections are necessary to
achieve higher productivity in these water
scarcity semi arid regions.
References
Anita, E.K., Prashant, C.T., Champa, B.V.,
Shivanna, M. and Nagaraja, M.S.,
2018, Secondary and micronutrient
status in soils of wine and table type
grape orchards of northern Karnataka.
International Journal of Chemical
Studies, 6(3): 2335 – 2338.
Ashwin, H. S., Irappa N. Nagaral, Ashok S.
Alur and Nagaraja, M. S., 2017. Effect
of different irrigation water sources on
soil sodification in typical black soils
of Karnataka, International Journal of
Current Research, 9 (02): 4727847280.
Baruah, T.C. and Barthakur, H.P., 1999, Text
Book of Soil Analysis. Vikas
publishing House Pvt. Ltd. New
Delhi.
Bohn, H. L., Meneal, L. B. and Connor, O.
A., 2001, Soil Chemistry, John Wiley
and Sons.
Chhabra, R., 1996, Soil Salinity and Water
Quality, Oxford and IBH publishing
Co. Pvt. Ltd., New Delhi.
Dattaraja, H.S., Pulla, S., Suresh, H.S.,
Nagaraja, M.S., Srinivasamurthy, C.A.
356
Int.J.Curr.Microbiol.App.Sci (2019) 8(2): 349-357
Ashok, S. Alur and Nagaraja, M.S.,
2018, Fertility Status of Major
Cropping Systems Existing in Black
Soils of Mudhol Taluka of Northern
Karnataka,
India,
International
Journal of Current Microbiology and
Applied Sciences, 7(05): 2829-2836
Rengasamy, P., 2010, Soil processes affecting
crop production in salt-affected soils.
Fundamentals of Plant Biology,
37:613-620.
Rengasamy, P. and Sumner, M.E., 1998,
Processes
involved
on
sodic
behaviour. In Sodic Soil: Distribution,
Management and Environmental
Consequences, Sumner, M.E. and
Naidu, R. (eds). Oxford University
Press: New York; 35–50.
Rudramurthy, H. V. and Dasog G. S., 2001,
Properties and genesis of associated
red and black soils in north Karnataka.
Journal of Indian Society of Soil
Science, 49: 301-309.
Sarma, V.A.K., Krishnan, P. and Budhihal,
S.L., 1987, Laboratory Methods,
Technical Bulletin, No. 14, NBSS
LUP. Nagpur, pp. 89.
Sharanagouda, S.M., Nagaraja, M.S., Suma,
R., Prasanna, S.M. and Kantesh, G.,
2018, Micronutrient availability status
among land categories irrigated with
different water sources in Bilagi and
Bagalkot
Talukas,
International
Journal of Chemical Studies 2018;
6(5): 2831-2834.
Sharma, D.K. and Chaudhari, S.K., 2012.
Agronomic research in salt affected
soils of India: An overview. Indian
Journal of Agronomy, 57: 175-185.
Shivakumar, K.M. and Nagaraja, M.S., 2016.
Micronutrient status in soils of chilli
grown areas of UKP command area,
Karnataka, An Asian Journal of Soil
Science, 11(2): 337-340.
Shivakumar, K.M., Nagaraja, M.S., Champa,
B.V. and Kuligod, V.B., 2010.
Response of chili to applied nutrients
and its influence on important soil
properties in the upper Krishna project
command. Karnataka Journal of
Agricultural Science, 23: 437-441.
Singh A.K. and Verma S.K., 2016, Hydrophysical Properties and Solute
Movement in Black Alkali Soils. In:
Dagar J., Sharma P., Sharma D., Singh
A.
(eds)
Innovative
Saline
Agriculture. Springer, New Delhi
Tan, K.H., 2013. Principles of Soil
Chemistry, CRC Press, London.
Yogeeshappa, H., Tolanur, I.S. AND
Lakshmipathi, N.R., 2013, Studies on
physico-chemical
properties
of
different vineyards in Bijapur Taluk,
Karnataka. African Journal of
Agricultural Research, 8(16): 14771481.
How to cite this article:
Lakshmi, P.D., M.S. Nagaraja, Shankara Meti, R. Suma, C.N. Pallavi and Anita E. Kondi.
2019. Evaluation of Sodicity Indices for Non-saline Sodic Soils of Ramthal Micro Irrigation
Project Area of UKP and their Associated Risks for Horticultural Crops.
Int.J.Curr.Microbiol.App.Sci. 8(02): 349-357. doi: />
357