Assessment of the ecological quality status of sediment at the organic shrimp farming ponds in Ca Mau province by applying the abundance/biomass comparison (ABC) method on nematode
Bạn đang xem bản rút gọn của tài liệu. Xem và tải ngay bản đầy đủ của tài liệu tại đây (1.09 MB, 9 trang )
50
SCIENCE AND TECHNOLOGY DEVELOPMENT JOURNAL:
NATURAL SCIENCES, VOL 2, ISSUE 3, 2018
Assessment of the ecological quality status of
sediment at the organic shrimp farming ponds in
Ca Mau province by applying the
abundance/biomass comparison (ABC) method
on nematode communities
Tran Thanh Thai, Nguyen Thi My Yen, Ngo Xuan Quang, Le Dieu Linh
Abstract—Nematode communities in the Tam
Giang’s organic shrimp farming ponds, Nam Can
district, Ca Mau province were investigated in three
seasons (March - dry, July - transfer and November rainy season). Results showed that the average
abundance (inds/10 cm2) ranged from 221.67 ±
122.08 to 2539.33 ± 1403.33 in the dry season. The
tranfers and rainy season also showed a high density,
from 1020.00 ± 354.30 to 7254.67 ± 5454.39, 822.00 ±
1086.17 – 4608.33 ± 1302.02, respectively. Total dry
biomass (µg/10 cm2) of nematode communities in
Tam Giang’s organic shrimp farming ponds varied
from 51.11 ± 28.64 to 450.87 ± 49.53 in the dry, from
412.93 ± 291.87 to 1607.25 ± 507.42 in the transfer
and ranged 49.54 ± 39.36 to 1874.09 ± 3033.16 in the
rainy season. The following results were also
recorded that abundance/biomass comparison (ABC)
method has been used successfully for detecting the
ecological quality status of sediment (EcoQ) in Tam
Giang’s organic shrimp farming ponds. The results
indicated that unfavourable deflections (stress) in
EcoQ of Tam Giang’s organic shrimp farming ponds
throughout the dry - transfer - rainy season. More
specifically, the EcoQ of Tam Giang’s organic
shrimp farming ponds has been classified as lightly
stressed in most seasons, excpet for the transfer
season which has been recognized as the highest
EcoQ depending on its ABC curves and W values.
Although EcoQ in the Tam Giang’s organic shrimp
farming ponds has always been clear, information on
Received 05-01-2017, accepted 14-08- 2017, published 129-2018
Author: Tran Thanh Thai, Nguyen Thi My Yen, Ngo Xuan
Quang- Department of Environmental Management and
Technology, Institute of Tropical Biology, Vietnam Academy
of Science and Technology, Le Dieu Linh - Ton Duc Thang
University -
the main cause effected biomass between natural
stress or pollution stress remains uncertain.
Index Term—Abundance/Biomass Comparison,
bioindicator, ecological quality status of sediment,
nematode communities, organic shrimp farms
1. INTRODUCSION
I
n Vietnam, the expanding shrimp farming area
is an important precursor of rapid reduction of
mangrove forests occurred in the last century [1].
National policies have been attempting to reduce
these impacts through the development and
widespread dissemination of the organic shrimp
farming model. This is a new approach that
preserves the critical environmental protection
provided by the mangroves while also providing a
sustainable basis for the shrimp farming industry.
According to Vietnam’s Ministry of Agriculture
and Rural Development, Ca Mau province is one
of the Vietnam’s largest shrimp production and
farming areas [2]. However, despite the biggest
area of mangrove forests and organic shrimp
farming, there are lack of information about the
model of organic shrimp farming [3[. In the last
few years, several studies have until recently
referred only to survey of the physic - chemical
characteristics [4, 5], plankton and meiofauna
communities in the organic shrimp farming ponds
(OSFP) [3, 6].
Many researches are notable in that shrimps
have been described as omnivorous scavengers
which feed on a variety of large quantities of
organic detritus, silt, sand and sand consisted
mainly of benthic organisms [7, 8]. Nematodes are
TẠP CHÍ PHÁT TRIỂN KHOA HỌC & CÔNG NGHỆ:
CHUYÊN SAN KHOA HỌC TỰ NHIÊN, TẬP 2, SỐ 3, 2018
51
a pivotal position in freshwater and marine
benthic.
and one hundred nematode specimens were used
for making slides and identification processed
according to De Grisse (1969) [19].
2. MATERIALS AND METHODS
Nematodes were identified to genus level by
using the following literature: Warwick et al.
(1988) [20], Zullini (2005) [21], Nguyen (2007)
[22] and the NeMys online identification key [23].
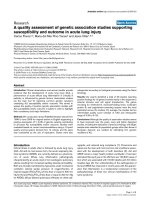
Study areas
The Nam Can district is a coastal area of Ca
Mau province belong to the Mekong Delta region
of Vietnam that covered an area of 533 km². Nam
Can has been recorded as the large areas of
mangrove forests. It could be one of the major
reasons why the Nam Can district encompasses the
largest area of organic shrimp farms [17]. Besides
the big river of Cua Lon with also large areas of
mangroves, Tam Giang commune (a rural
commune of Nam Can district, forms a roughly
95.31 km2) created favourable conditions for the
development and widespread dissemination of the
model organic shrimp farms. Currently, black tiger
shrimp (Penaeus monodon) is widely farmed in
this area [4].
Fig. 1. Map of the sampling stations
Sampling and laboratory techniques
Nematode samples were collected by mean of
10 cm2 cores, pushed into the sediment at least 10
cm depth. In each of these ponds, three replicates
were collected (right, middle and left bank of
pond). All samples were fixed in a 7%
formaldehyde solution (heated to 60°C) and gently
stirred. In the laboratory, samples were sieved
through a 38 µm mesh and extracted by flotation
with Ludox - TM50 (specific gravity of 1.18) [18].
Samples were stained with 3–5 mL Rose Bengal
solution 1%. All individual numbers were counted
Data analysis
Nematode dry biomass was calculated by
measuring the maximum length (L - µm),
excluding the filiform tails, and the maximal body
width (W - µm) of nematodes using an image
analyzer (Axiocam Zeiss). Individual nematode
wet biomass (μg) was calculated using Andrassy's
formula for body mass [24]: Wet biomass (μg) = L
× W2/1600000, where L represents the nematode
length (μm) and W the nematode width (μm). The
individual dry biomass (μg) was estimated as 25%
of the wet biomass [25]. Total dry biomass was
then calculated by all individual genus biomass,
and the total number of nematode per sample
measured, and their corresponding average
abundances.
The ABC curves were used to detect the EcoQ
in Tam Giang’s OSFP. This method involves the
plotting of k - dominance curves for species
abundances and species biomasses on the same
graph and making a comparison of these curves
forms. The species ranked in order of importance
in terms of abundance or biomass on a logarithmic
scale (x - axis) against percentage dominance on a
cumulative scale (y - axis). The relative position of
these curves has been suggested as a measure of
the degree of stressed. There are three levels of
environmental disturbance: Under an unstressed
environment the biomass curve overlies the
abundance curve for its entire length as an
indication of the dominance of a few large species
(k - selected species). In a highly stressed, the
abundance curve overlies the biomass curve as a
result of numerically dominance of a few
opportunistic species with small body sizes (r selected species). The degree and direction of the
separation of these curves, which represents the
area between the two curves is given by the W statistic [26] and expressed as:
W = 2(pA – pB)/(S - 1)
In which: pA and pB are the “average species
rank” for abundance and biomass and S is the
52
SCIENCE AND TECHNOLOGY DEVELOPMENT JOURNAL:
NATURAL SCIENCES, VOL 2, ISSUE 3, 2018
number of species. W - statistic takes values in the
range (-1 to 1) with W close to 1 for equal
abundances across species but biomass dominated
by a single species, and W close to -1 for the
converse case indicating that the biomass curve
lies below the abundance curve and thus the more
stressed the community and degraded the system.
The ABC curves were drawn using the statistical
software PRIMER VI of Plymouth Marine
laboratory, UK.
Two way ANOVA test was carried out to
compare the abundance and total dry biomass
between seasons (dry – transfer - rainy) and
between ponds (CM1 – CM8). All variables were
log - transformed to normalize their distributions
before analysis. All statistical analysis were
performed using the software STATISTICA 7.0. P
- Values < 0.05 were considered significant.
3. RESULTS AND DISCUSSION
Nematode abundance and total dry biomass
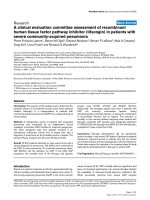
The results of present study showed that
nematode communities in Tam Giang’s OSFP
were characterized by high abundance through
three surveys. In the dry season, the average
abundance (inds/10 cm2) ranged from 221.67 ±
122.08 (CM7) to 2539.33 ± 1403.33 (CM6). The
tranfers and rainy season also showed a high
density, from 1020.00 ± 354.30 (CM6) to 7254.67
± 5454.39 (CM5), 822.00 ± 1086.17 (CM5) –
4608.33 ± 1302.02 (CM4), respectively (Fig. 2A).
Regarding total dry biomas (µg/10cm2), in the dry
season varied from 51.11 ± 28.64 to 450.87 ±
49.53, it is lower than the transfer season (ranged
from 412.93 ± 291.87 to 1607.25 ± 507.42) and
the rainy season (measured from 49.54 ± 39.36 –
1874.09 ± 3033.16) (Fig. 2B).
The two way ANOVA showed significant
differences for pond, season and the interaction
terms season * pond effect on total dry biomass at
the 95% confidence level (p – pond = 0.006, p –
seasons = 0.02 and p – pond * season = 0.04).
However, significant differences between pond
and season for nematode abundance were found (p
– pond = 0.02, p – seasons = 0.005 and p – pond *
season = 0.20).
Fig. 2. The average and standard deviation for nematode abundance (A) and total dry biomass (B)
The ecological quality status of sediment was
indicated
by
the
abundance/biomass
comparison method
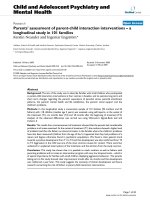
In the dry season, the genus Ptycholaimellus and
Terschellingia were known as the dominant
genera. More specifically, the abundance (inds/10
cm2) of Ptycholaimellus was 167.32 ± 286.83 in
CM1, 235.55 ± 178.28 in CM6, Terschellingia was
327.30 ± 189.99 in CM2, 151.67 ± 35.15 in CM4.
However, they have a low biomass. For example,
in CM1 and CM6, total dry biomass (µg/10 cm2)
of Ptycholaimellus was 23.55 ± 40.73, 19.68 ±
12.17, respectively. Hence, the ABC curves for the
abundance and dry biomass generally showed
stress and moderate condition in most of these
ponds (Fig. 3). Stressed condition was observed
mostly in the dry season, except for CM3 and
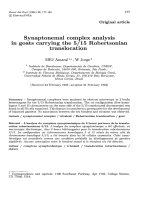
CM7 were classified as moderate. Genera
contributing more to the biomass in transfer season
were Pomponema and Sphaerolaimus in CM1
TẠP CHÍ PHÁT TRIỂN KHOA HỌC & CÔNG NGHỆ:
CHUYÊN SAN KHOA HỌC TỰ NHIÊN, TẬP 2, SỐ 3, 2018
(215.96 ± 110.05, 211.61 ± 302.48, respectively).
In addition, Terschellingia was an abundant genus
as well as dominated in biomass in transfer season
(3249.19 ± 4603.88 inds/10 cm2, 466.13 ± 688.16
µg/10 cm2, respectively). Contrary to the EcoQ in
the dry season, the ABC curves in the transfer
season indicated unstressed condition in most of
the ponds (4 out of 8). Unstressed condition was
observed in CM1, CM3, CM6, CM7, while
moderately stressed condition was noticed in CM2,
53
CM8. The ponds CM4, 5 had been classified as
stressed condition (Fig. 4). In the rainy season, the
ABC curves and W values showed stressed and
moderately stressed condition in most of the ponds
(Fig. 5) whereas unstressed condition was
observed only in one pond (CM4). The genera
Terschellingia and Daptonema have been
recognized as the highest biomass as well as
number of individuals.
Fig. 3. The ABC curves and W values in the dry season
54
SCIENCE AND TECHNOLOGY DEVELOPMENT JOURNAL:
NATURAL SCIENCES, VOL 2, ISSUE 3, 2018
Fig. 4. The ABC curves and W values in the transfer season
TẠP CHÍ PHÁT TRIỂN KHOA HỌC & CÔNG NGHỆ:
CHUYÊN SAN KHOA HỌC TỰ NHIÊN, TẬP 2, SỐ 3, 2018
55
Fig. 5. The ABC curves and W values in the rainy season
In Vietnam, there are many scientific studies
provided information about mangrove forest, but
too few studies mentioned of the OSFP. The
present study is one of the first research that use
nematode communities to detect the environmental
stress on the OSFP. In general, the ABC curves
and W values indicated that a lightly stressed in
EcoQ in most seasons, except for the transfer
56
SCIENCE AND TECHNOLOGY DEVELOPMENT JOURNAL:
NATURAL SCIENCES, VOL 2, ISSUE 3, 2018
season which has been recognized as the highest
environmental sediment quality. Nguyen et al.
(2017)
warned
that
the
environmental
characteristics in Tam Giang’s OSFP may also be
not quite optimal for shrimp farming, such as high
percentage of TN, TOC, low pH and anaerobic
condition in the sediment [4]. It could be one of
the major reasons why the EcoQ in Tam Giang’s
OSFP was classified as lightly stressed in most
seasons.
Application of the ABC method to detect the
EcoQ in OSFP, Ca Mau province for classification
of communities as stressed, or unstressed, is
strongly influenced by the presence of these genera
that dominate both the biomass and individuals
curve, e.g. Ptycholaimellus , Terschellingia,
Pomponema, Sphaerolaimus, and Daptonema. It is
known that, Terschellingia selected as indicators
of a poor ecological quality status because of their
well - known tolerance to pollution [27], the
genus Daptonema is typically found in organically
rich, muddy sediment [28] and has been proposed
to be representative of a community that is well
adapted to stressed conditions [29]. The indicator
genus Sphaerolaimus is again known to inhabit
stressed and anoxic sediments [30]. By contrast,
Ptycholaimellus,
Pomponema
have
been
recognized as the most sensitive to ecological
disturbance [11].
Some limitations for the use of ABC method
Two approaches were developed for detecting
the structural and functional responses of
nematode
communities
to
natural
and
anthropogenic disturbances: (i) the taxonomic
approach such as taxonomic diversity, maturity
index and trophic diversity [11, 12], and (ii) non taxonomic approaches such as comparison of
abundance/biomass curves (ABC method) were
based on sound ecological principles instead of on
statistical properties. The ABC curves are a
sensitive indicator of natural, physical and
biological disturbance as well as pollution induced
disturbances [31]. These curves are used by some
authors for detecting the physical disturbances and
stress [32, 33, 34, 35]. However, unfortunately, it
did not show the abilities to discriminate the main
factors effected biomass between natural stress and
pollution - induced stress [36].
Stress is a disturbance applied to a system by a
stressor which is foreign to that system or which
may be natural to it. Pollution is an obvious
stressor [37]. Indeed, stress is an characteristic of
the normal function of the ecosystems [38]. Stress
is also from normal ecosystems [39] and in any
cases, the physical disturbance and instability of
sediments were the main factors rather than
pollution in maintaining the macrobenthic
communities [33]. In using ABC method, ecologist
expertise will not know the cause of the
disturbance, if available, because the response of
ecosystems is similar to both natural
environmental stress and other stress. The ABC
method did not show the abilities to discriminate
the main factors effected biomass between natural
stress and pollution stress. Many researches have
concentrated on ecosystem responses, e.g. changes
in community structure (ABC method). Hence, we
include the ecosystem, physiological and
biochemical variables in our study, we can find
main cause effected biomass between natural stress
or pollution stress. In this study, the ABC curves
and W values indicated that a lightly stressed in
sediment environmental quality in most seasons in
a year, expecially in for the transfer season. The
main cause may be a natural environmental stress
(pH, temperature, salinity, etc.). Further research
should be combined ABC method and physic chemical values to potentially increase the precise
answer of this issue.
4. CONCLUSION
These empirical data combined with the field
survey ones data indicate ABC method has been
used successfully for detecting EcoQ in Tam
Giang’s OSFP, Ca Mau province. The results
showed that a lightly stressed EcoQ in most
seasons, expecially in the transfer season which
has been recognized as the highest EcoQ.
However, ABC curves, used as a method for
detecting disturbance effects without prior
knowledge of the site, is certainly restricted and
needs further investigation. No single method of
analysis is likely to produce stress classifications
without unacceptable misclassifications. The
ecological stress, from any source, is best
measured by multiple methods or analyses with
different assumptions.
TẠP CHÍ PHÁT TRIỂN KHOA HỌC & CÔNG NGHỆ:
CHUYÊN SAN KHOA HỌC TỰ NHIÊN, TẬP 2, SỐ 3, 2018
REFERENCES
[1].
[2].
[3].
[4].
[5].
[6].
[7].
[8].
[9].
[10].
[11].
[12].
[13].
[14].
[15].
[16].
P.N. Hong, H.T. San. Mangroves of Vietnam, 7, UCN,
1993.
Ministry of Agriculture and Rural development, 2016.
Accessed 1 May. 2016.
T.T. Thai, N.T.M. Yen, N. Tho, N.X. Quang, Meiofauna
in the mangrove–shrimp farms ponds, Ca Mau
province, Journal of Science and Technology, 55, 3, 271
– 284, 2017.
N. Tho, N.V. Ut, R. Merckx, Physico ‐ chemical
characteristics of the improved extensive shrimp farming
system in the Mekong Delta of Vietnam, Aquaculture
Research, 42, 11, 1600–1614, 2011.
N. Tho, N.D. Hung, Hydrogeochemical characteristics
and constraints in the organic shrimp model at Tam
Giang commune, Nam Can district, Ca Mau province,
Journal of Science, 14, 6, 80–90, 2017.
D. Johnston, M. Lourey, D. V. Tien, T.T. Luu, T.T.
Xuan, Water quality and plankton densities in mixed
shrimp‐mangrove forestry farming systems in
Vietnam, Aquaculture Research, 33, 10, 785–798, 2002.
C.L. Marte, The food and feeding habit of Penaeus
monodon Fabricius collected from Makato river, Aklan,
Philippines (Decapoda Natantia), Crustaceana, 38, 3,
225–236, 1982.
L. Robertson, A.L. Wrence, F. L. Castille, Effect of
feeding frequency and feeding time on growth of
Penaeus vannamei (Boone), Aquaculture Research, 24,
1, 1–6, 1993.
N. Majdi, W. Traunspurger, Free - living nematodes in
the freshwater food web: a review, Journal of
Nematology, 47, 1, 28 – 44, 2015.
N.X. Quang, N.N. Chau, N. Smol, L. Prozorova, A.
Vanreusel, Intertidal nematode communities in the
Mekong estuaries of Vietnam and their potential for
biomonitoring, Environmental
Monitoring
and
Assessment, 188, 2, 1–16, 2016.
T. Bongers, R. Alkemade, G.W. Yeates, Interpretation of
disturbance - induced maturity decrease in marine
nematode assemblages by means of the Maturity
Index, Marine Ecology Progress Series, 76, 135–142,
1991.
W. Wieser, Die Beziehung zwischen Mundhöhlengestalt,
Ernährungsweise und Vorkommen bei freilebenden
marinen nematoden, Arkiv for Zoology., 4, 439–484
(1953).
R. Warwick, A new method for detecting pollution
effects on marine macrobenthic communities, Marine
Biology, 92, 4, 557–562, 1986.
R.K. Clarke, R.M. Warwick. Changes in Marine
Communities: an Approach to Statistical Analysis and
Interpretation. Plymouth Marine Laboratory, Plymouth,
1994.
N.V. Thanh, Using the ABC method and BMWP
Vietnam score for biological rapid assessment water
quality of Cau river, Journal of Science and
Technology, 43, 1, 58–68, 2005.
N.T.M. Yen, T.T. Thai, N. X. Quang,, Applying the ABC
curve method of free – living nematode communities to
[17].
[18].
[19].
[20].
[21].
[22].
[23].
[24].
[25].
[26].
[27].
[28].
[29].
[30].
[31].
57
assess the environmental quality of water in Sai Gon
River harbors, Vietnam Journal of Science, Technology
and Engineering, 14, 3, 35–41, 2017.
Ca
Mau
Newpaper
/>ewsid=4425. Accessed 13 October. 2009.
M. Vincx. Methods for the examination of organismal
diversity in soils and sediments, Wallinfort, UK: CAB
International, 1996.
T.A. De Grisse. Redescription ou modifications de
quelquestechnique utilis [a] es dan l'etude des n [a]
ematodes phytoparasitaires. Meded. Rijksfakulteit
Landbouwwetenschappen, Gent, 1969.
M.R. Warwick, H.M. Platt, J. P. Somerfield. Free living
marine nematodes. Part III. Monhysterids, The Linnean
Society
of
London
and
the
Estuarine and Coastal Sciences Association, London,
1988.
A. Zullini. The Identification manual for freshwater
nematode genera, Lecture book, MSc Nematology Ghent
University, 2005.
N.V. Thanh. Fauna of Vietnam. Free-living nematodes
ordersMonhysterida, Araeolaimida, Chromadorida,
Rhabditida, Enoplida, Mononchida and Dorylaimida,
Science Technology Publication, Hanoi, 2007.
J. Vanaverbeke, T.N. Bezerra, U. Braeckman, A. De
Groote, N. De Meester, S. Deprez, S. Derycke, K.
Guilini, F. Hauquier, L. Lins, T. Maria, T. Moens, E.
Pape, N. Smol, M. Taheri, J. Van Campenhout, A.
Vanreusel, M. Wu, M. Vincx, NeMys: World Database of
Free-Living
Marine
Nematodes.
Accessed
at
on 2016-11-26.
I. Andrássy, The determination of volume and weight of
nematodes, Acta Zoologica, 2, 1–15 (1956).
W. Wieser, Benthic studies in Buzzards Bay. II. The
meiofauna, Limnology and Oceanography, 5, 2, 121–
137, 1960.
R.K. Clarke, Comparisons of dominance curves, Journal
of Experimental Marine Biology and Ecology, 138, 1,
143–157, 1990.
F. Semprucci, M. Balsamo, F. Frontalini, The nematode
assemblage of a coastal lagoon (Lake Varano, Southern
Italy): ecology and biodiversity patternsm, Scientia
Marina, 78, 4, 579–588, 2014.
M. Schratzberger, K. Warr, I. S. Rogers, Patterns of
nematode populations in the southwestern North Sea and
their link to other components of the benthic
fauna, Journal of Sea Research., 55, 2, 113–127, 2006.
A. Vanreusel, Ecology of the free-living marine
nematodes from the Voordelta (Southern Bight of the
North Sea). I. Species composition and structure of the
nematode communities, Cahiers de Biologie Marine, 31,
4, 439–462, 1990.
K.T. Gyedu - Ababio,P. J. Furstenberg, D. Baird, A.
Vanreusel, Nematodes as indicators of pollution: a case
study from the Swartkops River system, South
Africa, Hydrobiologia, 397, 155–169, 1999.
R.M. Warwick, Comparative study of the structure of
some tropical and temperate marine soft-bottom
macrobenthic communities, Marine Biology, 95, 4, 641–
649, 1987.
58
SCIENCE AND TECHNOLOGY DEVELOPMENT JOURNAL:
NATURAL SCIENCES, VOL 2, ISSUE 3, 2018
[32]. S.J. Gray, M. Aschan, R.M. Carr, R.K. Clarke, H.R.
Green, H. T. Pearson, M. R. Warwick, Analysis of
community attributes of the benthic macrofauna of
Frierfjord/Langesundfjord and in a mesocosm
experiment, Marine Ecology Progress Series, 46, 151–
165, 1988.
[33]. M.R. Warwick, R.K. Clarke, A statistical analysis of
coral community responses to the 1982–83 El Niño in the
Thousand Islands, Indonesia, Coral Reefs, 8, 4, 171– 179,
1990.
[34]. R.B.J. Agard, J. Gobin, R.M. Warwick, Analysis of
marine macrobenthic community structure in relation to
pollution, natural oil seepage and seasonal disturbance in
a tropical environment (Trinidad, West Indies), Marine
Ecology Progress Series, 92, 3, 233 – 243, 1993.
[35]. E. Mahmoudi, H. Beyrem, L. Baccar, P. Aïssa, Response
of free-living Nematodes to the quality of water and
sediment at Bou Chrara Lagoon (Tunisia) during winter
2000, Mediterranean Marine Science, 3, 2, 133–146,
2002.
[36]. D.R.A. Shepherd, M.R. Warwick, R.K. Clarke, E.B.
Brown, An analysis of fish community responses to coral
mining in the Maldives, Environmental Biology of
Fishes,, 33, 4, 367–380, 1992.
[37]. W.G. Barrett, Stress ecology: An integrative approach.
Stress effects on natural ecosystems/edited by GW Barrett
and R. Rosenberg, 1981.
[38] F.D. Boesch, R. Rosenberg, Response to stress in marine
benthic communities. Stress effects on natural
ecosystems/edited by GW Barrett and R. Rosenberg,
1981.
[39] I.S. Auerbach, Ecosystem response to stres: A review of
concepts and approaches. Stress effects on natural
ecosystems/edited by GW Barrett and R. Rosenberg,
1981.
Đánh giá chất lượng môi trường sinh thái
nền đáy trong các ao nuôi tôm sinh thái ở
tỉnh Cà Mau bằng áp dụng phương pháp
ABC (Abundance/Biomass Comparison)
lên quần xã tuyến trùng
Trần Thành Thái1,2, Nguyễn Thị Mỹ Yến1, Ngô Xuân Quảng1, Lê Diệu Linh3
1
Viện Sinh học Nhiệt đới, Viện Hàn lâm Khoa học và Công nghệ Việt Nam, 2 Trường Đại học Khoa học Tự nhiên, ĐHQG-HCM,
Trường Đại học Tôn Đức Thắng
3
Tác giả liên hệ:
Ngày nhận bản thảo: 05-01-2017, ngày chấp nhận đăng: 14-08-2017, ngày đăng: 12-09-2018
Tóm tắt—Quần xã tuyến trùng tại 8 ao nuôi tôm
sinh thái tại xã Tam Giang, huyện Năm Căn, tỉnh Cà
Mau được khảo sát trong 3 mùa (tháng 3 – mùa khô,
tháng 7 – chuyển mùa và tháng 11 – mùa mưa). Kết
quả cho thấy mật độ trung bình của quần xã (cá
thể/10 cm2) dao động từ 221,67 ± 122,08 đến 2539,33
± 1403,33 trong mùa khô. Chuyển mùa và mùa mửa
cũng ghi nhật mật độ cao (1020,00 ± 354,30 đến
7254,67 ± 5454 và 39, 822,00 ± 1086,17 – 4608,33 ±
1302,02, tương ứng). Tổng sinh khối khô trung bình
(µg/10 cm2) của quần xã tuyến trùng trong các ao
tôm từ 51,11 ± 28,64 đến 450,87 ± 49.53 ở mùa khô,
từ 412,93 ± 291,87 đến 1607,25 ± 507,42 ở chuyển
mùa và từ 49,54 ± 39,36 đến 1874,09 ± 3033,16 trong
mùa mưa. Phương pháp ABC (Abundance/Biomass
Comparison) đã được áp dụng thành công trong
đánh giá chất lượng môi trường sinh thái nền đáy
trong 8 ao tôm sinh thái. Kết quả ghi nhận hầu hết
các ao trong 3 mùa khảo sát có hệ sinh thái nền đáy
đang bị xáo trộn nhẹ (stressed). Tuy nhiên, chuyển
mùa có chất lượng nền đáy tốt nhất trong 3 mùa
khảo sát. Mặc dù kết quả đánh giá được hiện trạng
sinh thái nền đáy ở các ao tôm nhưng nguyên nhân
gây ra sự xáo trộn đó do điều kiện tự nhiên tác động
hay do ô nhiễm còn chưa được sáng tỏ.
Từ khóa—Ao tôm sinh thái, chất lượng sinh thái
nền đáy, chỉ thị sinh học, quần xã tuyến trùng, so
sánh sinh khối/mật độ